• Panoramica
  • Recensioni (44)
  • Commenti (17)
  • Novità

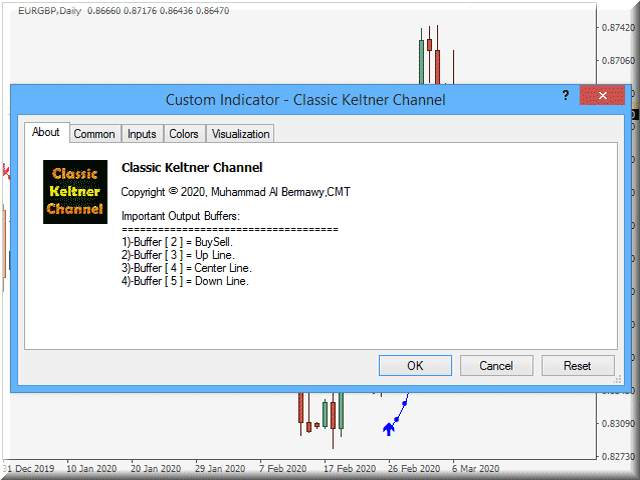
Classic Keltner Channel

4.9

o CKC.

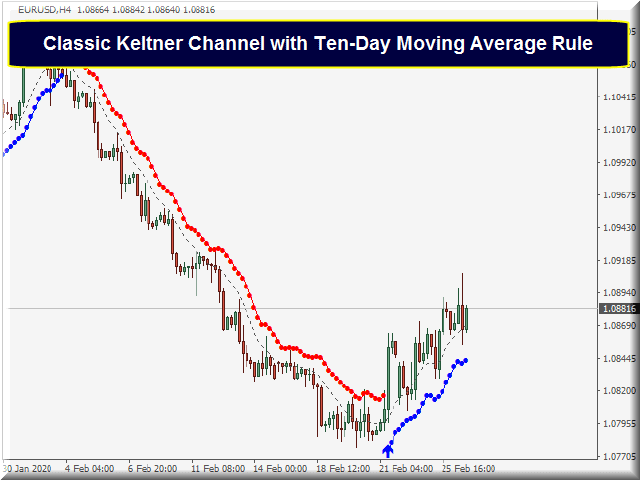
Questo indicatore funziona in base alla classica regola della media mobile a dieci giorni descritta da Chester W. Keltner (1909–1998). Tutti i parametri sono impostati di default sulla versione classica del sistema Keltner, mentre l'utente può modificarli se lo desidera.

Informazioni importanti

    Leggi il manuale CKC:https://www.mql5.com/en/blogs/post/736577
        Esempio di consulente esperto CKC:https://www.mql5.com/en/blogs/post/734150


          Informazioni sulla formula del canale Keltner

          1. Calcola la linea centrale come una media mobile semplice dal prezzo tipico (= (massimo + minimo + chiusura) / 3).

          2. Calcolare l'intervallo medio giornaliero (ADR) che è la differenza media tra massimo e minimo, con lo stesso periodo e metodo di calcolo per la linea centrale.

          3. Linea di acquisto Keltner = Linea centrale + ADR.

          4. Linea di vendita Keltner = Linea centrale – ADR.


          Regola della media mobile di Keltner a 10 giorni

          La formula di Keltner porta a creare due linee di base sul grafico.

            1. Linea di acquisto Keltner.Questa è la linea in cui copri la tua posizione di vendita e vai a comprare.

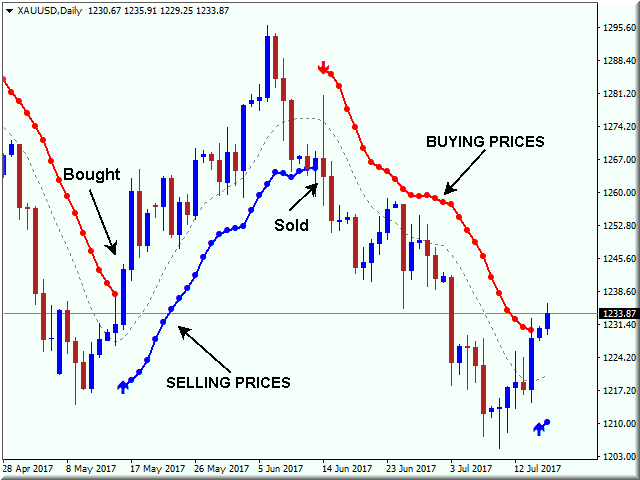
            2. Linea di vendita Keltner.Questa è la linea in cui copri la tua posizione di acquisto e vai a vendere.

              Utilizzando queste due linee abbiamo ottenuto regole di trading che dipendono dal principio "Start and Reverse" ampiamente utilizzato nell'analisi tecnica.

                1. Quando la linea del prezzo si chiude sopra la linea di acquisto Keltner (la linea rossa), allora acquista. Usa Keltner Sell Line (la linea blu) come stop e reverse dall'acquisto alla vendita.

                2. Quando la linea del prezzo si chiude sotto la Keltner Sell Line (la linea blu), vendi. Usa Keltner Buy Line (la linea rossa) come stop e reverse dalla vendita all'acquisto.
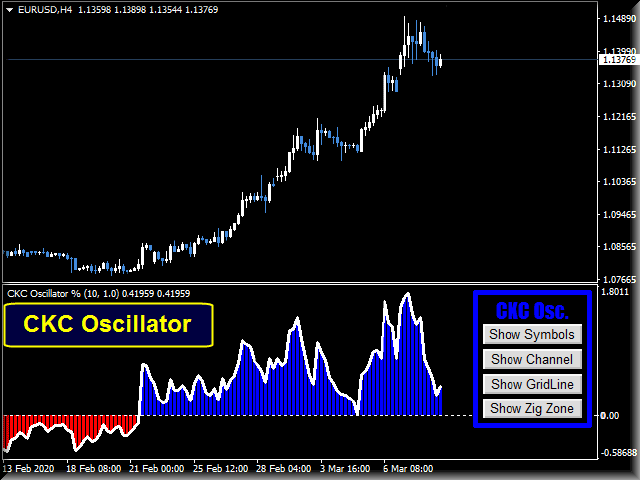
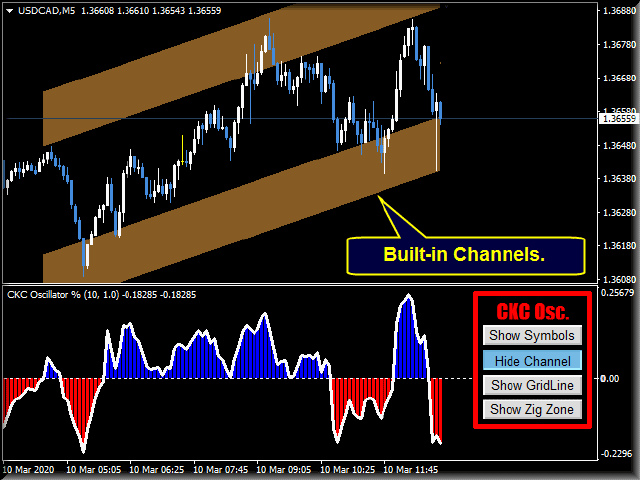
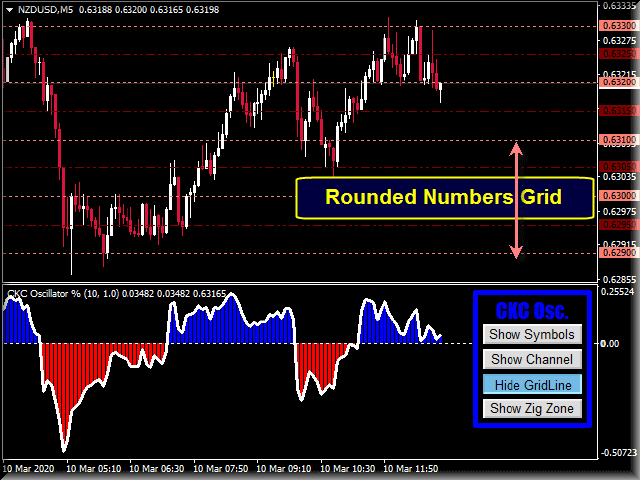
                  Caratteristiche CKC

                    CKC non ridipinge o ricalcola i suoi risultati.

                    Funziona su criptovalute, azioni, indici, petrolio, oro e su tutti i tempi.

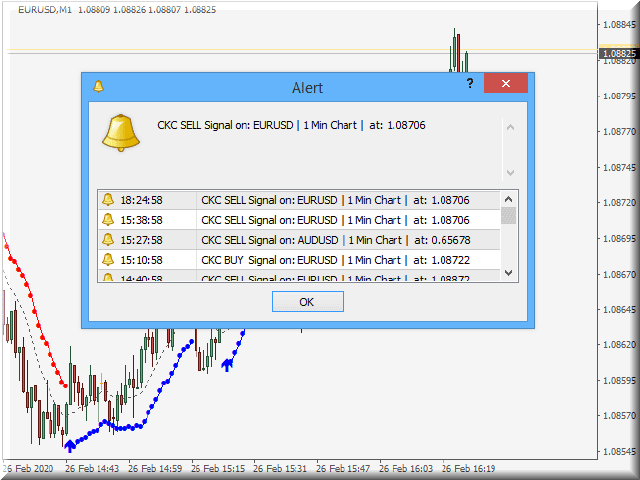
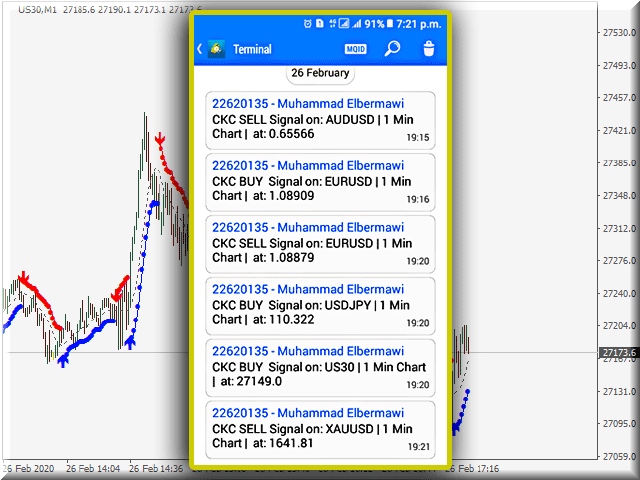
                    Suono, avvisi e-mail e notifiche mobili.

                    Acquista, vendi frecce per aiutare a identificare i segnali di tendenza.

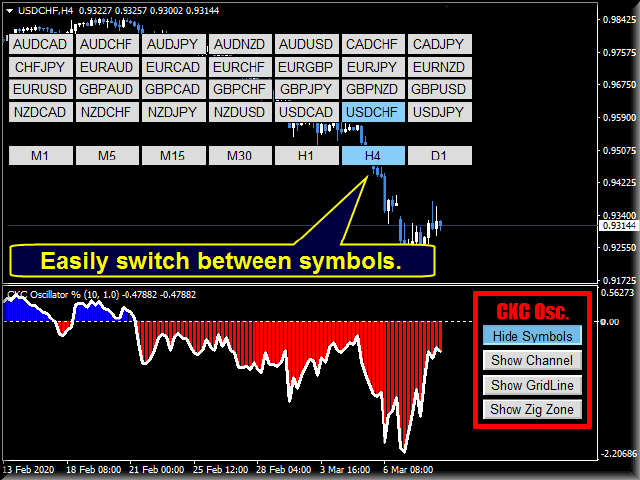
                    Parametri ben progettati per aiutare l'utente a navigare facilmente tra di loro.

                    Buffer per creare i tuoi consulenti esperti.

                    Quattro diversi elenchi di colori tra cui scegliere.

                    Parametri CKC

                    (1) PARAMETRI INDICATORI

                    • Candele CKC.Il numero di candele utilizzato nei calcoli delle fasce (il valore predefinito è 10 candele).
                    • Moltiplicatore di gamma CKC.Di quanto si separerà la linea di acquisto/vendita di Keltner dalla loro linea centrale (l'impostazione predefinita è 1.0).
                    • Metodo della media mobile CKC.Tipo di media mobile utilizzato nei calcoli (l'impostazione predefinita è la media mobile semplice).
                    • Prezzo applicato CKC.Prezzo utilizzato nei calcoli della linea centrale Keltner (il prezzo tipico è l'impostazione predefinita).

                    (2) AVVISI

                    • Allarme sonoro.Scegliere di utilizzare o interrompere il suono e il messaggio di avviso (l'impostazione predefinita è true).
                    • Invia una email.Opzione per inviare un'e-mail all'utente (l'impostazione predefinita è false).
                    • Invia notifica mobile.Opzione per inviare una notifica mobile all'utente (l'impostazione predefinita è false).

                    (3) STILE INDICATORE

                    • Elenco colori grafico.Puoi scegliere tra quattro diversi elenchi di colori (l'impostazione predefinita è Non fare nulla).
                    • Colore fascia superiore CKC.L'impostazione predefinita è Rosso.
                    • Colore banda inferiore CKC.L'impostazione predefinita è blu.
                    • Larghezza CKC.L'impostazione predefinita è uno.


                    Se hai domande, contattami tramite un messaggio privato o scrivile nella sezione commenti.
                    Muhammad Al Bermaui, CMT


                    Recensioni 20
                    udayan datta
                    691
                    udayan datta 2024.01.27 11:51 
                     

                    Indicator looks perfectly good and working fine, looking forward to learn it

                    leroy
                    305
                    leroy 2023.06.03 01:25 
                     

                    I started reading about the Keltner Channel and was surprised to see a simple yet effective indicator being sold/rented for a good price. I recently just rented the indicator and plan to test it out with my personal strategy. Thanks for creating this indicator!

                    elite luis
                    3331
                    elite luis 2023.03.06 14:06 
                     

                    Author very responsive and fully provide video tutorial on how to use, add as another layer of confluence nice! Thanks!

                    Prodotti consigliati
                    Fibonacci retracements can be used to draw support lines, identify resistance levels, place stop-loss orders and set target prices. The Advanced Automatic Fibonacci retracements draws automatically all the levels. You have a lot of options to choose. For exemple you can use the tracements of another time frame (MTF) in the current chart, you can also choose between the closest level or less close to draw the retracements. You can also add 2 levels of your choice. You can add levels extensions o
                    YK-Fibo Pivot Indicator: Trade Smarter with Fibonacci Pivot Points The YK-Fibo Pivot Indicator is a powerful technical analysis tool that combines the precision of Fibonacci retracements with the insights of Pivot Points. Whether you're a novice or seasoned trader, this indicator empowers you to spot profitable opportunities in the market with ease. Why Choose YK-Fibo Pivot? Pinpoint Support & Resistance: By calculating Fibonacci levels based on the previous day's high, low, and close prices, y
                    Classic Fractals indicator for MT4, with additional Trendlines connecting the latest couples of fractals ( fractals are showing highest high, and lowest low on each period) Rules for trendlines: -if new top fractal is below the last one = new resistance line -if new bot fractal is above the last one = new support line -Trendlines can be hidden -Fractals can be hidden Fractal Period = can be both even or uneven number, as it is setting for half (one side) of the bars sequence
                    Koala Fibo Base Time
                    Ashkan Hazegh Nikrou
                    3 (1)
                    Welcome to Koala Fibo Base Time Welcome to Koala Fibo Time Zone Welcome to Koala Fibo Time Extention Welcome to Missed Tool For Meta Trade! Simple Introduction : Fibonacci Time Zones are vertical lines based on the Fibonacci Sequence. These lines extend along the X axis (date axis) as a mechanism to forecast reversals based on elapsed time. A major low or high is often chosen as the starting point. Distances start relatively small and grow as the Fibonacci Sequence extends. Chartists can exten
                    FREE
                    The Penta-O is a 6-point retracement harmonacci pattern which usually precedes big market movements. Penta-O patterns can expand and repaint quite a bit. To make things easier this indicator implements a twist: it waits for a donchian breakout in the right direction before signaling the trade. The end result is an otherwise repainting indicator with a very reliable trading signal. The donchian breakout period is entered as an input. [ Installation Guide | Update Guide | Troubleshooting | FAQ | A
                    Volume by Price MT4
                    Brian Collard
                    4.71 (14)
                    The Volumebyprice.com Indicator for MetaTrader 4 features Volume Profile and Market Profile TPO (Time Price Opportunity). Volume and TPO histogram bar and line charts. Volume Footprint charts. TPO letter and block marker collapsed and split structure charts. Static, dynamic and flexible range segmentation and compositing methods with relative and absolute visualizations. Session hours filtering and segment concatenation with Market Watch and custom user specifications. Graphical layering, posit
                    Il Catturatore di Tendenza: La Strategia del Catturatore di Tendenza con Indicatore di Allarme è uno strumento versatile di analisi tecnica che aiuta i trader a identificare le tendenze di mercato e i potenziali punti di ingresso e uscita. Presenta una Strategia dinamica del Catturatore di Tendenza, adattandosi alle condizioni di mercato per una chiara rappresentazione visiva della direzione della tendenza. I trader possono personalizzare i parametri in base alle loro preferenze e tolleranza
                    FREE
                    Il nostro indicatore Basic Support and Resistance è la soluzione necessaria per aumentare l'analisi tecnica.Questo indicatore consente di proiettare i livelli di supporto e resistenza sul grafico/ MT5 gratuita Funzionalità Integrazione dei livelli di Fibonacci: Con la possibilità di visualizzare i livelli di Fibonacci insieme a livelli di supporto e resistenza, il nostro indicatore ti dà una visione ancora più profonda del comportamento del mercato e delle possibili aree di inversione. Ott
                    Murrey Math Multi Timeframe Indicator Support/Resistance  Murrey Math Lines are strong tools to plot the support and resistance levels. Murrey Math Multi Timeframe Indicator draws multi timeframe MM lines on a smaller tf chart. General Information: According to Gann, prices move in 1/8's, these 1/8's act as points of price support and resistance as an entity's price changes in time. Given this 1/8 characteristic of price action, Murrey assigns properties to each of the MML's in an a given
                    VR Cub
                    Vladimir Pastushak
                    VR Cub è un indicatore per ottenere punti di ingresso di alta qualità. L'indicatore è stato sviluppato per facilitare i calcoli matematici e semplificare la ricerca dei punti di ingresso in una posizione. La strategia di trading per la quale è stato scritto l'indicatore ha dimostrato la sua efficacia per molti anni. La semplicità della strategia di trading è il suo grande vantaggio, che consente anche ai trader alle prime armi di commerciare con successo con essa. VR Cub calcola i punti di apert
                    The PUA MultiType Pivot indicator is built on the daily chart of the previous day. The PUA MultiType Pivot indicator is one of the most popular tools in technical analysis, used by traders to identify potential reversal points in financial markets. This indicator constructs three types of Pivot points: Classic, Fibonacci, and Camarilla, each offering its unique approach to market analysis. The advantages of this indicator include: Simplicity and Clarity PUA MultiType Pivot provides clearly defi
                    Noize Absorption Index MT4
                    Ekaterina Saltykova
                    5 (1)
                    Noize Absorption Index - is the manual trading system that measures the difference of pressure between bears forces and bulls forces. Green line - is a noize free index that showing curent situation. Zero value of index shows totally choppy/flat market.Values above zero level shows how powerfull bullish wave is and values below zero measures bearish forces.Up arrow appears on bearish market when it's ready to reverse, dn arrow appears on weak bullish market, as a result of reverse expectation. S
                    Automatic fibonacci with alerts is an indicator that automatically plots a fibonacci retracement based on the number of bars you select on the BarsToScan setting in the indicator. The fibonacci is automatically updated in real time as new highest and lowest values appear amongst the selected bars. You can select which level values to be displayed in the indicator settings. You can also select the color of the levels thus enabling the trader to be able to attach the indicator several times with d
                    Free automatic Fibonacci is an indicator that automatically plots a Fibonacci retracement based on the number of bars you select on the BarsToScan setting in the indicator. The Fibonacci is automatically updated in real time as new highest and lowest values appears amongst the selected bars. You can select which level values to be displayed in the indicator settings. You can also select the color of the levels thus enabling the trader to be able to attach the indicator several times with differe
                    FREE
                    TWO PAIRS SQUARE HEDGE METER INDICATOR Try this brilliant 2 pairs square indicator It draws a square wave of the relation between your two inputs symbols when square wave indicates -1 then it is very great opportunity to SELL pair1 and BUY Pair2 when square wave indicates +1 then it is very great opportunity to BUY pair1 and SELL Pair2 the inputs are : 2 pairs of symbols         then index value : i use 20 for M30 charts ( you can try other values : 40/50 for M15 , : 30 for M30 , : 10 for H1 ,
                    Automatic redrawing of Trend Supports and resistances levels and Possible Wedge pattern formation to indicate price breaking of Rising Wedge (signal SELL) or price breaking of falling Wedge (signal BUY) Very simple and smart indicator  ALERTS AND MOBILE NOTIFICATIONS availavle !!! you can edit the calculation bars of the bars count for formation of the trend lines and the initial shift from current price  Smaller values for bars /shift inputs when using Higher Time frames (D1-H4) and the reverse
                    Daily Candle Predictor è un indicatore che prevede il prezzo di chiusura di una candela. L'indicatore è destinato principalmente all'uso sui grafici D1. Questo indicatore è adatto sia per il trading forex tradizionale che per il trading di opzioni binarie. L'indicatore può essere utilizzato come sistema di trading autonomo o può fungere da aggiunta al sistema di trading esistente. Questo indicatore analizza la candela corrente, calcolando alcuni fattori di forza all'interno del corpo della cande
                    Cosmic Diviner X Planet
                    Olena Kondratenko
                    4 (2)
                    This unique multi-currency strategy simultaneously determines the strength of trends and market entry points, visualizing this using histograms on the chart. The indicator is optimally adapted for trading on the timeframes М5, М15, М30, Н1. For the convenience of users, the indicator renders the entry point (in the form of an arrow), recommended take profit levels (TP1, TP2 with text labels) and the recommended Stop Loss level. The take profit levels (TP1, TP2) are automatically calculated for
                    The Th3Eng PipFinite indicator is based on a very excellent analysis of the right trend direction with perfect custom algorithms. It show the true direction and the best point to start trading. With StopLoss point and Three Take Profit points. Also it show the right pivot of the price and small points to order to replace the dynamic support and resistance channel, Which surrounds the price. And Finally it draws a very helpful Box on the left side on the chart includes (take profits and Stop loss
                    DMS Fibo
                    Diogo Mitsunaga Dos Santos
                    Fibonacci retracements are trend lines drawn between two significant points, usually between absolute lows and absolute highs, plotted on a chart. Intersecting horizontal lines are placed at the Fibonacci levels. Fibonacci retracements are useful tools that help traders identify support and resistance levels. With the information gathered, they can place orders, identify stop-loss levels, and set price targets. Although useful, traders often use other indicators to make more accurate assessments
                    This indicator prepared by using 57 days moving averagr and least square method. It can only work for 1 hr time interval. Once a signal created. It is creating order and 2 limit orders. It works in CFD pairs as well as in Forex pairs. You can fins our other products from link : https://www.mql5.com/en/users/drbastem/seller Also, you can ask all your questins from email : haskayafx@gmail.com or mobile : +90 530 867 5076 or @MehmetBastem on telegram application This system is for Long term and pr
                    This is the FXTraderariel-TakeProfit - Stop Loss Indicator . It provides you 3 potential Take Profits and 1 Stop Loss. These potential targets are computed based on several methods . The indicator can be used on every time frame, but we advise to use it on H1, H4 and D1. Especially if you are a novice trader. Pro Traders can also you use it for scalping in smaller time frames (M1, M5 and M15). This indicator is not a complete trading system. It doesn't provide you a Signal nor can predict the m
                    Blahtech Market Profile
                    Blahtech Limited
                    4.61 (18)
                    Was: $249  Now: $99   Market Profile defines a number of day types that can help the trader to determine market behaviour. A key feature is the Value Area, representing the range of price action where 70% of trading took place. Understanding the Value Area can give traders valuable insight into market direction and establish the higher odds trade. It is an excellent addition to any system you may be using. Blahtech Limited presents their Market Profile indicator for the MetaTrader community. Ins
                    Fibonacci SR Indicator
                    Martin Eshleman
                    3 (2)
                    Fibonacci SR Indicator This indicator creates support and resistance lines. This indicator is based on Fibonacci Retracement and Extension levels. It will consider many combinations of the Fibonacci levels and draw support/resistance lines based on these. This indicator uses tops and bottoms drawn by the ZigZag indicator in its calculations. The ZigZag can also be drawn on the chart, if necessary. The indicator considers many combinations of past reversal points and Fibonacci ratio levels, and
                    FREE
                    FiboRec
                    Alfred Kamal
                    This indicator depends on Fibonacci lines but there is a secret lines i used them, by using FiboRec indicator you will be able to know a lot of important information in the market such as: Features You can avoid entry during market turbulence. You can enter orders in general trend only. You will know if the trend is strong or weak. Signal Types and Frame used You can use this indicator just on H1 frame. Enter buy order in case Candle break out the square area and closed over it, at least 20
                    Master Scalping M1 è un indicatore innovativo che utilizza un algoritmo per determinare il trend in modo rapido e preciso. L'indicatore calcola il tempo di apertura e chiusura delle posizioni, gli algoritmi dell'indicatore consentono di trovare i momenti ideali per entrare in un trade (acquistare o vendere un asset), il che aumenta il successo delle transazioni per la maggior parte dei trader. Vantaggi dell'indicatore: Facile da usare, non sovraccarica il grafico con informazioni inutili. Può es
                    We present you the indicator "Candle closing counter", which will become your indispensable assistant in the world of trading. That’s why knowing when the candle will close can help: If you like to trade using candle patterns, you will know when the candle will be closed. This indicator will allow you to check if a known pattern has formed and if there is a possibility of trading. The indicator will help you to prepare for market opening and market closure. You can set a timer to create a p
                    Fibonaccitools
                    Aymn Sʿyd Ahmd Hsn Alkwmy
                    Fibonacci retracements are popular tools that traders can use to draw support lines, identify resistance levels, place stop-loss orders, and set target prices. A Fibonacci retracement is created by taking two extreme points on a stock chart and dividing the vertical distance by the key Fibonacci ratios of 23.6%, 38.2%, 50%, 61.8%, and 100%. Fibonacci tools indicator will Draw Fibonacci Tools e.g. Retracement, Arc, Fan, Expansion, TimeZones. Based on zigzag indicator"
                    This is an intraday indicator that uses conventional formulae for daily and weekly levels of pivot, resistance and support, but updates them dynamically bar by bar. It answers the question how pivot levels would behave if every bar were considered as the last bar of a day. At every point in time, it takes N latest bars into consideration, where N is either the number of bars in a day (round the clock, i.e. in 24h) or the number of bars in a week - for daily and weekly levels correspondingly. So,
                    Gli utenti di questo prodotto hanno anche acquistato
                    Gann Made Easy
                    Oleg Rodin
                    4.88 (96)
                    Gann Made Easy è un sistema di trading Forex professionale e facile da usare che si basa sui migliori principi del trading utilizzando la teoria di mr. WD Gann. L'indicatore fornisce segnali ACQUISTA e VENDI accurati, inclusi i livelli di Stop Loss e Take Profit. Puoi fare trading anche in movimento utilizzando le notifiche PUSH. Vi prego di contattarmi dopo l'acquisto! Condividerò i miei consigli di trading con te e fantastici indicatori bonus gratuitamente! Probabilmente hai già sentito parlar
                    Trend Pulse
                    Mohamed Hassan
                    5 (4)
                    Please contact me after purchase to immediately get your PDF strategy + documentation for Trend Pulse !  Official release price of $89  ( 3 /50 copies left). Next price is $199 . Introducing Trend Pulse , a unique and robust indicator capable of detecting bullish, bearish, and even ranging trends! Trend Pulse uses a special algorithm to filter out market noise with real precision. If the current symbol is moving sideways, Trend Pulse will send you a ranging signal, letting you know that it
                    Scalper Inside PRO
                    Alexey Minkov
                    4.75 (60)
                    An exclusive indicator that utilizes an innovative algorithm to swiftly and accurately determine the market trend. The indicator automatically calculates opening, closing, and profit levels, providing detailed trading statistics. With these features, you can choose the most appropriate trading instrument for the current market conditions. Additionally, you can easily integrate your own arrow indicators into Scalper Inside Pro to quickly evaluate their statistics and profitability. Scalper Inside
                    Atomic Analyst
                    Issam Kassas
                    5 (3)
                    Innanzitutto, vale la pena sottolineare che questo indicatore di trading non è repaint, non è ridisegno e non presenta ritardi, il che lo rende ideale sia per il trading manuale che per quello automatico. Manuale utente: impostazioni, input e strategia. L'Analista Atomico è un indicatore di azione del prezzo PA che utilizza la forza e il momentum del prezzo per trovare un miglior vantaggio sul mercato. Dotato di filtri avanzati che aiutano a rimuovere rumori e segnali falsi, e aumentare il pote
                    ATTUALMENTE SCONTATO DEL 26% La soluzione migliore per ogni principiante o trader esperto! Questo indicatore è uno strumento di trading unico, di alta qualità e conveniente perché abbiamo incorporato una serie di caratteristiche proprietarie e una nuova formula. Con un solo grafico è possibile leggere la forza delle valute per 28 coppie Forex! Immaginate come migliorerà il vostro trading perché sarete in grado di individuare l'esatto punto di innesco di una nuova tendenza o di un'opportunit
                    FX Power MT4 NG
                    Daniel Stein
                    5 (12)
                    Ricevi il tuo aggiornamento quotidiano sul mercato con dettagli e schermate tramite il nostro Morning Briefing qui su mql5 e su Telegram ! FX Power MT4 NG è la nuova generazione del nostro popolare misuratore di forza delle valute, FX Power. Cosa offre questo misuratore di forza di nuova generazione? Tutto ciò che avete amato dell'FX Power originale IN PIÙ Analisi della forza di ORO/XAU Risultati di calcolo ancora più precisi Periodi di analisi configurabili individualmente Limite di calcolo pe
                    Currency Strength Wizard è un indicatore molto potente che ti fornisce una soluzione all-in-one per un trading di successo. L'indicatore calcola la potenza di questa o quella coppia forex utilizzando i dati di tutte le valute su più intervalli di tempo. Questi dati sono rappresentati in una forma di indice di valuta facile da usare e linee elettriche di valuta che puoi utilizzare per vedere il potere di questa o quella valuta. Tutto ciò di cui hai bisogno è collegare l'indicatore al grafico che
                    Advanced Currency IMPULSE with ALERT
                    Bernhard Schweigert
                    4.91 (495)
                    ATTUALMENTE SCONTATO DEL 31%! La soluzione migliore per ogni principiante o trader esperto! Questo indicatore è uno strumento di trading unico, di alta qualità e conveniente perché abbiamo incorporato una serie di caratteristiche proprietarie e una formula segreta. Con un solo grafico fornisce avvisi per tutte le 28 coppie di valute. Immaginate come migliorerà il vostro trading perché sarete in grado di individuare l'esatto punto di innesco di una nuova tendenza o opportunità di scalping!
                    Attualmente 20% di sconto! La soluzione migliore per ogni principiante o trader esperto! Questo software per cruscotti funziona su 28 coppie di valute. Si basa su 2 dei nostri indicatori principali (Advanced Currency Strength 28 e Advanced Currency Impulse). Offre un'ottima panoramica dell'intero mercato Forex. Mostra i valori di forza delle valute avanzate, la velocità di movimento delle valute e i segnali per 28 coppie Forex in tutti i (9) timeframe. Immaginate come migliorerà il vostro t
                    Scalper Vault
                    Oleg Rodin
                    5 (29)
                    Scalper Vault è un sistema di scalping professionale che ti fornisce tutto il necessario per scalping di successo. Questo indicatore è un sistema di trading completo che può essere utilizzato dai trader di forex e opzioni binarie. L'intervallo di tempo consigliato è M5. Il sistema fornisce segnali di freccia accurati nella direzione della tendenza. Ti fornisce anche i segnali più alti e più bassi e i livelli di mercato di Gann. Gli indicatori forniscono tutti i tipi di avvisi, comprese le notifi
                    Order Block Hunter
                    Noha Mohamed Fathy Younes Badr
                    5 (1)
                    Order block hunter indicator is the best indicator for  hunt the order blocks that area where there has been a large concentration of limit orders waiting to be executed Order blocks are identified on a chart by observing previous price action and looking for areas where the price experienced significant movement or sudden changes in direction .This indicator does that for you by using very complicated codes and helps you to take the best areas To buy and sell because it make marks at the best a
                    Enigmera
                    Ivan Stefanov
                    5 (4)
                    ENIGMERA: Il cuore del mercato https://www.enigmera.com Introduzione Questo indicatore e sistema di trading rappresenta un approccio straordinario ai mercati finanziari. ENIGMERA utilizza i cicli frattali per calcolare con precisione i livelli di supporto e resistenza. Mostra l'autentica fase di accumulazione e fornisce direzione e obiettivi.  Un sistema che funziona sia in un trend che in una correzione.  Come funziona? ENIGMERA è composto da tre linee: la linea di supporto/resistenza, la
                    Gold Channel is a volatility-based indicator, developed with a specific timing algorithm for the XAUUSD pair, which consists of finding possible corrections in the market. This indicator shows two outer lines, an inner line (retracement line) and an arrow sign, where the theory of the channel is to help identify overbought and oversold conditions in the market. The market price will generally fall between the boundaries of the channel. If prices touch or move outside the channel it is a tra
                    Scopri il segreto per il trading Forex di successo con il nostro indicatore MT4 personalizzato! Ti sei mai chiesto come raggiungere il successo nel mercato Forex, guadagnando costantemente profitti minimizzando il rischio? Ecco la risposta che hai cercato! Permettici di presentare il nostro indicatore MT4 proprietario che rivoluzionerà il tuo approccio al trading. Versatilità unica Il nostro indicatore è appositamente progettato per gli utenti che preferiscono le formazioni di candele Ren
                    Automated Trendlines
                    Georgios Kalomoiropoulos
                    5 (17)
                    Le linee di tendenza sono lo strumento più essenziale di analisi tecnica nel forex trading. Sfortunatamente, la maggior parte dei trader non li disegna correttamente. L'indicatore automatizzato delle linee di tendenza è uno strumento professionale per i trader seri che ti aiuta a visualizzare il movimento di tendenza dei mercati. Esistono due tipi di linee di tendenza, linee di tendenza rialziste e linee di tendenza ribassiste. Nella tendenza rialzista, la linea di tendenza Forex viene t
                    Advanced Supply Demand
                    Bernhard Schweigert
                    4.9 (314)
                    CURRENTLY 26% OFF !! Best Solution for any Newbie or Expert Trader! This indicator is a unique, high quality and affordable trading tool because we have incorporated a number of proprietary features and a new formula. With this update, you will be able to show double timeframe zones. You will not only be able to show a higher TF but to show both, the chart TF, PLUS the higher TF: SHOWING NESTED ZONES. All Supply Demand traders will love it. :) Important Information Revealed Maximize the potenti
                    SI PREGA DI LEGGERE LE INFORMAZIONI QUI SOTTO PRIMA DI ACQUISTARE IL PRODOTTO! Apollo Pips PLUS SP è un prodotto unico! È PER CHI VUOLE OTTENERE IL MIO NUOVO INDICATORE "APOLLO PIPS" PIÙ IL BONUS "SUPER PACK" CON ACCESSO A TUTTI I MIEI INDICATORI DI TRADING! Acquistando il prodotto Apollo Pips PLUS SP stai effettivamente acquistando una versione assolutamente nuova del mio indicatore Apollo Pips. Questa versione dell'indicatore ha un algoritmo migliorato e un parametro facile da usare che ti dà
                    PZ Day Trading
                    PZ TRADING SLU
                    3.67 (3)
                    Effortless trading: non-repainting indicator for accurate price reversals Special Offer: Purchase now to receive free bonuses worth $189! (Read more for details) This indicator detects price reversals in a zig-zag fashion, using only price action analysis and a donchian channel. It has been specifically designed for short-term trading, without repainting or backpainting at all. It is a fantastic tool for shrewd traders aiming to increase the timing of their operations. [ Installation Guide | Up
                    M1 Arrow
                    Oleg Rodin
                    4.73 (15)
                    Una strategia intraday basata su due principi fondamentali del mercato. L'algoritmo si basa sull'analisi dei volumi e delle onde di prezzo utilizzando filtri aggiuntivi. L'algoritmo intelligente dell'indicatore fornisce un segnale solo quando due fattori di mercato si combinano in uno solo. L'indicatore calcola le onde di un certo intervallo sul grafico M1 utilizzando i dati dell'intervallo di tempo più alto. E per confermare l'onda, l'indicatore utilizza l'analisi per volume. Questo indicatore
                    TPSpro RFI Levels
                    Roman Podpora
                    4.83 (24)
                    Reversal First Impulse levels (RFI)    INSTRUCTIONS        RUS       -       ENG              R ecommended to use with an indicator   -   TPSpro  TREND PRO -  Version MT5 A key element in trading is zones or levels from which decisions to buy or sell a trading instrument are made. Despite attempts by major players to conceal their presence in the market, they inevitably leave traces. Our task was to learn how to identify these traces and interpret them correctly. Main functions: Displaying activ
                    PZ Mean Reversion MT4
                    PZ TRADING SLU
                    2.33 (3)
                    Indicatore unico che implementa un approccio professionale e quantitativo al trading di reversione. Sfrutta il fatto che il prezzo devia e ritorna alla media in modo prevedibile e misurabile, il che consente regole di entrata e uscita chiare che superano di gran lunga le strategie di trading non quantitative. [ Installation Guide | Update Guide | Troubleshooting | FAQ | All Products ] Segnali di trading chiari Incredibilmente facile da scambiare Colori e dimensioni personalizzabili Implementa
                    GOLD Impulse with Alert
                    Bernhard Schweigert
                    4.56 (9)
                    Questo indicatore è una super combinazione dei nostri 2 prodotti Advanced Currency IMPULSE with ALERT  +   Currency Strength Exotics . Funziona per tutti i time frame e mostra graficamente l'impulso di forza o debolezza per le 8 valute principali più un simbolo! Questo indicatore è specializzato nel mostrare l'accelerazione della forza delle valute per qualsiasi simbolo come oro, coppie esotiche, materie prime, indici o futures. Primo nel suo genere, qualsiasi simbolo può essere aggiunto
                    PRO Renko System
                    Oleg Rodin
                    5 (25)
                    PRO Renko System è un sistema di trading altamente accurato appositamente progettato per il trading di grafici RENKO. Questo è un sistema universale che può essere applicato a vari strumenti di trading. Il sistema neutralizza efficacemente il cosiddetto rumore di mercato che consente di accedere a segnali di inversione accurati. L'indicatore è molto facile da usare e ha un solo parametro responsabile della generazione del segnale. Puoi facilmente adattare lo strumento a qualsiasi strumento
                    TakePropips Donchian Trend Pro
                    Eric John Pajarillaga Aldana
                    4.61 (18)
                    TakePropips Donchian Trend Pro   (MT4) è uno strumento potente ed efficace che rileva automaticamente la direzione del trend utilizzando il canale Donchian e ti fornisce segnali di trading di entrata e uscita! Questo indicatore multifunzione include uno scanner di tendenza, segnali di trading, pannello statistico, screener, sessioni di trading e dashboard della cronologia degli avvisi. È progettato per fornirti segnali di trading e farti risparmiare ore analizzando i grafici! È possibile scarica
                    Italo Trend Indicator
                    Italo Santana Gomes
                    4.79 (38)
                    BUY INDICATOR AND GET EA FOR FREE AS A BONUS + SOME OTHER GIFTS! ITALO TREND INDICATOR  is the best trend indicator on the market, the Indicator works on all time-frames and assets, indicator built after 7 years of experience on forex and many other markets. You know many trend indicators around the internet are not complete, does not help, and it's difficult to trade, but the Italo Trend Indicator is different , the Italo Trend Indicator shows the signal to buy or sell, to confirm the signal t
                    AVVISO DI ACQUISTO E VENDITA MULTIVALUTA e MULTITIMEFRAME. AUTO TAILING STOP E RISCHIO PREMIO TAKEPROFIT! L'INDICATORE SCANSIONA E ANALIZZA IL MERCATO COSÌ NON HAI NULLA DA FARE! SCAMBIA TUTTE LE TUE VALUTE SU 1 TABELLA!   Dopo l'acquisto lascia un commento contattami e ti invierò l'assistente commerciale EA. L'indicatore utilizza diversi oscillatori e filtri allegati per trovare i migliori punti di ingresso CONFERMATI, quindi non devi preoccuparti di questo! Ti avviserà e disegnerà un pu
                    ICT, SMC, SMART MONEY CONCEPTS, SMART MONEY, Smart Money Concept, Support and Resistance, Trend Analysis, Price Action, Market Structure, Order Blocks, BOS/CHoCH,   Breaker Blocks ,  Momentum Shift,   Supply&Demand Zone/Order Blocks , Strong Imbalance, HH/LL/HL/LH,    Fair Value Gap, FVG,  Premium  &   Discount   Zones, Fibonacci Retracement, OTE, Buy Side Liquidity, Sell Side Liquidity, BSL/SSL Taken, Equal Highs & Lows, MTF Dashboard, Multiple Time Frame, BigBar, HTF OB, HTF Market Structure, 
                    This product is based on the methodologies of Gann, his follower Don E. Hall. The Indicator builds a working view grid, which is used to analyze graphics. The Pyrapoint tool, developed by Don Hall, is a grid based on the Pythagorean cube. In his calculations he uses the Gann Square 9 methodology and the relationship between Price and Time. This tool is used to predict changes in trend and overall market actions. More information about the method   HERE
                    Best Currency Strength Indicator
                    Tumelo Patrick Rakotsoane
                    4.6 (48)
                    Advanced Currency Strength Indicator The Advanced Divergence Currency Strength Indicator. Not only it breaks down all 28 forex currency pairs and calculates the strength of individual currencies across all timeframes , but, You'll be analyzing the WHOLE forex market in 1 window (In just 1 minute) . This indicator is very powerful because it reveals the true movements of the market.  It is highly recommended to  analyze charts knowing the performance of individual currencies or the countries ec
                    TPSproTREND PrO
                    Roman Podpora
                    4.78 (18)
                    TPSpro TRENDPRO  - is a trend indicator that automatically analyzes the market and provides information about the trend and each of its changes, as well as giving signals for entering trades without redrawing! The indicator uses each candle, analyzing them separately. referring to different impulses - up or down impulse. Exact entry points into transactions for currencies, crypto, metals, stocks, indices!  Version MT5             DETAILED DESCRIPTION              R ecommended to use with an indi
                    Altri dall’autore
                    Bermaui Manual EA
                    Muhammad Elbermawi
                    5 (12)
                    Questo è un consulente esperto semiautomatico che scambia il sistema di rete. L'idea è quella di prendere gradualmente posizioni diverse nel mercato, quindi calcolare il livello di pareggio per loro. Quando i prezzi superano questo punto di pareggio di una distanza predeterminata, tutti gli ordini aperti vengono chiusi. Informazioni importanti Ecco la guida per l'utente:   https://www.mql5.com/en/blogs/post/730567 Puoi provare questo EA con uno qualsiasi dei miei altri prodotti, qui: https:/
                    MASR Bands
                    Muhammad Elbermawi
                    4.64 (11)
                    O bande M Oving A verage S upport R esistance. L'indicatore MASR Bands è una media mobile circondata da due bande che lavorano insieme come livelli di supporto e resistenza. Statisticamente, le bande MASR contengono candele di prezzo il 93% delle volte. Ecco come viene calcolato in passaggi: 1. Il primo passaggio consiste nel calcolare il massimo massimo (HHV) e il minimo minimo (LLV) per un periodo di tempo X. 2. Il secondo passaggio consiste nel dividere HHV per LLV per ottenere quanto
                    Bermaui Bands
                    Muhammad Elbermawi
                    4.94 (90)
                    Bermaui Bands (BB) è uno strumento di analisi tecnica che aiuta a filtrare tra i movimenti di prezzo di range e trend. L'idea alla base di questo indicatore può essere spiegata nei passaggi successivi: Calcola la deviazione standard come un oscillatore che si muove tra 0 e 100. Lo chiamerò Bermaui Deviation percent (BD %). Se "BD%" è vicino allo zero, la volatilità è al suo estremo. Inoltre, se "BD%" è vicino a 100, la volatilità è molto bassa. Alta volatilità significa una grande probabilità pe
                    True Direction Oscillator
                    Muhammad Elbermawi
                    4.89 (494)
                    Oppure (TDO) che è un indice che misura il tasso di variazione del prezzo utilizzando il principio del " Pure Momentum ". Quando il prezzo di un titolo avanza da 10 a 15, il tasso di variazione del prezzo è del 150%, ma quando scende da 15 a 10, il tasso di variazione del prezzo è solo del 33,3%. Ecco perché gli indicatori di analisi tecnica come "Price Rate of Change" (ROC) o "Momentum" forniscono letture più elevate per i movimenti di prezzo ascendente rispetto a quelli dati a quelli discende
                    Bermaui Deviation Percent
                    Muhammad Elbermawi
                    4.94 (130)
                    Oppure ( BD% ) che è un indice di volatilità che misura la volatilità in percentuale anziché in punti. L'idea di BD% è quella di creare un indice in base alla Classic Standard Deviation (CSD) che si sposta tra 0 e 100 percento. È possibile utilizzare BD% per confrontare la volatilità per lo stesso titolo in diversi periodi di tempo o periodi di tempo diversi. Inoltre, puoi utilizzare BD% per confrontare la volatilità tra diversi titoli in diversi mercati in termini di percentuale anziché di p
                    Bermaui Pin Bars
                    Muhammad Elbermawi
                    5 (22)
                    Bermaui Pin Bars Oppure (BPB) è un indicatore che trova il modello di azione dei prezzi delle barre dei pin sul grafico. Pin Bars è una scorciatoia per "Pinocchio Bars" che è un classico modello a barre alternativo ai candelabri giapponesi con alte ombre superiori o inferiori e corpi molto piccoli come Hammer, Inverted-Hammer, Hanging Man, Shooting Star, Dragon Fly Doji o Grave Stone Doji . L'indicatore Bermaui Pin Bars trova questo modello in base a una formula che può essere spiegata nei pa
                    Bermaui RSI Candles
                    Muhammad Elbermawi
                    5 (7)
                    L'idea di questo indicatore è disegnare l'RSI sotto forma di candele che possono essere confrontate con i grafici dei prezzi per generare segnali di acquisto e vendita. L'indicatore non è una mia invenzione. L'ho fondato su internet diversi anni fa. Ho aggiornato il codice, aggiunto funzioni di avviso, aggiunto il gruppo di strumenti Bermaui Utilities. L'indicatore calcola l'RSI di tutti i prezzi utilizzati per disegnare le candele (RSI di apertura, massimo, minimo e chiusura). Usa il più alto
                    BACD Cloud
                    Muhammad Elbermawi
                    4.57 (7)
                    Oppure B ermaui A verage C onvergence D ivergence Cloud , che è un oscillatore che mostra la direzione del trend e ne misura la forza in percentuale. Il calcolo del BACD Cloud è il seguente: 1- Calcola due medie mobili esponenziali. Uno di loro è più veloce dell'altro. Chiamerò il primo (Veloce) e il secondo (Lento) 2- Trova il centro tra di loro, dove: Center MA = (Fast + Slow) / 2 3- Calcola la linea BACD come segue: BACD = 100 * (Fast / Center MA) 4- Calcola la linea del segnale BACD
                    Or DBD%. The indicator consists of colored tape that shows trading signals depending on two Bermaui Deviation Oscillator (BD%) and two moving averages. Bermaui Deviation Percent is a volatility index that measures volatility in percent rather than points. The idea of BD% is to make an index depending on Classic Standard Deviation (CSD) that moves between 0 and 100 percent. Important Information DBD% expert advisor example:  https://www.mql5.com/en/blogs/post/731145 If you want to know mor
                    Bermaui Channel
                    Muhammad Elbermawi
                    5 (27)
                    This is a price channel that shows five important price levels on the chart. Those levels are: 1. The Highest High (HH) of the previous x bars. 2. The Highest Low (HL) of the previous x bars. 3. The Center Line. 4. The Lowest High (LH) of the previous x bars. 5. The Lowest Low (LL) of the previous x bars. How does Bermaui Channels Captures Overbought  area Think of the distance between HH and HL levels as an overbought area. When the price candles or bars crosses the HL to the upside this
                    Moving Average Cloud
                    Muhammad Elbermawi
                    4.93 (14)
                    O "MAC". Questo è un indicatore progettato per aiutarti a catturare e scambiare la tendenza. L'idea alla base di questo indicatore può essere spiegata nei passaggi successivi: Disegna una busta media in rapido movimento. Disegna una busta media lenta. Il MAC Upper Band è il valore più alto tra il massimo di entrambi gli inviluppi. La banda inferiore del MAC è il valore più basso tra i minimi di entrambi gli inviluppi. MAC Histogram Cloud riempie la distanza tra due bande per mostrare il cambi
                    Horus EA
                    Muhammad Elbermawi
                    3.67 (3)
                    Horus EA per MT4 Migliaia di anni fa, gli antichi egizi inventarono un sistema di conteggio che usavano per misurare le loro terre e pesare le loro merci. Questo sistema era noto come " Occhio di Horus ". L'occhio di Horus era associato al mito del dio Osiride e divenne uno dei simboli sacri dei faraoni. Ho usato le equazioni matematiche nell'Occhio di Horus con la sequenza di Fibonacci per costruire un sistema di gestione del denaro a progressione negativa che è dell'89% più sicuro del famos
                    Filtro:
                    udayan datta
                    691
                    udayan datta 2024.01.27 11:51 
                     

                    Indicator looks perfectly good and working fine, looking forward to learn it

                    leroy
                    305
                    leroy 2023.06.03 01:25 
                     

                    I started reading about the Keltner Channel and was surprised to see a simple yet effective indicator being sold/rented for a good price. I recently just rented the indicator and plan to test it out with my personal strategy. Thanks for creating this indicator!

                    elite luis
                    3331
                    elite luis 2023.03.06 14:06 
                     

                    Author very responsive and fully provide video tutorial on how to use, add as another layer of confluence nice! Thanks!

                    davevicens
                    321
                    davevicens 2022.12.22 16:03 
                     

                    Very good indicator. , i use it together with bermaui bands . It´s amazing!!!!

                    Thin Vu Xuan
                    270
                    Thin Vu Xuan 2022.12.07 03:06 
                     

                    Good

                    prim forex
                    91
                    prim forex 2022.11.03 02:43 
                     

                    To be honest, I like the indicaor best now. It was no too difficult until start Mekong pips. Highly recommended.

                    Muhammad Elbermawi
                    52385
                    Risposta dello sviluppatore Muhammad Elbermawi 2022.11.03 05:04
                    Thanks, Hiro Koyama
                    mrkaib
                    1074
                    mrkaib 2022.10.13 19:33 
                     

                    very good indicator

                    luis066
                    29
                    luis066 2022.09.03 20:38 
                     

                    this is a great product, i use it together with bermaui bands and i always have the correct view of the market. low price and a lot of quality.

                    awasthisp
                    774
                    awasthisp 2022.08.23 13:27 
                     

                    No doubt about his software's result and grade . Previous to this i have already purchased and rented his maximum software nothing doubt about any thing.

                    rodbizness
                    84
                    rodbizness 2022.06.11 01:20 
                     

                    Muhammad, thank you so much for the Big Job.

                    deimy
                    563
                    deimy 2022.04.15 00:55 
                     

                    Very good indicator, thank you

                    Doctornoob
                    329
                    Doctornoob 2022.03.25 22:44 
                     

                    good addition to my trading

                    yellowplus2009
                    252
                    yellowplus2009 2022.03.19 10:22 
                     

                    Great product.Highly recommended indicator.

                    moayad alhadidid
                    33
                    moayad alhadidid 2022.02.16 13:33 
                     

                    I bought the product for a month to try it, and the CKC oscillator did not appear

                    Muhammad Elbermawi
                    52385
                    Risposta dello sviluppatore Muhammad Elbermawi 2022.03.18 17:45
                    If there is any problem then why didn't you contact me?!
                    OLADIMEJI ADEBAJO IWALESIN
                    3931
                    OLADIMEJI ADEBAJO IWALESIN 2022.01.27 06:52 
                     

                    Great indicator from Muhammad as always. 5***** buy and sell entry points.

                    ck15220
                    714
                    ck15220 2021.10.18 15:39 
                     

                    Very good indicators make me make a lot of profits. Thank you

                    Muhammad Elbermawi
                    52385
                    Risposta dello sviluppatore Muhammad Elbermawi 2021.10.18 18:07
                    Thanks, my friend. I appreciate it. 🙏💚
                    adonis4ex
                    6308
                    adonis4ex 2021.10.01 03:26 
                     

                    L'utente non ha lasciato alcun commento sulla valutazione.

                    Muhammad Elbermawi
                    52385
                    Risposta dello sviluppatore Muhammad Elbermawi 2021.10.02 08:38
                    Thanks, Adonis. I appreciate it. 🙏💚
                    Johnny Long
                    99
                    Johnny Long 2021.09.27 14:54 
                     

                    the product and the author is great!

                    Muhammad Elbermawi
                    52385
                    Risposta dello sviluppatore Muhammad Elbermawi 2021.10.01 09:10
                    Thanks 🙏💚
                    James Wioos
                    412
                    James Wioos 2021.08.16 18:07 
                     

                    A fantastic indicator by the Author, best indicator for new traders and experienced trader. Definelty recommand any product by Muhammad, this is my second product by this author and I am very happy with the performance of the indicator.

                    Muhammad Elbermawi
                    52385
                    Risposta dello sviluppatore Muhammad Elbermawi 2021.08.16 22:23
                    🙏 Thanks a lot for your trust, James. ✅ I hope that you enjoy all the trading examples on the telegram channel:
                    https://t.me/BermauiChannel
                    ambho
                    90
                    ambho 2021.07.05 20:32 
                     

                    Good service and indicator

                    Muhammad Elbermawi
                    52385
                    Risposta dello sviluppatore Muhammad Elbermawi 2021.08.06 21:48
                    Thanks for the great review and stars 🙏💚
                    You can join my telegram group from here:
                    https://t.me/BermauiChannel
                    123
                    Rispondi alla recensione
                    Versione 2.2 2020.03.08
                    Added a buffer for Signals to make it easy for developers to use the indicator in building expert advisors.

                    The new buffer is no. 2. It is called "BuySell". It works Like this:
                    1) If BuySell = +1 then buy
                    2) If BuySell = -1 then Sell
                    Versione 2.1 2020.03.02
                    Added an icon to the description.
                    Versione 2.0 2020.02.26
                    1. Enhanced the calculation method.
                    2. Added color lists, for a better chart view.
                    3. Enhanced all the alerts.
                    4. Arranged the inputs to be more user friendly.
                    5. Added buffers to indicator description.
                    .
                    Note:

                    I didn't make any changes on CKC basic formula. It is still the same.
                    I didn't make any changes in the indicator buffers.