TSO Currency Trend Aggregator
- Indicatori
- Dionisis Nikolopoulos
- Versione: 1.0
- Attivazioni: 10
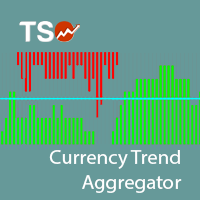
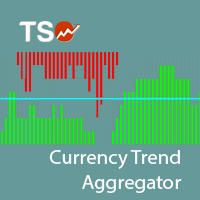
The TSO Currency Trend Aggregator is an indicator that compares a selected currency's performance in 7 different pairs.
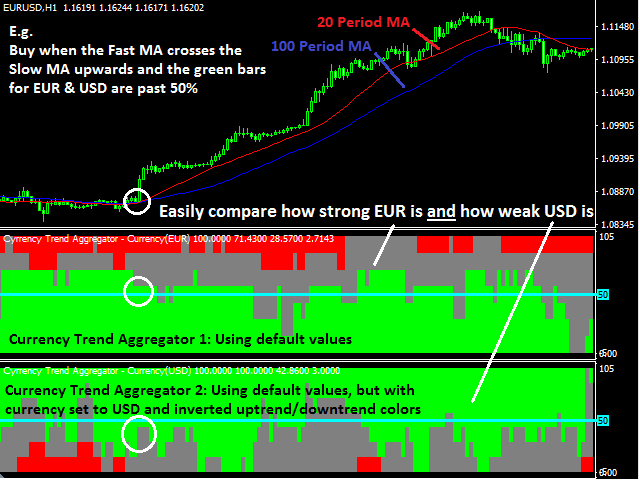
- Instantly compare how a currency is performing in 7 different pairs.
- Easily get confirmation of a currency's strength
- Combine the indicator for both currencies of a pair to get the total view of how strong/weak each currency is.
- The trend is classified as positive (green), negative (red) or neutral (grey).
- Can easily be used in an EA (see below)
Currencies
- EUR
- USD
- GBP
- JPY
- AUD
- NZD
- CAD
- CHF
Definitions
- Positive Trend (green): When the fast MA is above the slow MA and below the current price.
- Negative Trend (red): When the fast MA is below the slow MA and above the current price.
- Neutral (grey): Any other case.
This indicator reads prices from 7 different Forex pairs at a time. Ensure that the price history for all pairs has been downloaded before testing it in the strategy tester. The indicator will show trend signals only for the time periods for which data for all required pairs are available. It will be blank during the time periods for which no data are available.
Inputs
- Symbol: The currency to be compared.
- Prefix: If the currency pairs provided by your broker have a prefix before the name of the pair input it here.
- Suffix: If the currency pairs provided by your broker have a prefix before the name of the pair input it here (e.g. for EURUSD.m input .m)
- Timeframe: The timeframe on which the moving averages are applied.
- Fast MA Period: The period of the fast moving average.
- Fast MA Method: The type of the fast moving average
- Fast MA Applied Price: The candle price on which the fast moving average is based
- Slow MA Period: The period of the slow moving average.
- Slow MA Method: The type of the slow moving average
- Slow MA Applied Price The candle price on which the fast moving average is based
For EA Developers
- Buffer 3: Returns a double with two decimals.
- The number on the left of the decimal point shows the dominant trend and takes values:
- 0 = Uptrend
- 1 = Downtrend
- 2 = No trend
- The number on the right of the decimal point shows the percentage of pairs that are in the dominant direction rounded to 2 digits.
- For example, if the dominant trend is downtrend (1) and there is a downtrend in 3 out of 7 pairs (3/7*100 ≈ 43), the return value is 1.43
