Gann Grid
- Indicatori
- Iurii Tokman
- Versione: 2.0
- Aggiornato: 23 novembre 2017
- Attivazioni: 5
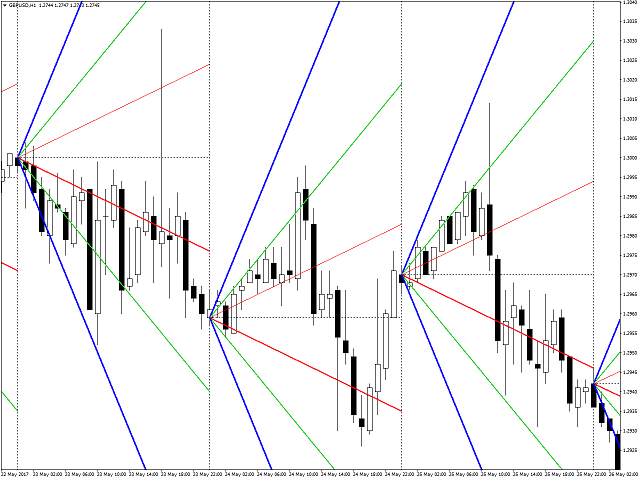
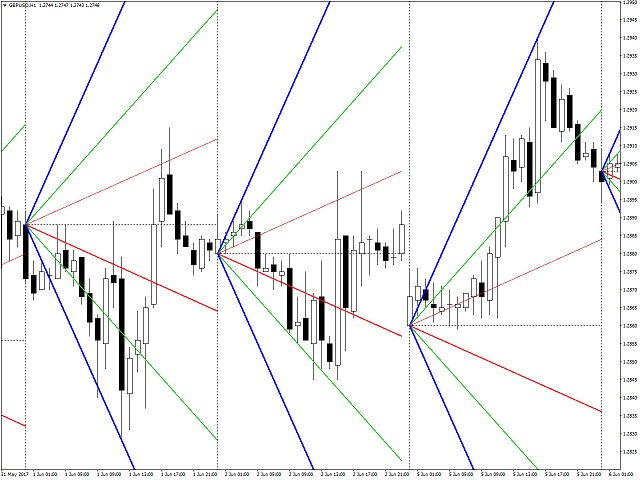
The indicator displays Gann lines for one day. It works only on the timeframes smaller than daily.
Description of the indicator settings:
- Count_Bars - the number of daily bars to display the Gann lines. If set to 0, they are displayed for all the available history bars.
- scaleGann1 - scale for line #1 (number of points per bar)
- clrGann1 - color of line #1
- styleGann1 - style of line #1
- widthGann1 - width of line #1
- scaleGann2 - scale for line #2
- clrGann1 - color of line #2
- styleGann2 - style of line #2
- widthGann2 - width of line #2
- scaleGann3 - scale for line #3
- clrGann3 - color of line #3
- styleGann3 - style of line #3
- widthGann3 - width of line #3
- scaleGann4 - scale for line #4
- clrGann4 - color of line #4
- styleGann4 - style of line #4
- widthGann4 - width of line #4
- scaleGann5 - scale for line #5
- clrGann5 - color of line #5
- styleGann5 - style of line #5
- widthGann5 - width of line #5
- scaleGann6 - scale for line #6
- clrGann6 - color of line #6
- styleGann6 - style of line #6
- widthGann6 - width of line #6
- scaleGann7 - scale for line #7
- clrGann7 - color of line #7
- styleGann7 - style of line #7
- widthGann7 - width of line #7
- GMT_Shift - set the offset in time, in hours










L'utente non ha lasciato alcun commento sulla valutazione.