Murray Math Levels several oktavs for MT5
- Indicatori
- Vladyslav Goshkov
- Versione: 1.1
- Aggiornato: 3 febbraio 2022
- Attivazioni: 5
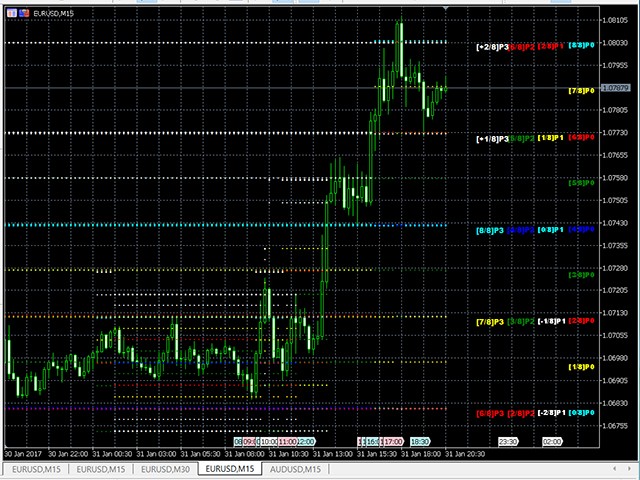
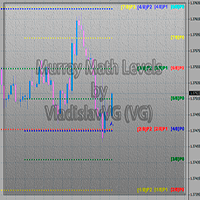
This indicator calculates and displays Murrey Math Lines on the chart.
This MT5 version is similar to the МТ4 version:
It allows you to plot up to 4 octaves, inclusive, using data from different time frames, which enables you to assess the correlation between trends and investment horizons of different lengths. In contrast to the МТ4 version, this one automatically selects an algorithm to search for the base for range calculation.
You can get the values of the levels by using the iCustom() function;
Each octave has 13 levels. 4 octaves have 52 indicator buffers in total.
- Buffer 0 corresponds to the value of the +2/8 level of the octave with index P0
- ...
- Buffer 12 corresponds to the value of the -2/8 level of the octave with index P0
- ...
- Buffer 13 corresponds to the value of the +2/8 level of the octave with index P1
- ...
- Buffer 25 corresponds to the value of the -2/8 level of the octave with index P1
- ...
- and so on...
- Buffer 52 corresponds to the value of the -2/8 level of the octave with index P3
It produces the results on historical data. A publicly available free version with modifications introduced by different authors, draws the results on history as calculated on the current bar, which prevents it from being used for accurate analysis of the price movement in the past and complicates determination of the possible direction of the price at the current price range.
There are versions that show values based on history but I don't know how accurate they are.
To simplify the operation of the indicator, the number of bars of history is limited - the BarsCNT parameter, default is 150 bars.
You can study the historic behavior of the indicator in the manual mode by using the StepBack parameter, which allows to plot the required number of indicator values starting with the specified bar.
Attention! This version of the indicator features an improved selection of ranges for plotting octaves.
By default, the indicator is configured for intraday trading with lines drawn over the hourly range, which allows you to properly use it for all intrahour ranges. If it is necessary to use the indicator on higher time frames, the current chart time frame will be selected automatically. Alternatively, you can manually set the desired time frame for drawing octaves, being higher than the current chart time frame.</s2>
Please modify the default parameters only if you know exactly what you are doing. The default parameters should be optimal for most trading strategies.
















Excellent product. I am happy with the performance, though I only use it to locate extreme levels. It does an excellent job at that!