Price Pressure
- Indicatori
- Filipe Acerbi
- Versione: 3.0
- Aggiornato: 26 aprile 2022
- Attivazioni: 10
Price Pressure indicator is capable to determine the total result of buy/sell pressure. The result is given in Average True Range (ATR) percent. Price Pressure analyze price action determining how much pressure is present for each candle. Buying or Selling pressure is cumulative, and the more bear/bull bodies and the larger the bodies, the more likely it is that the pressure will reach a critical point and overwhelm the bulls/bears and drive the market down/up. Strong bulls create buying pressure and strong bears create selling pressure. Strong bulls and bears are institutional traders, and the cumulative effect of these strong traders determines the direction of the market.
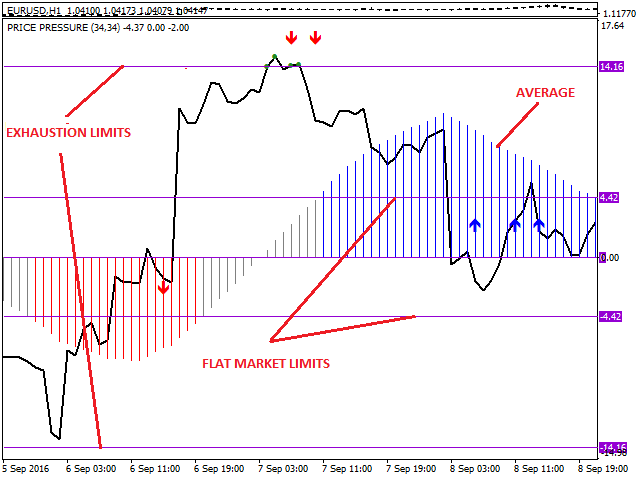
Flat Market Limits
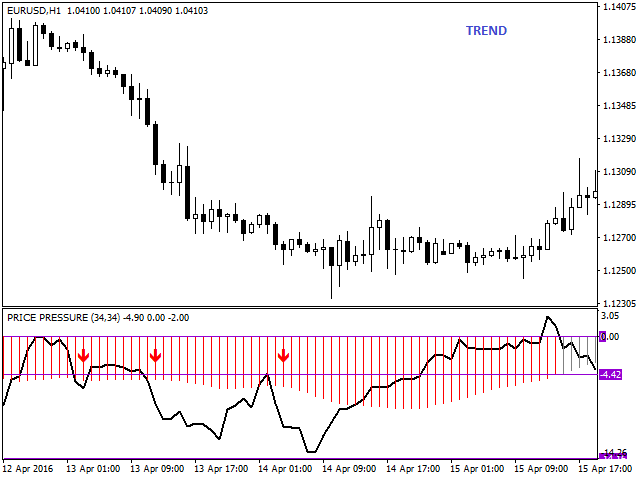
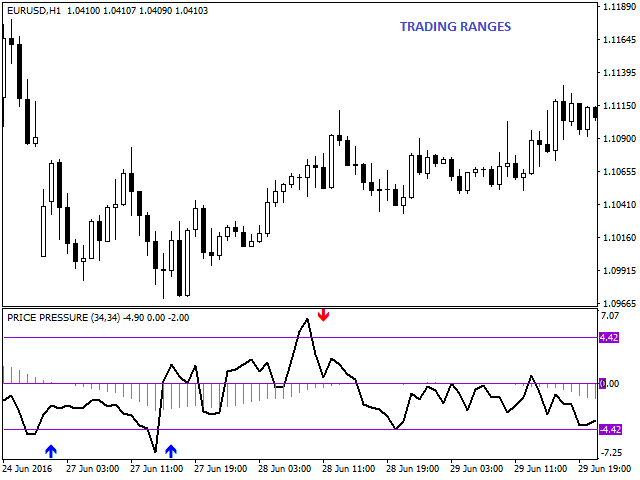
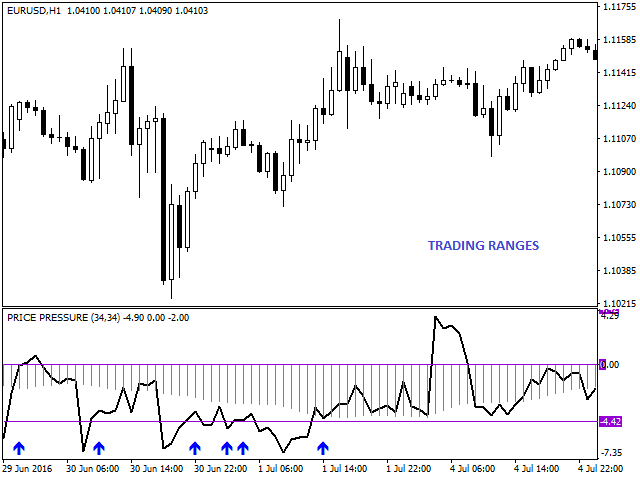
When Both the bulls and the bears are comfortable to take positions a ranging market is developing. When average price pressure stay in equilibrium, it´s mean that no bulls or bears are controlling the market. Price pressure indicator, has limits to identify when the market is flat. When the price pressure average is inside these limits, it´s recommend fade breakouts. When the pressure average is outside of these limits, the market is trending, and it´s recommend trading in trend direction.
Exhaustion Limits
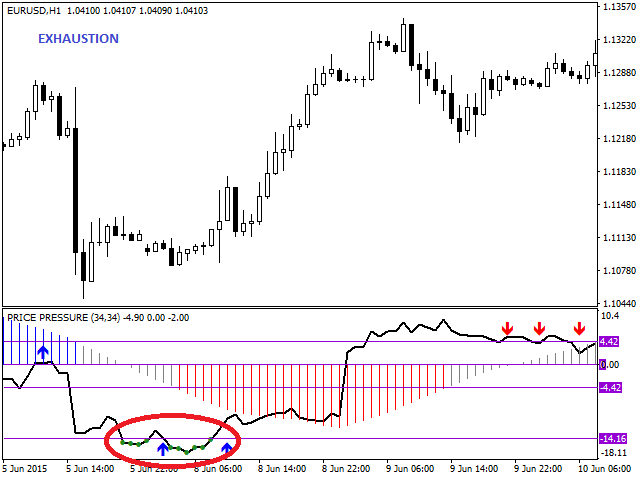
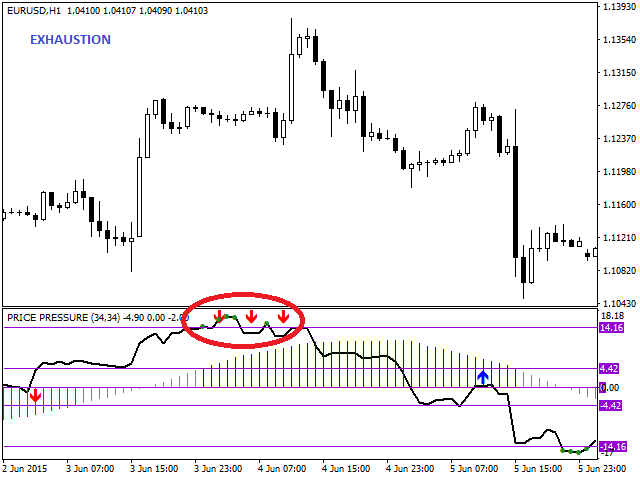
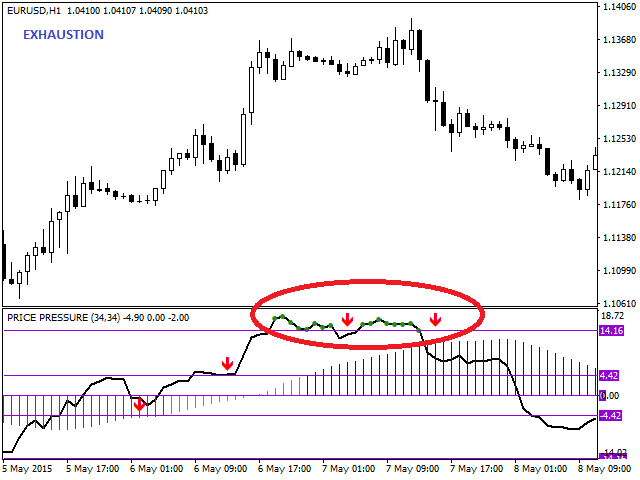
Market Exhaustion is an unsustainable behaviour that should be considered to be a type of climax, whether or not a reversal follows. The market trend strong and fast up or down, signalizing a climax and the market could reverse at any moment.
When price pressure indicates that the market is in exhaustion mode, the trader can expect a pullback or even a reversal.
Median Absolute Deviation (MAD)
Price Pressure has built-in a algorithm for automatic calculation of Flat Market and Exhaustion limits. The algorithm is based on median absolute deviation, one of the commonest ways of finding outliers in one-dimensional data.
WARNING: Turn off the automatic calculation for limits when you run the tester. The tester initialize with only 1000 bars loaded which is a small sample. I recommend at least 10000 bars or more. Using only 1000 bars to calculate the limits, will result a calculation that don´t reflect correctly the market environment.
Key features
- Display Flat and Exhaustion Limits.
- Show Entry Signals.
- Adaptive Oscillator which works in trend and ranging markets.
- Works on every symbol and timeframe.
- Use statistic approach to determine flat and exhaustion limits.
Settings
- Period - Number of bars to analyze.
- Average Period - Number of bars to average.
- Show Signals- Show/hide entry signals.
- Flat and Exhaustion Limits Automatic Calculation - Turn on/off Flat and Exhaustion Limits Automatic Calculation.
- Flat Market Limit - Set manual limits for Flat market. (Used when Automatic Calculation of limits is off)
- Exhaustion Market Limit - Set manual limits for Exhaustion. (Used when Automatic Calculation of limits is off)
For EA developers
Available buffers:
- Buffer 0 - Price Pressure value.
- Buffer 1 - Buy entry signal.
- Buffer 2 - Sell entry signal.
- Buffer 3 - Positive Average Price Pressure value.
- Buffer 4 - Neutral Average Price Pressure value.
- Buffer 5 - Negative Average Price Pressure value.
- Buffer 6 - Exhaustion Price Pressure value.

