• Panoramica
  • Recensioni (2)
  • Commenti (3)
  • Novità

MTF RSI for MT5

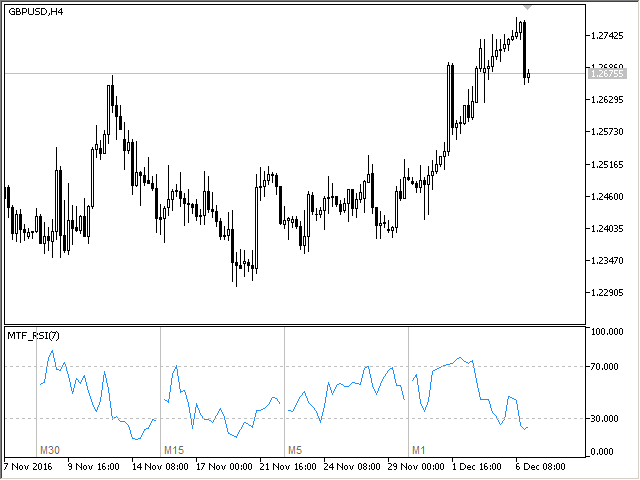
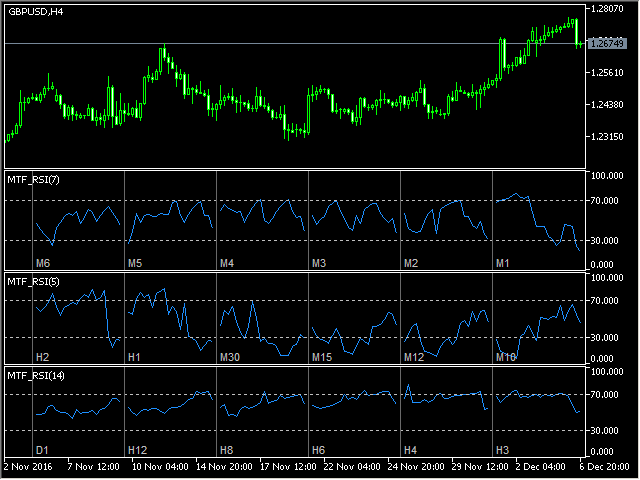
Multi-timeframe indicator Relative Strength Index displays information simultaneously from different periods in one subwindow of the chart.


Parameters

  • Period of averaging — averaging period for the RSI calculation.
  • Type of price — price used.
  • Timeframes for RSI — list of periods, separated by a space or comma or semicolon.
  • Number of bars for each period — the number of bars displayed for each period.
  • Sort periods — sort periods if they are listed in no particular order.
  • Current period first — display the current period first.
Prodotti consigliati
L'indicateur SMC Venom Model BPR est un outil professionnel pour les traders travaillant dans le concept Smart Money (SMC). Il identifie automatiquement deux modèles clés sur le graphique des prix: FVG   (Fair Value Gap) est une combinaison de trois bougies, dans laquelle il y a un écart entre la première et la troisième bougie. Forme une zone entre les niveaux où il n'y a pas de support de volume, ce qui conduit souvent à une correction des prix. BPR   (Balanced Price Range) est une combinaiso
Noize Absorption Index - is the manual trading system that measures the difference of pressure between bears forces and bulls forces. Green line - is a noize free index that showing curent situation. Zero value of index shows totally choppy/flat market.Values above zero level shows how powerfull bullish wave is and values below zero measures bearish forces.Up arrow appears on bearish market when it's ready to reverse, dn arrow appears on weak bullish market, as a result of reverse expectation.
HMA Trend Professional MT5
Pavel Zamoshnikov
4.25 (4)
Improved version of the free HMA Trend indicator (for MetaTrader 4) with statistical analysis. HMA Trend is a trend indicator based on the Hull Moving Average (HMA) with two periods. HMA with a slow period identifies the trend, while HMA with a fast period determines the short-term movements and signals in the trend direction. The main differences from the free version: Ability to predict the probability of a trend reversal using analysis of history data. Plotting statistical charts for analyzi
Il nostro indicatore   Basic Support and Resistance   è la soluzione necessaria per aumentare l'analisi tecnica.Questo indicatore consente di proiettare i livelli di supporto e resistenza sul grafico/ MT4 gratuita Funzionalità Integrazione dei livelli di Fibonacci: Con la possibilità di visualizzare i livelli di Fibonacci insieme a livelli di supporto e resistenza, il nostro indicatore ti dà una visione ancora più profonda del comportamento del mercato e delle possibili aree di inversione. Ot
To download MT4 version please click here . This is the exact conversion from TradingView: "WaveTrend [LazyBear]" By "zeusuk3". One of the coolest indicators out there to detect overbought and oversold zones. It can be used as a part of more complicated strategy and for confirming a potential trade setup. There are buffers to use in EAs also. The indicator is loaded light and non-repaint. - You can message in private chat for further changes you need. Thanks for downloading 
Buy CTS scalping indicator, provide buying and selling signals, automatic channeling and sending signals to mobile phones Using technical analysis and price action methods and modern methods, CTS indicator can draw price channels and recognize price trends with high accuracy and issue entry and exit signals according to them. Traders can easily fluctuate using this indicator in different time frames and in different markets. With the CTS indicator, you can signal in different ways. This indicato
MACDivergence MTF MT5
Pavel Zamoshnikov
4 (5)
Advanced ideas of the popular MACD indicator: It detects and displays classic and reverse divergences (two methods of detecting divergences). It uses different color to highlight an uptrend and a downtrend. Two methods of determining a trend: а) MACD crosses the 0 level (classic signal); б) MACD crosses its own average (early signal). This is a multi-timeframe indicator: it can display MACD data from other timeframes. Two methods of drawing: classic histogram and line. It generates sound and vis
Volality Index Scalper
Lesedi Oliver Seilane
5 (1)
Volality Index scalper indicator  Meant for Volality pairs such as Volality 10, 25, 50, 75 and 100 The indicator works on all timeframes from the 1 minute to the monthly timeframe the indicator is non repaint the indicator has 3 entry settings 1 color change on zero cross 2 color change on slope change 3 color change on signal line cross Orange line is your sell signal Blue line is your buy signal.
The new update makes this indicator a complete tool for studying, analyzing and operating probabilistic patterns. It includes: On-chart Multi-asset percentage monitor. Configurable martingales. Twenty-one pre-configured patterns, including Mhi patterns and C3. An advanced pattern editor to store up to 5 custom patterns. Backtest mode to test results with loss reports. Trend filter. Hit operational filter. Martingale Cycles option. Various types of strategies and alerts. Confluence between patter
Cet indicateur innovant de mesure de la force des devises de INFINITY est une aide indispensable pour les scalpers et les commerçants qui négocient à long terme. Le système d'analyse De la force/faiblesse des devises est connu depuis longtemps et utilisé sur le marché par les principaux traders du monde. Tout commerce d'arbitrage n'est pas complet sans cette analyse. Notre indicateur détermine facilement la force des devises sous-jacentes les unes par rapport aux autres. Il affiche des graphiqu
The Antique Trend Indicator is a revolutionary trend trading and filtering solution with all the important features of a trend tool built into one tool! The Antique Trend indicator is good for any trader, suitable for any trader both for Forex and binary options. There is no need to configure anything, everything has been perfected by time and experience, it works great during flats and trends. The Antique Trend indicator is a tool for technical analysis of financial markets, reflecting curren
PZ Mean Reversion MT5
PZ TRADING SLU
3 (2)
Indicatore unico che implementa un approccio professionale e quantitativo al trading di reversione. Sfrutta il fatto che il prezzo devia e ritorna alla media in modo prevedibile e misurabile, il che consente regole di entrata e uscita chiare che superano di gran lunga le strategie di trading non quantitative. [ Installation Guide | Update Guide | Troubleshooting | FAQ | All Products ] Segnali di trading chiari Incredibilmente facile da scambiare Colori e dimensioni personalizzabili Implementa l
L'indicatore DYJ BoS identifica e contrassegna automaticamente gli elementi essenziali dei cambiamenti nella struttura del mercato, tra cui: Breakout of Structure (BoS): rilevato quando il prezzo effettua una mossa significativa, rompendo un precedente punto di struttura. Segna possibili linee di tendenza al rialzo e al ribasso (UP e DN, ovvero nuovi massimi e nuovi minimi continui) e una volta che il prezzo sfonda queste linee, segna frecce rosse (ORSO) e verdi (TORO) Il BoS si verifica sol
Crash 1000 Scalping Indicator for the Crash 1000 Deriv Synthetic Index. Introduction The Crash 1000 Scalping Indicator is a specialized tool designed for the Crash 1000 index on the Deriv Synthetic market. This indicator is particularly useful for scalping on the M1 timeframe, helping traders to identify precise entry and exit points for buy positions. It is designed to be non-repainting, providing clear signals with audible alerts and push notifications, and is compatible with mobile devices th
How to use Pair Trading Station Pair Trading Station is recommended for H1 time frame and you can use it for any currency pairs. To generate buy and sell signal, follow few steps below to apply Pair Trading Station to your MetaTrader terminal. When you load Pair Trading Station on your chart, Pair Trading station will assess available historical data in your MetaTrader platforms for each currency pair. On your chart, the amount of historical data available will be displayed for each currency pai
B Xtrender
Yashar Seyyedin
To download MT4 version please click here . This is the exact conversion from TradingView: "B-Xtrender" By "QuantTherapy". - It is an oscillator based on RSI and multiple layers of moving averages. -   It is a two in one indicator to calculate overbought and oversold zones for different RSI settings. -  This indicator lets you read the buffers for all data on the window. - This is a non-repaint and light processing load indicator. - You can message in private chat for further changes you need.
Wavetrend for MT5
Antonello Belgrano
Here is a version for MetaTrader 5 of the famous Wave Trend indicator. Introducing the Wave Trend Oscillator Indicator for MT5 We are excited to present our Wave Trend Oscillator Indicator, exclusively designed for MetaTrader 5. This advanced tool is a must-have for traders who seek precision and efficiency in their trading journey. Our oscillator is built on the principles of wave trend analysis, capturing the ebb and flow of market trends with unparalleled accuracy. It helps traders identify p
To get access to MT4 version please click here . - This is the exact conversion from TradingView: "Stochastic Momentum Index" By "UCSgears". - This is a popular version of stochastic oscillator on tradingview. - This is a light-load processing and non-repaint indicator. - Buffers are available for the lines on chart. - You can message in private chat for further changes you need. Thanks for downloading
Технический индикатор Universal Oscillator является комбинацией торговых сигналов самых популярных и широко используемых осцилляторов. Индикатор представлен гистограммами, а также линиями fast и slow MA, что позволяет расширить список получаемых торговых рекомендаций и работать как по тренду, так и в боковом движении рынка. Таким образом, гистограммы позволяют определить момент пробоя ценовых значений и движение в новой фазе рынка, а линии указывают на зоны перекупленности и перепроданности.  Ос
US30NinjaMT5
Satyaseelan Shankarananda Moodley
US30 Ninja is a 5 minute scalping indicator that will let know you when there is a trade set up (buy or sell). Once the indicator gives the trade direction, you can open a trade and use a 30 pip stop loss and a 30 pip to 50 pip take profit. Please trade at own own risk. This indicator has been created solely for the US30 market and may not yield positive results on any other pair. 
The Riko Trend indicator is a revolutionary trend trading and filtering solution with all the important features of a trend tool built into one tool! The Riko Trend indicator is good for any trader, suitable for any trader for both forex and binary options. You don’t need to configure anything, everything is perfected by time and experience, it works great during a flat and in a trend. The Riko Trend indicator is a technical analysis tool for financial markets that reflects the current price f
DYJ Super Trend Wave è un sistema di trading di picchi e valli altamente accurato. Questo indicatore cerca i punti più alti e più bassi del filo di candela quando entra e esce dal mercato. Il prezzo di ingresso è vicino al punto più alto o più basso. Il tipo di notifica del segnale è stato aggiunto al dyj supertrend. Quando viene generato un segnale multi-spazio, È possibile utilizzare i seguenti tipi di segnali di notifica: Alert mailSend, MobilePush. Input InpSignalPeriod = 10 BarDistance = 2
Bear Bull
Ignacio Agustin Mene Franco
Bear Bull! It is an indicator that marks with Heikin Ashi candles but modified, the sales and purchases long and short trend! with 2 colors green marks the purchase, purple marks the sale, works for any type of temporality, works for forex markets and synthetic indices! ideal for any pair, it also works for crypto pairs, Good profit! World Investor - World Inversor - 
Was: $249  Now: $149   Market Profile defines a number of day types that can help the trader to determine market behaviour. A key feature is the Value Area, representing the range of price action where 70% of trading took place. Understanding the Value Area can give traders valuable insight into market direction and establish the higher odds trade. It is an excellent addition to any system you may be using. Inspired by Jim Dalton’s book “Mind Over Markets”, this indicator is designed to suit the
- This is the exact conversion from TradingView: "Support/Resistance" By "BarsStallone". - This indicator lets you read the buffers for R/S values. - This is a non-repaint and light processing load indicator. - This is not a multi time frame indicator If you want the multi time frame version you should create a personal order and I deliver two files that you need them both to have the multi time frame indicator running on your system. - The MT4 version of the indicator is not light load from pr
The Penta-O is a 6-point retracement harmonacci pattern which usually precedes big market movements. Penta-O patterns can expand and repaint quite a bit. To make things easier this indicator implements a twist: it waits for a donchian breakout in the right direction before signaling the trade. The end result is an otherwise repainting indicator with a very reliable trading signal. The donchian breakout period is entered as an input. [ Installation Guide | Update Guide | Troubleshooting | FAQ | A
Paula Bollinger Bands Strategy
Francisco Gomes Da Silva
4 (2)
Bollinger bands out/in strategy A strategy created by Joe Ross, and very useful for finding trades when the market is overloaded. Indicator You don't need to find where there are entries on the chart, this indicator shows them for you. The entrance The trade is confirmed when the price closes outside the bollinger bands on a candle and the candle after the price closes inside the bands. comment I want to improve this indicator, so you can help me sending me your reviews and comments, thanks :).
FREE
Provided Trend is a complex signal formation indicator. As a result of the work of internal algorithms, you can see only three types of signals on your chart. The first is a buy signal, the second is a sell signal, and the third is a market exit signal. Options: CalcFlatSlow - The first parameter that controls the main function of splitting the price chart into waves. CalcFlatFast - The second parameter that controls the main function of splitting the price chart into waves. CalcFlatAvg - Para
Supply demand zoning
Oluwatosin Isaac Omotayo
After forming a New Structure High the market will retrace creating a higher low. When this movement occurs, that NSH's now become an area of structure called  resistance . As price action pushes up from the newly created higher lows, that resistance level becomes the last stand for sellers to stop the buyers from rallying.    IF the resistance level cannot be penetrated, THEN it's likely that we'll see either a period of consolidation or a reversal in trend. IF price action breaks through t
Identify precise entry and exit points with AB=CD patterns This indicator finds AB=CD retracement patterns. The AB=CD Retracement pattern is a 4-point price structure where the initial price segment is partially retraced and followed by an equidistant move from the completion of the pullback, and is the basic foundation for all harmonic patterns. [ Installation Guide | Update Guide | Troubleshooting | FAQ | All Products ] Customizable pattern sizes Customizable AC and BD ratios Customizable b
Gli utenti di questo prodotto hanno anche acquistato
Trend Screener Pro MT5
STE S.S.COMPANY
4.85 (80)
Indicatore di tendenza, soluzione unica rivoluzionaria per il trading di tendenze e il filtraggio con tutte le importanti funzionalità di tendenza integrate in un unico strumento! È un indicatore multi-timeframe e multi-valuta al 100% non ridipingibile che può essere utilizzato su tutti i simboli/strumenti: forex, materie prime, criptovalute, indici e azioni. Trend Screener è un indicatore di tendenza che segue un indicatore efficiente che fornisce segnali di tendenza a freccia con punti nel gra
Algo Pumping
Ihor Otkydach
5 (9)
PUMPING STATION – La tua strategia personale "all inclusive" Ti presentiamo PUMPING STATION — un indicatore Forex rivoluzionario che trasformerà il tuo modo di fare trading in un’esperienza efficace ed entusiasmante. Non si tratta solo di un assistente, ma di un vero e proprio sistema di trading completo con potenti algoritmi che ti aiuteranno a operare in modo più stabile. Acquistando questo prodotto, riceverai GRATUITAMENTE: File di configurazione esclusivi: per un'impostazione automatica e pr
Golden Trend Indicator MT5
Noha Mohamed Fathy Younes Badr
4.89 (18)
Golden Trend indicator  is The best indicator for predicting trend movement this indicator never lags and never repaints and never back paints    and give  arrow buy and sell    before the candle appear  and it will help you and  will make your trading decisions clearer its work on all currencies and  gold and crypto and all time frame This unique  indicator uses very secret algorithms to catch the  trends, so you can trade using this indicator and see the trend clear on charts  manual guide and
TPSpro RFI Levels MT5
Roman Podpora
4.55 (20)
Zone di inversione / Volumi di picco / Zone attive di un attore importante =       SISTEMA TS TPSPRO ISTRUZIONI RUS       /       ISTRUZIONI       ITA       /           Versione MT4        Ogni acquirente di questo indicatore riceve inoltre GRATIS: 6 mesi di accesso ai segnali di trading dal servizio RFI SIGNALS: punti di ingresso già pronti secondo l'algoritmo TPSproSYSTEM. Materiali didattici con aggiornamenti regolari: immergiti nella strategia e accresci il tuo livello professionale. Assis
RelicusRoad Pro MT5
Relicus LLC
4.78 (18)
Ora $ 147 (aumentando a $ 499 dopo alcuni aggiornamenti) - account illimitati (PC o MAC) Manuale utente di RelicusRoad + Video di formazione + Accesso al gruppo Discord privato + Stato VIP UN NUOVO MODO DI GUARDARE IL MERCATO RelicusRoad è l'indicatore di trading più potente al mondo per forex, futures, criptovalute, azioni e indici, fornendo ai trader tutte le informazioni e gli strumenti di cui hanno bisogno per rimanere redditizi. Forniamo analisi tecniche e piani di trading per aiutare og
TPSproTREND PrO MT5
Roman Podpora
4.72 (18)
VERSION MT4        —        ИНСТРУКЦИЯ RUS           —        INSTRUCTIONS  ENG Caratteristiche principali: Segnale di ingresso accurato senza rendering! Una volta che il segnale appare, rimane rilevante. Questa è una differenza importante rispetto agli indicatori di ridisegno, che forniscono un segnale e poi lo modificano, con conseguente potenziale perdita dei fondi depositati. Ora puoi entrare nel mercato con maggiore probabilità e precisione. C'è anche la possibilità di colorare le candele
Support And Resistance Screener è in un indicatore di livello per MetaTrader che fornisce più strumenti all'interno di un indicatore. Gli strumenti disponibili sono: 1. Screener della struttura del mercato. 2. Zona di ritiro rialzista. 3. Zona di ritiro ribassista. 4. Punti pivot giornalieri 5. Punti pivot settimanali 6. Punti pivot mensili 7. Forte supporto e resistenza basati sul modello e sul volume armonici. 8. Zone a livello di banca. OFFERTA A TEMPO LIMITATO: il supporto HV e l'indicatore
Gold Stuff mt5
Vasiliy Strukov
4.93 (178)
Gold Stuff mt5 è un indicatore di tendenza progettato specificamente per l'oro e può essere utilizzato anche su qualsiasi strumento finanziario. L'indicatore non ridisegna e non è in ritardo. Periodo consigliato H1. Contattami subito dopo l'acquisto per avere le impostazioni e un bonus personale!   I risultati in tempo reale possono essere visualizzati qui.  Puoi ottenere una copia gratuita del nostro indicatore Strong Support e Trend Scanner, per favore scrivi in ​​privato. M   IMPOSTAZIONI
Divergence Bomber
Ihor Otkydach
5 (1)
Ogni acquirente dell’indicatore riceverà inoltre gratuitamente: L’utilità esclusiva “Bomber Utility”, che gestisce automaticamente ogni operazione, imposta i livelli di Stop Loss e Take Profit e chiude le posizioni secondo le regole della strategia I file di configurazione (set file) per adattare l’indicatore a diversi asset I set file per configurare il Bomber Utility in tre modalità: “Rischio Minimo”, “Rischio Bilanciato” e “Strategia di Attesa” Una guida video passo-passo per installare, conf
MONEYTRON – ТВОЙ ЛИЧНЫЙ СИГНАЛ НА УСПЕХ! XAUUSD | AUDUSD | USDJPY | BTCUSD Поддержка таймфреймов: M5, M15, M30, H1 Почему трейдеры выбирают Moneytron? 82% успешных сделок — это не просто цифры, это результат продуманной логики, точного алгоритма и настоящей силы анализа. Автоматические сигналы на вход — не нужно гадать: когда покупать, когда продавать. 3 уровня Take Profit — ты сам выбираешь свой уровень прибыли: безопасный, уверенный или максимум. Четкий Stop Loss — контролируешь риск
FX Power MT5 NG
Daniel Stein
5 (15)
FX Power: Analizza la Forza delle Valute per Decisioni di Trading Più Intelligenti Panoramica FX Power è lo strumento essenziale per comprendere la reale forza delle principali valute e dell'oro in qualsiasi condizione di mercato. Identificando le valute forti da comprare e quelle deboli da vendere, FX Power semplifica le decisioni di trading e rivela opportunità ad alta probabilità. Che tu segua le tendenze o anticipi inversioni utilizzando valori estremi di Delta, questo strumento si adatta
FX Volume MT5
Daniel Stein
4.82 (17)
FX Volume: Scopri il Vero Sentimento di Mercato dalla Prospettiva di un Broker Panoramica Rapida Vuoi portare la tua strategia di trading a un livello superiore? FX Volume ti offre informazioni in tempo reale su come i trader retail e i broker sono posizionati—molto prima che compaiano report in ritardo come il COT. Che tu miri a guadagni costanti o desideri semplicemente un vantaggio più solido sui mercati, FX Volume ti aiuta a individuare grandi squilibri, confermare i breakout e perfezionar
Questo cruscotto mostra gli ultimi   pattern armonici   disponibili per i simboli selezionati, in modo da risparmiare tempo ed essere più efficienti /   versione MT4 . Indicatore gratuito:   Basic Harmonic Pattern Colonne dell'indicatore Symbol :   vengono visualizzati i simboli selezionati Trend:   rialzista o ribassista Pattern:   tipo di pattern (gartley, butterfly, bat, crab, shark, cypher o ABCD) Entry:   prezzo di ingresso SL:   prezzo di stop loss TP1:   1 prezzo di take profit TP2:
Grabber System MT5
Ihor Otkydach
5 (5)
Ti presento un eccellente indicatore tecnico: Grabber, che funziona come una strategia di trading "tutto incluso", pronta all’uso. In un solo codice sono integrati strumenti potenti per l’analisi tecnica del mercato, segnali di trading (frecce), funzioni di allerta e notifiche push. Ogni acquirente di questo indicatore riceve anche gratuitamente: L’utility Grabber: per la gestione automatica degli ordini aperti Video tutorial passo dopo passo: per imparare a installare, configurare e utilizzare
MTF Supply Demand Zones MT5
Georgios Kalomoiropoulos
5 (1)
Nuova generazione di zone di domanda e offerta automatizzate. Algoritmo nuovo e innovativo che funziona su qualsiasi grafico. Tutte le zone vengono create dinamicamente in base all'azione dei prezzi del mercato. DUE TIPI DI AVVISI --> 1) QUANDO IL PREZZO RAGGIUNGE UNA ZONA 2) QUANDO SI FORMA UNA NUOVA ZONA Non ottieni un altro indicatore inutile. Ottieni una strategia di trading completa con risultati comprovati.     Nuove caratteristiche:     Avvisi quando il prezzo raggiunge la zona di
Matrix Arrow Indicator MT5
Juvenille Emperor Limited
5 (13)
Matrix Arrow Indicator MT5   è un trend unico 10 in 1 che segue un indicatore multi-timeframe al   100% non ridipinto   che può essere utilizzato su tutti i simboli/strumenti:   forex ,   materie prime ,   criptovalute ,   indici ,   azioni .  Matrix Arrow Indicator MT5  determinerà la tendenza attuale nelle sue fasi iniziali, raccogliendo informazioni e dati da un massimo di 10 indicatori standard, che sono: Indice di movimento direzionale medio (ADX) Indice del canale delle materie prime (CCI
Quantum TrendPulse
Bogdan Ion Puscasu
5 (13)
Ecco   Quantum TrendPulse   , lo strumento di trading definitivo che combina la potenza di   SuperTrend   ,   RSI   e   Stocastico   in un unico indicatore completo per massimizzare il tuo potenziale di trading. Progettato per i trader che cercano precisione ed efficienza, questo indicatore ti aiuta a identificare con sicurezza le tendenze di mercato, i cambiamenti di momentum e i punti di entrata e uscita ottimali. Caratteristiche principali: Integrazione SuperTrend:   segui facilmente l'andame
Top indicator for MT5   providing accurate signals to enter a trade without repainting! It can be applied to any financial assets:   forex, cryptocurrencies, metals, stocks, indices .  Watch  the video  (6:22) with an example of processing only one signal that paid off the indicator! MT4 version is here It will provide pretty accurate trading signals and tell you when it's best to open a trade and close it. Most traders improve their trading results during the first trading week with the help of
ATrend
Zaha Feiz
4.77 (13)
"ATREND: Come funziona e come utilizzarlo" ### Come funziona L'indicatore "ATREND" per la piattaforma MT5 è progettato per fornire ai trader robusti segnali di acquisto e vendita utilizzando una combinazione di metodologie di analisi tecnica. Questo indicatore sfrutta principalmente l'Average True Range (ATR) per la misurazione della volatilità, insieme ad algoritmi di individuazione dei trend per identificare potenziali movimenti di mercato. Lascia un messaggio dopo l'acquisto e ricevi un rega
FxaccurateLS
Shiv Raj Kumawat
WHY IS OUR FXACCCURATE LS MT5 THE PROFITABLE ? PROTECT YOUR CAPITAL WITH RISK MANAGEMENT Gives entry, stop and target levels from time to time. It finds Trading opportunities by analyzing what the price is doing during established trends. POWERFUL INDICATOR FOR A RELIABLE STRATEGIES We have made these indicators with a lot of years of hard work. It is made at a very advanced level. Established trends provide dozens of trading opportunities, but most trend indicators completely ignore them! The
FX Levels MT5
Daniel Stein
5 (4)
FX Levels: Supporti e Resistenze di Precisione Eccezionale per Tutti i Mercati Panoramica Rapida Cercate un modo affidabile per individuare livelli di supporto e resistenza in ogni mercato—coppie di valute, indici, azioni o materie prime? FX Levels fonde il metodo tradizionale “Lighthouse” con un approccio dinamico all’avanguardia, offrendo una precisione quasi universale. Basato sulla nostra esperienza reale con i broker e su aggiornamenti automatici giornalieri più quelli in tempo reale, FX
Atomic Analyst MT5
Issam Kassas
4.32 (19)
Innanzitutto, vale la pena sottolineare che questo indicatore di trading non è repaint, non è ridisegno e non presenta ritardi, il che lo rende ideale sia per il trading manuale che per quello automatico. Manuale utente: impostazioni, input e strategia. L'Analista Atomico è un indicatore di azione del prezzo PA che utilizza la forza e il momentum del prezzo per trovare un miglior vantaggio sul mercato. Dotato di filtri avanzati che aiutano a rimuovere rumori e segnali falsi, e aumentare il pote
IX Power MT5
Daniel Stein
4.86 (7)
IX Power: Scopri approfondimenti di mercato per indici, materie prime, criptovalute e forex Panoramica IX Power è uno strumento versatile progettato per analizzare la forza di indici, materie prime, criptovalute e simboli forex. Mentre FX Power offre la massima precisione per le coppie di valute utilizzando i dati di tutte le coppie disponibili, IX Power si concentra esclusivamente sui dati di mercato del simbolo sottostante. Questo rende IX Power una scelta eccellente per mercati non correlat
FX Dynamic: Monitora volatilità e trend con un’analisi ATR personalizzabile Panoramica FX Dynamic è uno strumento potente che sfrutta i calcoli di Average True Range (ATR) per fornire ai trader informazioni impareggiabili sulla volatilità, sia giornaliera che intraday. Impostando soglie di volatilità chiare—ad esempio 80%, 100%, 130%—puoi individuare rapidamente opportunità di profitto o ricevere avvisi quando il mercato supera i range abituali. FX Dynamic si adatta al fuso orario del tuo brok
Questo cruscotto scopre e visualizza le zone di   domanda   e   offerta   sul grafico, sia in modalità scalping che a lungo termine, a seconda della vostra strategia di trading per i simboli selezionati. Inoltre, la modalità scanner del cruscotto vi aiuta a controllare tutti i simboli desiderati in un colpo d'occhio e a non perdere nessuna posizione adatta /   versione MT4 Indicatore gratuito:   Basic Supply Demand Caratteristiche Consente di visualizzare le opportunità di trading su più  
Innanzitutto, vale la pena sottolineare che questo Strumento di Trading è un Indicatore Non-Ridipingente, Non-Ridisegnante e Non-Laggante, il che lo rende ideale per il trading professionale. Corso online, manuale utente e demo. L'Indicatore Smart Price Action Concepts è uno strumento molto potente sia per i nuovi che per i trader esperti. Racchiude più di 20 utili indicatori in uno solo, combinando idee di trading avanzate come l'Analisi del Trader del Circolo Interno e le Strategie di Tradin
Trend Hunter MT5
Andrey Tatarinov
5 (2)
Trend Hunter è un indicatore di tendenza per lavorare nei mercati Forex, criptovaluta e CFD. Una caratteristica speciale dell'indicatore è che segue con sicurezza la tendenza, senza cambiare il segnale quando il prezzo supera leggermente la linea di tendenza. L'indicatore non viene ridisegnato; un segnale per entrare nel mercato appare dopo la chiusura della barra. Quando ci si sposta lungo un trend, l'indicatore mostra ulteriori punti di ingresso nella direzione del trend. Sulla base di quest
Blahtech Supply Demand MT5
Blahtech Limited
4.54 (13)
Was: $299  Now: $149  Supply Demand uses previous price action to identify potential imbalances between buyers and sellers. The key is to identify the better odds zones, not just the untouched ones. Blahtech Supply Demand indicator delivers functionality previously unavailable on any trading platform. This 4-in-1 indicator not only highlights the higher probability zones using a multi-criteria strength engine, but also combines it with multi-timeframe trend analysis, previously confirmed swings
MetaBands M5
Vahidreza Heidar Gholami
4.5 (2)
MetaBands uses powerful and unique algorithms to draw channels and detect trends so that it can provide traders with potential points for entering and exiting trades. It’s a channel indicator plus a powerful trend indicator. It includes different types of channels which can be merged to create new channels simply by using the input parameters. MetaBands uses all types of alerts to notify users about market events. Features Supports most of the channel algorithms Powerful trend detection algorith
- Real price is 80$ - 40% Discount (It is 49$ now) - Lifetime update free Contact me for instruction, any questions! Related Product:  Gold Trade Expert MT5 - Non-repaint - I just sell my products in Elif Kaya Profile, any other websites are stolen old versions, So no any new updates or support. Introduction The breakout and retest strategy is traded support and resistance levels. it involves price breaking through a previous level.  The break and retest strategy is designed to help traders do
Altri dall’autore
ZigZag Lines MTF for MT5
Taras Slobodyanik
5 (10)
Multi timeframe ZigZag indicator. It displays the support/resistance horizontal lines and their breakouts, as well as draws the current targets of the market. It can also display lines of the Fractals indicator and candles from other periods (up to Quarterly). So, you can actually see the supply and demand levels. You can also use it as indicator for the Break of Structure(BOS) & Market Structure Shift(MSS). The indicator redraws the last (current) point, and in some cases can change the last 2
Time Scale for MT5
Taras Slobodyanik
4.7 (23)
The indicator draws the time scale on the chart. You can specify the time offset, adjust the size and font to display on the chart ( it is displaying your local time on your chart instead of MT time ). You can also select the desired format for displaying the date and time. You may be interested in my other product , which contains a more advanced version of the Time Scale . Parameters Hours (time shift) — time shift (hours); Minutes (time shift) — time shift (minutes); Show time on mouse — sho
FREE
Pro Sessions MT4
Taras Slobodyanik
4.75 (4)
This is an indicator of trading sessions  that can display all levels (Open-High-Low-Close) for four sessions. The indicator can also predict session levels. Sessions can be drawn with lines or rectangles (empty or filled), lines can be extended to the next session. You can easily hide/show each session by pressing hotkeys (by default '1', '2', '3', '4'). You can see ASR (Average Session Range) lines  (default hotkey 'A'). This is similar to the ADR calculation, only it is calculated based on t
ADX Dashboard
Taras Slobodyanik
5 (5)
L'indicatore ADX viene utilizzato per determinare la tendenza e la sua forza. La direzione del prezzo è mostrata dai valori +DI e -DI e il valore ADX mostra la forza del trend. Se +DI è superiore a -DI, ​​il mercato è in un trend rialzista, se al contrario è in un trend al ribasso. Se l'ADX è inferiore a 20, non esiste una direzione definita. Non appena l'indicatore supera questo livello, inizia un trend di media forza. Valori superiori a 40 indicano un trend forte (un trend al ribasso o al ria
Modifica multivaluta e multitimeframe dell'oscillatore stocastico. È possibile specificare qualsiasi valuta e intervallo di tempo desiderati nei parametri. Il pannello visualizza i valori correnti e le intersezioni delle linee: Segnale e Principale (crossover stocastico). Inoltre, l'indicatore può inviare notifiche quando si attraversano i livelli di ipercomprato e ipervenduto. Cliccando su una cella con un punto, questo simbolo e punto verranno aperti. Questo è lo scanner MTF. Similmente al V
Heikin Ashi Dashboard MT5
Taras Slobodyanik
5 (3)
Multi-currency and multitimeframe Heikin Ashi indicator. Shows the current state of the market. On the scanner panel you can see the direction, strength and number of bars of the current trend. The Consolidation/Reversal candles are also shown using color. You can specify any desired currencies and periods in the parameters. Also, the indicator can send notifications when the trend changes or when reversal and consolidation candles (dojis) appear. By clicking on a cell, this symbol and period wi
ZigZag Dashboard for MT5
Taras Slobodyanik
5 (3)
Multicurrency and multitimeframe modification of the ZigZag indicator. Displays the current direction of the market, the height of the last movement, the number of bars in this movement and the breaking of the previous point of the ZigZag (horizontal line). This is MTF Scanner, you can actually see the supply and demand levels. You can specify any desired currencies and timeframes in the parameters. Also, the panel can send notifications when the ZigZag changes direction or when there was a br
Multicurrency and multi-timeframe indicator Inside Bar (IB). In the parameters, you can specify any desired currencies and timeframes. The panel displays the last found Inside Bar (and Mother Bar) pattern, the current price position and the breakout of the levels of the Mother and Inside Bars. You can set the size and color for bars and text in the cells. The indicator can also send notifications when levels are broken. By clicking on a cell with a period, the specified symbol and period will b
Heikin Ashi Dashboard
Taras Slobodyanik
5 (5)
Multi-currency and multitimeframe Heikin Ashi indicator. Shows the current state of the market. On the scanner panel you can see the direction, strength and number of bars of the current trend. The Consolidation/Reversal candles are also shown using color. You can specify any desired currencies and periods in the parameters. Also, the indicator can send notifications when the trend changes or when reversal and consolidation candles (dojis) appear. By clicking on a cell, this symbol and period wi
Multicurrency and multitimeframe modification of the indicator Bollinger Bands. On the dashboard you can see breakouts and touches of the Bollinger Bands. In the parameters you can specify any desired currencies and timeframes. The indicator can also send notifications when the price touches the Bollinger Bands, when the current volatility changes (expands or falls), and when the price touches all the bands. By clicking on a cell with a period, this symbol and period will be opened. This is MTF
The indicator has three main tools: Magnifier (Zoom chart), Ruler  ( Time and Price scales ),   and Crosshair. You can move it all around with your mouse and customize different formats for  displaying , customize   size and color of each element. The Magnifier (zoom chart) allows you to display candles from any time frame and at different scales. Hotkeys: 'Q' - higher timeframe, 'A' - lower timeframe, 'W' - decrease candle size, 'S' - increase candle size, 'Z' - show/hide zoom chart. You can
Multicurrency and multitimeframe indicator of the Standard Deviation Channel. Displays the current direction of the market. On the panel, you can see breakouts and touches (by price) of the levels of the linear regression channel. In the parameters, you can specify any desired currencies and timeframes. Also, the indicator can send notifications when levels are touched. By clicking on a cell, this symbol and period will be opened. This is MTF Scanner. The key to hide the dashboard from the char
Levels of Timeframes
Taras Slobodyanik
5 (2)
L'indicatore mostra i livelli Alto/Basso/Apertura/Chiusura da altri intervalli di tempo (e non standard): Anno, 6 Mesi, 4 Mesi, 3 Mesi, 2 Mesi, Mese, Settimana, Giorno, H3-H6-H8-H12 Ore . Puoi anche impostare lo spostamento per l'apertura delle candele e costruire candele virtuali. I "separatori di periodo" per uno di questi intervalli di tempo sono disponibili sotto forma di linee verticali. Gli avvisi possono essere configurati per i breakout dei livelli attuali o precedenti (breakout della l
Easy Grider for MT5
Taras Slobodyanik
3 (2)
The EA creates an order grid using labels. Opening and closing of the grid is done either automatically by the system signals or manually. In the same grid can be both Limit and Stop orders. It is possible to reverse the grid on specified condition. You can enter the breakdown/rebound from established levels. All types of Sell limit, Buy limit, Buy stop, Sell stop orders are supported. The grid is rebuilt with a single click. The stop loss and take profit lines can be easily modified. You are f
MACD Dashboard
Taras Slobodyanik
5 (2)
Multi-currency and multi-timeframe indicator MACD. The dashboard can display both the Traditional (true) MACD and the MACD which is built into MetaTrader. On the panel you can see the current state of the indicator — the direction of movement of the MACD lines, their intersection and a pop-up window with the indicator chart. In the parameters you can specify any desired pairs-symbols and timeframes. The scanner can also send notifications about lines crossing each other and about lines crossing
Multicurrency and multitimeframe modification of the indicator Bollinger Bands. On the dashboard you can see breakouts and touches of the Bollinger Bands. In the parameters you can specify any desired currencies and timeframes. The indicator can also send notifications when the price touches the Bollinger Bands, when the current volatility changes (expands or falls), and when the price touches all the bands. By clicking on a cell with a period, this symbol and period will be opened. This is MTF
Lines Profit Loss MT5
Taras Slobodyanik
4.62 (13)
L'indicatore mostra il profitto (perdita) sul simbolo corrente. Puoi trascinare e rilasciare liberamente la linea per visualizzare il profitto o la perdita corrente. Parametri Calculation in money or in points — calcola il profitto/perdita in punti o denaro. Add pending orders to calculate — prendi in considerazione gli ordini in sospeso nei calcoli. Magic Number (0 - all orders on symbol) — numero magico, se è necessario valutare ordini specifici. Offset for first drawing (points from the a
FREE
ZigZag Lines MTF
Taras Slobodyanik
4.38 (13)
Multi timeframe ZigZag indicator. It displays the support/resistance horizontal lines and their breakouts, as well as draws the current targets of the market. It can also display lines of the Fractals indicator and candles from other periods (up to Quarterly). So, you can actually see the supply and demand levels. You can also use it as indicator for the Break of Structure(BOS) & Market Structure Shift(MSS). The indicator redraws the last (current) point, and in some cases can change the last 2
MA Dashboard
Taras Slobodyanik
4 (1)
Modifica multivaluta e multitimeframe dell'indicatore Moving Average (MA). Sulla dashboard puoi vedere lo stato attuale dell'indicatore: breakout e tocchi (per prezzo) della MA veloce e della MA lenta, nonché l'intersezione delle linee MA tra loro (crossover della media mobile). Nei parametri è possibile specificare le valute e i tempi desiderati. Inoltre, l'indicatore può inviare notifiche sul prezzo che tocca le linee e sul loro attraversamento. Cliccando su una cella con un punto, questo sim
Modifica multivaluta e multitimeframe dell'indicatore Relative Strength Index (RSI). È possibile specificare qualsiasi valuta e intervallo di tempo desiderati nei parametri. Inoltre, il pannello può inviare notifiche quando si attraversano i livelli di ipercomprato e ipervenduto. Cliccando su una cella con un punto, questo simbolo e punto verranno aperti. Questo è lo scanner MTF. La chiave per nascondere la dashboard dal grafico è "D" per impostazione predefinita. Similmente al Valuta Strengt
L'indicatore mostra i livelli Alto/Basso/Apertura/Chiusura da altri intervalli di tempo (e non standard): Anno, 6 Mesi, 4 Mesi, 3 Mesi, 2 Mesi, Mese, Settimana, Giorno, H3-H6-H8-H12 Ore . Puoi anche impostare lo spostamento per l'apertura delle candele e costruire candele virtuali. I "separatori di periodo" per uno di questi intervalli di tempo sono disponibili sotto forma di linee verticali. Gli avvisi possono essere configurati per i breakout dei livelli attuali o precedenti (breakout della l
Pro Sessions MT5
Taras Slobodyanik
5 (1)
This is an indicator of trading sessions  that can display all levels (Open-High-Low-Close) for four sessions . The indicator can also predict session levels. Sessions can be drawn with lines or rectangles (empty or filled), lines can be extended to the next session. You can easily hide/show each session by pressing hotkeys (by default '1', '2', '3', '4'). You can see ASR (Average Session Range) lines  (default hotkey 'A'). This is similar to the ADR calculation, only it is calculated based on
Lines Profit Loss
Taras Slobodyanik
4.63 (16)
L'indicatore mostra il profitto (perdita) sul simbolo corrente. Puoi trascinare e rilasciare liberamente la linea per visualizzare il profitto o la perdita corrente. Parametri Calculation in money or in points — calcola il profitto/perdita in punti o denaro. Add pending orders to calculate — prendi in considerazione gli ordini in sospeso nei calcoli. Magic Number (0 - all orders on symbol) — numero magico, se è necessario valutare ordini specifici. Offset for first drawing (points from the a
FREE
ZigZag Dashboard for MT4
Taras Slobodyanik
4.75 (4)
Multicurrency and multitimeframe modification of the ZigZag indicator. Displays the current direction of the market, the height of the last movement, the number of bars in this movement and the breaking of the previous point of the ZigZag (horizontal line). This is MTF Scanner, you can actually see the supply and demand levels. You can specify any desired currencies and timeframes in the parameters. Also, the panel can send notifications when the ZigZag changes direction or when there was a br
Modifica multivaluta e multitimeframe dell'oscillatore stocastico. È possibile specificare qualsiasi valuta e intervallo di tempo desiderati nei parametri. Il pannello visualizza i valori correnti e le intersezioni delle linee: Segnale e Principale (crossover stocastico). Inoltre, l'indicatore può inviare notifiche quando si attraversano i livelli di ipercomprato e ipervenduto. Cliccando su una cella con un punto, questo simbolo e punto verranno aperti. Questo è lo scanner MTF. Similmente al V
Time Scale
Taras Slobodyanik
4.83 (12)
The indicator draws the time scale on the chart. You can specify the time offset, adjust the size and font to display on the chart (it is displaying your local time on your chart instead of MT time). You can also select the desired format for displaying the date and time. While holding down the middle mouse button, and moving the cursor, a slider will appear on the scale. You may be interested in my other product , which contains a more advanced version of the Time Scale. Parameters Hours (time
FREE
ADX Dashboard MT5
Taras Slobodyanik
5 (4)
L'indicatore ADX viene utilizzato per determinare la tendenza e la sua forza. La direzione del prezzo è mostrata dai valori +DI e -DI e il valore ADX mostra la forza del trend. Se +DI è superiore a -DI, ​​il mercato è in un trend rialzista, se al contrario è in un trend al ribasso. Se l'ADX è inferiore a 20, non esiste una direzione definita. Non appena l'indicatore supera questo livello, inizia un trend di media forza. Valori superiori a 40 indicano un trend forte (un trend al ribasso o al ria
MACD Dashboard MT5
Taras Slobodyanik
5 (1)
Multi-currency and multi-timeframe indicator MACD. The dashboard can display both the Traditional (true) MACD and the MACD which is built into MetaTrader. On the panel you can see the current state of the indicator — the direction of movement of the MACD lines, their intersection and a pop-up window with the indicator chart. In the parameters you can specify any desired pairs-symbols and timeframes. The scanner can also send notifications about lines crossing each other and about lines crossing
Magnifier Ruler Crosshair
Taras Slobodyanik
5 (2)
The indicator has three main tools: Magnifier (Zoom chart), Ruler  ( Time and Price scales ),   and Crosshair. You can move it all around with your mouse and customize different formats for  displaying , customize   size and color of each element. The Magnifier (zoom chart) allows you to display candles from any time frame and at different scales. Hotkeys: 'Q' - higher timeframe, 'A' - lower timeframe, 'W' - decrease candle size, 'S' - increase candle size, 'Z' - show/hide zoom chart. You can
Multicurrency and multitimeframe indicator of the Standard Deviation Channel. Displays the current direction of the market. On the panel, you can see breakouts and touches (by price) of the levels of the linear regression channel. In the parameters, you can specify any desired currencies and timeframes. Also, the indicator can send notifications when levels are touched. By clicking on a cell, this symbol and period will be opened. This is MTF Scanner. The key to hide the dashboard from the char
Filtro:
Devonish
3160
Devonish 2020.11.06 12:57 
 

L'utente non ha lasciato alcun commento sulla valutazione.

Aleksei Arbeev
125
Aleksei Arbeev 2020.01.13 20:00 
 

вот и весь ваш индикатор так https://charts.mql5.com/23/262/ed-3-20-m1-ao-otkritie-broker.png

Rispondi alla recensione
Versione 1.20 2021.12.01
1) Recompilation and algorithm improvement.
Versione 1.1 2016.12.21
Fixed bug removing objects at startup.