• Panoramica
  • Recensioni
  • Commenti (2)
  • Novità

StdATR Squeeze Channel

"The Squeeze indicator attempts to identify periods of consolidation in a market. In general the market is either in a period of quiet consolidation or vertical price discovery. By identifying these calm periods, we have a better opportunity of getting into trades with the potential for larger moves. Once a market enters into a "squeeze," we watch the overall market momentum to help forecast the market direction and await a release of market energy."

The StdATR Squeeze Channel combines standard deviation and average true range channels and email/message alerts to improve on the Bollinger band squeeze play. This is a great pattern that enables you to locate strong and profitable trade setups, and works on all time frames.

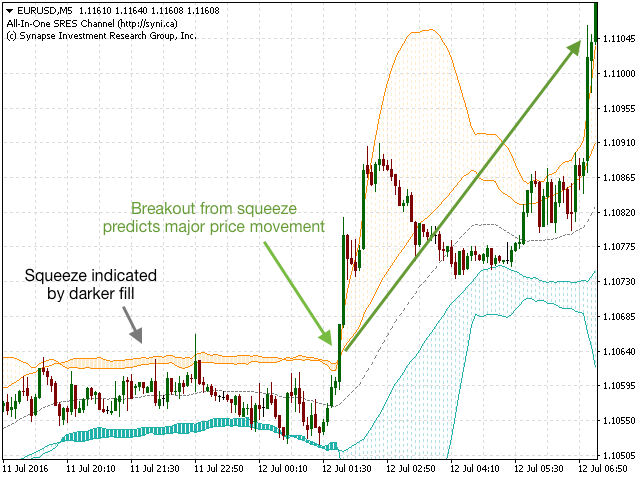
When the market slows, low volatility draws standard deviation bands inside the average true range channel ("squeeze"). Afterward, the release of a squeeze precedes a strong price movement, which can be very profitable if entered on time. This setup is great because the strong movement usually allows a tight stop loss and a wide target - in many cases a 1:10 SL to TP position is reasonable, i.e., great risk-to-reward ratio.

The key to the squeeze setup is entering on time, which is where StDATR Squeeze Channel excels. It clearly and quantitatively shows a squeeze onset and release, by comparing standard deviation to average true range channels. This is more robust, easier to use, and allows better entries than simple Bollinger bands, which would require you to estimate a squeeze onset/release. We have added email and message alerts to help you track multiple assets and enter on time.

This indicator is particularly well suited for traders who currently use Bollinger bands, and/or enjoy squeeze plays.


Sample Trading Strategy

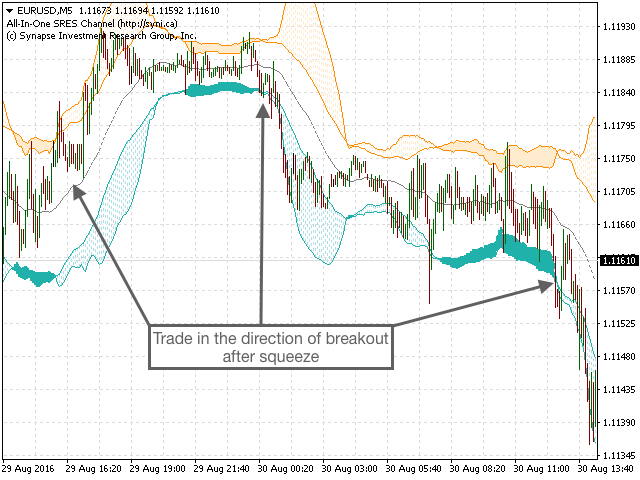
  • StDev bands inside ATR bands marks a 'squeeze,' and indicates a likely major upcoming price movement. The space between StDev and ATR bands indicates headroom for directional movement. Wait for squeeze that lasts more than 4 candles using squeeze channel.
  • When squeeze is released, trade in the direction of price movement


Parameters

  • Color Scheme: Select from one of the three pre-set color schemes, or choose "UserDefine" to enable defining your own colors (in Colors tab)
  • StDATR: Plot StD/ATR channel squeeze: True=plot squeeze channel
  • StDATR: Channel Period (Default=34): # bars used to calculate channel
  • StDATR: Channel Shift (Default=0): Shifts channel N bars forward (+ value) or backward (- value) in time
  • StDATR: Channel Deviations (Default=2.5): # stdev from the mean for calculating StD channel
  • StDATR: Squeeze release alerts: True=alerts when squeeze is released
  • StDATR: Turn on alerts message: Alert triggers a message box
  • StDATR: Turn on alerts sound: Alert triggers a sound
  • StDATR: Turn on alerts email: Alert sends an email (SMTP must be set up in MT4 options)


iCustom

Developers can use iCustom with this indicator, using the following code:

iCustom(NULL,0,"StdATR Squeeze Channel",1,34,0,2.5,false,false,false,false,0,0); // StDev upper band
iCustom(NULL,0,"StdATR Squeeze Channel",1,34,0,2.5,false,false,false,false,1,0); // ATR upper band
iCustom(NULL,0,"StdATR Squeeze Channel",1,34,0,2.5,false,false,false,false,2,0); // ATR lower band
iCustom(NULL,0,"StdATR Squeeze Channel",1,34,0,2.5,false,false,false,false,3,0); // StDev lower band 

You can download the StdATR Squeeze Channel here, or included with the All-In-One SRES Channel package (an inclusive charting package that also automatically plots support/resistance lines, H/L/O, and daily expected price range)

Prodotti consigliati
Infinity Trend Pro
Yaroslav Varankin
1 (1)
This is a trend indicator without redrawing Developed instead of the binary options strategy (by the color of the Martingale candlestick) Also works well in forex trading When to open trades (binary options) A signal will appear in the place with a candle signaling the current candle It is recommended to open a deal for one candle of the current timeframe M1 and M5 When a blue dot appears, open a deal up When a red dot appears, open a trade down. How to open trades on Forex. When a signal is rec
Alpha Trend sign has been a very popular trading tool in our company for a long time. It can verify our trading system and clearly indicate trading signals, and the signals will not drift. Main functions: Based on the market display of active areas, indicators can be used to intuitively determine whether the current market trend belongs to a trend market or a volatile market. And enter the market according to the indicator arrows, with green arrows indicating buy and red arrows indicating
Noize Absorption Index MT4
Ekaterina Saltykova
5 (1)
Noize Absorption Index - is the manual trading system that measures the difference of pressure between bears forces and bulls forces. Green line - is a noize free index that showing curent situation. Zero value of index shows totally choppy/flat market.Values above zero level shows how powerfull bullish wave is and values below zero measures bearish forces.Up arrow appears on bearish market when it's ready to reverse, dn arrow appears on weak bullish market, as a result of reverse expectation. S
Master Scalping M1 è un indicatore innovativo che utilizza un algoritmo per determinare il trend in modo rapido e preciso. L'indicatore calcola il tempo di apertura e chiusura delle posizioni, gli algoritmi dell'indicatore consentono di trovare i momenti ideali per entrare in un trade (acquistare o vendere un asset), il che aumenta il successo delle transazioni per la maggior parte dei trader. Vantaggi dell'indicatore: Facile da usare, non sovraccarica il grafico con informazioni inutili. Può es
The Penta-O is a 6-point retracement harmonacci pattern which usually precedes big market movements. Penta-O patterns can expand and repaint quite a bit. To make things easier this indicator implements a twist: it waits for a donchian breakout in the right direction before signaling the trade. The end result is an otherwise repainting indicator with a very reliable trading signal. The donchian breakout period is entered as an input. [ Installation Guide | Update Guide | Troubleshooting | FAQ | A
Super Reversal Pattern
Parfait Mujinga Ndalika
Super Reversal Pattern Indicator Unlock the power of advanced pattern recognition with our Super Reversal Pattern Indicator. Designed for traders seeking precision and reliability, this indicator identifies one of the most effective reversal patterns in technical analysis, offering a significant edge in your trading strategy. Key Features: Non-Repainting Accuracy: Enjoy the confidence of non-repainting technology. Once a Super Reversal Pattern is detected, it remains static, providing consis
Fibonacci retracements can be used to draw support lines, identify resistance levels, place stop-loss orders and set target prices. The Advanced Automatic Fibonacci retracements draws automatically all the levels. You have a lot of options to choose. For exemple you can use the tracements of another time frame (MTF) in the current chart, you can also choose between the closest level or less close to draw the retracements. You can also add 2 levels of your choice. You can add levels extensions o
Power Renko MT4
Pierce Vallieres
Power Renko is an indicator which plots Renko bricks underneath the chart using a histogram. You can select the brick size and the timeframe of the Renko bricks as well as whether or not to use the close price or the high/low price of the candles. Renko bricks are based on price alone, not time, therefor the Renko bricks will not be aligned with the chart's time. They are extremely useful for trend trading and many different strategies can be formed from them. Buffers are provided allowing you t
The Th3Eng PipFinite indicator is based on a very excellent analysis of the right trend direction with perfect custom algorithms. It show the true direction and the best point to start trading. With StopLoss point and Three Take Profit points. Also it show the right pivot of the price and small points to order to replace the dynamic support and resistance channel, Which surrounds the price. And Finally it draws a very helpful Box on the left side on the chart includes (take profits and Stop loss
Binary Options Support Resistance Indicator This indicator is designed for binary options trading and effectively shows retracements from support and resistance levels. Signals appear on the current candle. A red arrow pointing downwards indicates a potential selling opportunity, while a blue arrow pointing upwards suggests buying opportunities. All that needs adjustment is the color of the signal arrows. It is recommended to use it on the M1-M5 timeframes as signals are frequent on these timef
Trade with Gann on your side!! MASTER CIRCLE 360 CIRCLE CHART, originally created by Gann admitted that this is “The Mother of all charts”. It is one of the last studies that this great trader left for us. The numeric tab le is apparently quite simple like all the tables and is based on square numbers, the SQUARE OF 12 and is by evolution, one of the most important square numbers. Here we can find CYCLE, PRICE AND TIME thanks to angles and grades, to show past and future support and resistance.
Owl smart levels
Sergey Ermolov
4.34 (35)
Versione MT5  |  FAQ L' indicatore Owl Smart Levels   è un sistema di trading completo all'interno dell'unico indicatore che include strumenti di analisi di mercato popolari come i   frattali avanzati di Bill Williams , Valable ZigZag che costruisce   la corretta struttura a onde   del mercato, e i   livelli di Fibonacci che segnano i livelli esatti di entrata nel mercato e luoghi per prendere profitti. Descrizione dettagliata della strategia Istruzioni per lavorare con l'indicatore Consulente-
Based on MACD indicator waves with standard parameters Applies Fibonacci levels to the last two MACD waves, positive and negative respectively, if at the moment the MACD indicator runs out of negative Wave - the color is green, if at the moment the MACD indicator runs out of positive Wave - the color is red. The Wave termination criterion is two ticks with a different MACD sign. Applies trend lines on the last four MACD Waves. Works well with the expert Figures MACD   https://www.mql5.com/ru/mar
ICT Kill zone and Macros Indicator mark and display the following zone times on the chart: Kill zones   Kill zone Forex Asian London Open New York Open London Close Central Bank Dealing range Kill zone Indices Asian London Open New York AM New York Lunch New York PM Power Hour Macros London 1 London 2 New York Am 1 New York AM 2 New York Lunch New York PM 1 New York PM 2 Silver bullet London Open New York AM New York PM Sessions Asian London New York Chart The display of  Kill zone ,
Cosmic Diviner X Planet
Olena Kondratenko
4 (2)
This unique multi-currency strategy simultaneously determines the strength of trends and market entry points, visualizing this using histograms on the chart. The indicator is optimally adapted for trading on the timeframes М5, М15, М30, Н1. For the convenience of users, the indicator renders the entry point (in the form of an arrow), recommended take profit levels (TP1, TP2 with text labels) and the recommended Stop Loss level. The take profit levels (TP1, TP2) are automatically calculated for
[ZhiBiCCI] indicators are suitable for all cycle use, and are also suitable for all market varieties. [ZhiBiCCI] Green solid line is a reversal of bullish divergence. The green dotted line is a classic bullish divergence. [ZhiBiCCI] The solid line to the red is a reverse bearish divergence. The red dotted line is a classical bearish divergence. [ZhiBiCCI] can be set in the parameters (Alert, Send mail, Send notification), set to (true) to send instant signals to the alarm window, email, in
The indicator displays the data of the Stochastic oscillator from a higher timeframe on the chart. The main and signal lines are displayed in a separate window. The stepped response is not smoothed. The indicator is useful for practicing "manual" forex trading strategies, which use the data from several screens with different timeframes of a single symbol. The indicator uses the settings that are identical to the standard ones, and a drop-down list for selecting the timeframe. Indicator Parame
Trendiness Index
Libertas LLC
5 (3)
"The trend is your friend" is one of the best known sayings in investing, because capturing large trendy price movements can be extremely profitable. However, trading with the trend is often easier said than done, because many indicators are based on price reversals not trends. These aren't very effective at identifying trendy periods, or predicting whether trends will continue. We developed the Trendiness Index to help address this problem by indicating the strength and direction of price trend
The Sextet Scalper Pro  is an MT4 indicator that gives signals when new waves are starting in a trend. The trends are calculated using the original " The Sextet " indicator method. You get a free EA to trade with The Sextet Scalper Pro: Free EA . Default settings were optimized on GBPUSD H1 from 2017. EA could be tested on free demo version of The Sextet Scalper Pro, before purchase. Key Features: Uses The Sextet Trend Detection Method which is already a good strategy in itself for detecting l
We present you the indicator "Candle closing counter", which will become your indispensable assistant in the world of trading. That’s why knowing when the candle will close can help: If you like to trade using candle patterns, you will know when the candle will be closed. This indicator will allow you to check if a known pattern has formed and if there is a possibility of trading. The indicator will help you to prepare for market opening and market closure. You can set a timer to create a p
Magic Filter MTF
Yaroslav Varankin
Magic Filter MTF is perfect for any strategy. you do not need to load the chart with extra indicators like this one indicator will replace all additional filters for you it can also be a great strategy. it combines well with trading at local minima and maximums (resistance levels) multi-timeframe-multi-currency indicator 4 screen system is used 4 rows of arrows UTB indicators adjusted for different periods when two arrows pointing in the same direction on the same timeframe coincide
Daily Candle Predictor è un indicatore che prevede il prezzo di chiusura di una candela. L'indicatore è destinato principalmente all'uso sui grafici D1. Questo indicatore è adatto sia per il trading forex tradizionale che per il trading di opzioni binarie. L'indicatore può essere utilizzato come sistema di trading autonomo o può fungere da aggiunta al sistema di trading esistente. Questo indicatore analizza la candela corrente, calcolando alcuni fattori di forza all'interno del corpo della cande
PZ Fibonacci
PZ TRADING SLU
Are you tired of plotting fibonacci retracements or extensions manually? This indicator displays fibonacci retracements or extensions automatically, calculated from two different price points, without human intervention or manual object anchoring.  [ Installation Guide | Update Guide | Troubleshooting | FAQ | All Products ] Easy to use Manual anchoring is not needed Perfect for price confluence studies The indicator evaluates if retracements or extensions are needed Once drawn, you can manually
Una delle sequenze numeriche è chiamata "Sequenza di incendi boschivi". È stata riconosciuta come una delle nuove sequenze più belle. La sua caratteristica principale è che questa sequenza evita andamenti lineari, anche quelli più brevi. È questa proprietà che ha costituito la base di questo indicatore. Quando si analizza una serie temporale finanziaria, questo indicatore cerca di rifiutare tutte le possibili opzioni di tendenza. E solo se fallisce, riconosce la presenza di una tendenza e dà il
To get access to MT5 version please click here . - This is the exact conversion from TradingView: "Stochastic Momentum Index" By "UCSgears". - This is a popular version of stochastic oscillator on tradingview. - This is a light-load processing and non-repaint indicator. - Buffers are available for the lines on chart. - You can message in private chat for further changes you need. Thanks for downloading
PABT Pattern Indicator - it's classical system one of the signal patterns. Indicator logic - the Hi & Lo of the bar is fully within the range of the preceding bar, look to trade them as pullback in trend. In the way if indicator found PABT pattern it's drawing two lines and arrow what showing trend way.  - First line - it's entry point and drawing at: 1. On the high of signal bar or on middle of the signal bar (depending from indicator mode) for buy; 2. On the low of signal bar or on middle of t
Trend Bilio - an arrow indicator without redrawing shows potential market entry points in the form of arrows of the corresponding color: upward red arrows suggest opening a buy, green down arrows - selling. The entrance is supposed to be at the next bar after the pointer. The arrow indicator Trend Bilio visually "unloads" the price chart and saves time for analysis: no signal - no deal, if an opposite signal appears, then the current deal should be closed. It is Trend Bilio that is considered
Fibonacci retracement and extension line drawing tool Fibonacci retracement and extended line drawing tool for MT4 platform is suitable for traders who use  golden section trading Advantages: There is no extra line, no too long line, and it is easy to observe and find trading opportunities Trial version: https://www.mql5.com/zh/market/product/35884 Main functions: 1. Multiple groups of Fibonacci turns can be drawn directly, and the relationship between important turning points
This is an arrow indicator without a future function,developed based on the most advanced profit trading algorithms.It has the most innovative and advanced dual trend analysis module, as well as the latest and highly effective market trend prediction algorithm.Trends are your friends, and following larger trends can earn the maximum profit in foreign exchange. This indicator helps traders identify current trends and track them. Someone once made a profit of 10 times in a week by relying on it.No
Support and Resistance is a very important reference for trading.  This indicator provides customized support and resistance levels, automatic draw line and play music functions.  In addition to the custom RS, the default RS includes Pivot Point, Fibonacci, integer Price, MA, Bollinger Bands. Pivot Point is a resistance and support system. It has been widely used at froex,stocks, futures, treasury bonds and indexes. It is an effective support resistance analysis system. Fibonacci also known as t
Gli utenti di questo prodotto hanno anche acquistato
Gann Made Easy
Oleg Rodin
4.86 (83)
Gann Made Easy è un sistema di trading Forex professionale e facile da usare che si basa sui migliori principi del trading utilizzando la teoria di mr. WD Gann. L'indicatore fornisce segnali ACQUISTA e VENDI accurati, inclusi i livelli di Stop Loss e Take Profit. Puoi fare trading anche in movimento utilizzando le notifiche PUSH. Vi prego di contattarmi dopo l'acquisto! Condividerò i miei consigli di trading con te e fantastici indicatori bonus gratuitamente! Probabilmente hai già sentito parlar
FX Volume
Daniel Stein
4.58 (33)
Ricevi il tuo aggiornamento quotidiano sul mercato con dettagli e schermate tramite il nostro Morning Briefing qui su mql5 e su Telegram ! FX Volume è il PRIMO e UNICO indicatore di volume che fornisce una visione REALE del sentiment del mercato dal punto di vista del broker. Fornisce informazioni straordinarie su come gli operatori di mercato istituzionali, come i broker, sono posizionati sul mercato Forex, molto più velocemente dei rapporti COT. Vedere queste informazioni direttamente sul vo
Enigmera
Ivan Stefanov
5 (3)
ENIGMERA: Il cuore del mercato https://www.enigmera.com Introduzione Questo indicatore e sistema di trading rappresenta un approccio straordinario ai mercati finanziari. ENIGMERA utilizza i cicli frattali per calcolare con precisione i livelli di supporto e resistenza. Mostra l'autentica fase di accumulazione e fornisce direzione e obiettivi.  Un sistema che funziona sia in un trend che in una correzione.  Come funziona? ENIGMERA è composto da tre linee: la linea di supporto/resistenza, la
Gold Stuff
Vasiliy Strukov
4.89 (241)
Gold Stuff è un indicatore di tendenza progettato specificamente per l'oro e può essere utilizzato anche su qualsiasi strumento finanziario. L'indicatore non ridisegna e non è in ritardo. Periodo consigliato H1. Su di esso l'indicatore funziona in modo completamente automatico Expert Advisor EA Gold Stuff. Lo trovi nel mio profilo. I risultati in tempo reale possono essere visualizzati qui.  Puoi ottenere una copia gratuita del nostro indicatore Strong Support e Trend Scanner, per favore scri
Atomic Analyst
Issam Kassas
5 (2)
Innanzitutto, vale la pena sottolineare che questo indicatore di trading non è repaint, non è ridisegno e non presenta ritardi, il che lo rende ideale sia per il trading manuale che per quello automatico. Manuale utente: impostazioni, input e strategia. L'Analista Atomico è un indicatore di azione del prezzo PA che utilizza la forza e il momentum del prezzo per trovare un miglior vantaggio sul mercato. Dotato di filtri avanzati che aiutano a rimuovere rumori e segnali falsi, e aumentare il pote
FX Power MT4 NG
Daniel Stein
5 (13)
Ricevi il tuo aggiornamento quotidiano sul mercato con dettagli e schermate tramite il nostro Morning Briefing qui su mql5 e su Telegram ! FX Power MT4 NG è la nuova generazione del nostro popolare misuratore di forza delle valute, FX Power. Cosa offre questo misuratore di forza di nuova generazione? Tutto ciò che avete amato dell'FX Power originale IN PIÙ Analisi della forza di ORO/XAU Risultati di calcolo ancora più precisi Periodi di analisi configurabili individualmente Limite di calcolo pe
Trend Punch
Mohamed Hassan
4.95 (19)
This indicator is unstoppable when combined with our other indicator called  Support & Resistance . After purchase, send us a message and you will get it   for  FREE as a BONUS! Introducing Trend Punch , the revolutionary forex trend indicator that will transform the way you trade! Trend Punch is uniquely designed to provide precise buy and sell arrows during strong market trends, making your trading decisions clearer and more confident. Whether you're trading major currency pairs or exotic sym
Gann Swing Structure
Kirill Borovskii
5 (1)
This indicator is based on the mathematics of the great trader W.D. Ganna. With its help, you can easily find strong levels by analyzing swings to find the optimal entry point. The indicator works on all instruments and all timeframes. The indicator is fully manual and has control buttons. All you need to do is press the NEW button, a segment will appear, which you can place on any movement, swing or even 1 candle that you want to analyze. By placing the segment, press the OK button. A grid (th
Scalper Inside PRO
Alexey Minkov
4.73 (56)
An exclusive indicator that utilizes an innovative algorithm to swiftly and accurately determine the market trend. The indicator automatically calculates opening, closing, and profit levels, providing detailed trading statistics. With these features, you can choose the most appropriate trading instrument for the current market conditions. Additionally, you can easily integrate your own arrow indicators into Scalper Inside Pro to quickly evaluate their statistics and profitability. Scalper Inside
Dynamic Forex28 Navigator
Bernhard Schweigert
5 (1)
Dynamic Forex28 Navigator - Lo strumento di trading Forex di nuova generazione. ATTUALMENTE SCONTATO DEL 49%. Dynamic Forex28 Navigator è l'evoluzione dei nostri indicatori popolari di lunga data, che combinano la potenza di tre in uno: Advanced Currency Strength28 Indicator (695 recensioni) + Advanced Currency IMPULSE con ALERT (520 recensioni) + CS28 Combo Signals (Bonus). Dettagli sull'indicatore https://www.mql5.com/en/blogs/post/758844 Cosa offre l'indicatore di forza di nuova generazion
Attualmente 20% di sconto! La soluzione migliore per ogni principiante o trader esperto! Questo software per cruscotti funziona su 28 coppie di valute. Si basa su 2 dei nostri indicatori principali (Advanced Currency Strength 28 e Advanced Currency Impulse). Offre un'ottima panoramica dell'intero mercato Forex. Mostra i valori di forza delle valute avanzate, la velocità di movimento delle valute e i segnali per 28 coppie Forex in tutti i (9) timeframe. Immaginate come migliorerà il vostro t
Trend Screener
STE S.S.COMPANY
4.81 (88)
Indicatore di tendenza, soluzione unica rivoluzionaria per il trading di tendenze e il filtraggio con tutte le importanti funzionalità di tendenza integrate in un unico strumento! È un indicatore multi-timeframe e multi-valuta al 100% non ridipingibile che può essere utilizzato su tutti i simboli/strumenti: forex, materie prime, criptovalute, indici e azioni. OFFERTA A TEMPO LIMITATO: l'indicatore di screening di supporto e resistenza è disponibile a soli 50$ e a vita. (Prezzo originale 250$) (o
TPSproTREND PrO
Roman Podpora
4.79 (19)
TPSpro TREND PRO   è un indicatore di tendenza che analizza automaticamente il mercato, fornisce informazioni sulla tendenza e sui rispettivi cambiamenti e fornisce segnali per entrare nelle operazioni senza ridisegnare. L'indicatore utilizza ciascuna candela e la analizza separatamente. Si riferisce a vari shock al rialzo o al ribasso. Punto di ingresso preciso per il trading di valute, criptovalute, metalli, azioni e indici! Versione MT5                   Descrizione completa dell'indicatore
Vi presentiamo ON Trade Waves Patterns Harmonic Elliot Wolfe, un indicatore avanzato progettato per rilevare vari tipi di pattern sul mercato utilizzando metodi sia manuali che automatici. Ecco come funziona: Pattern Armonici: Questo indicatore è in grado di individuare pattern armonici che appaiono sul vostro grafico. Questi pattern sono fondamentali per i trader che praticano la teoria del trading armonico, come descritta nel libro di Scott Carney "Harmonic Trading vol 1 & 2". Che li disegniat
Scalper Vault
Oleg Rodin
5 (27)
Scalper Vault è un sistema di scalping professionale che ti fornisce tutto il necessario per scalping di successo. Questo indicatore è un sistema di trading completo che può essere utilizzato dai trader di forex e opzioni binarie. L'intervallo di tempo consigliato è M5. Il sistema fornisce segnali di freccia accurati nella direzione della tendenza. Ti fornisce anche i segnali più alti e più bassi e i livelli di mercato di Gann. Gli indicatori forniscono tutti i tipi di avvisi, comprese le notifi
TPA True Price Action indicator reveals the true price action of the market makers through 100% non-repainting signals (except early signals mode) strictly at the close of a candle! TPA shows entries and re-entries, every time the bulls are definitely stronger than the bears and vice versa. Not to confuse with red/green candles. The shift of power gets confirmed at the earliest stage and is ONE exit strategy of several. There are available now two free parts of the TPA User Guide for our custo
Currency Strength Wizard è un indicatore molto potente che ti fornisce una soluzione all-in-one per un trading di successo. L'indicatore calcola la potenza di questa o quella coppia forex utilizzando i dati di tutte le valute su più intervalli di tempo. Questi dati sono rappresentati in una forma di indice di valuta facile da usare e linee elettriche di valuta che puoi utilizzare per vedere il potere di questa o quella valuta. Tutto ciò di cui hai bisogno è collegare l'indicatore al grafico che
PRO Renko System
Oleg Rodin
5 (25)
PRO Renko System è un sistema di trading altamente accurato appositamente progettato per il trading di grafici RENKO. Questo è un sistema universale che può essere applicato a vari strumenti di trading. Il sistema neutralizza efficacemente il cosiddetto rumore di mercato che consente di accedere a segnali di inversione accurati. L'indicatore è molto facile da usare e ha un solo parametro responsabile della generazione del segnale. Puoi facilmente adattare lo strumento a qualsiasi strumento
TPSpro RFI Levels
Roman Podpora
4.82 (22)
ISTRUZIONI       RUS   -   INGLESE       Si   consiglia di utilizzare con un indicatore       -       TPSpro   TENDENZA PRO -   Versione MT4         Un elemento chiave nel trading sono le zone o i livelli da cui vengono prese le decisioni di acquisto o vendita di uno strumento di trading. Nonostante i tentativi dei principali attori di nascondere la loro presenza sul mercato, lasciano inevitabilmente delle tracce. Il nostro compito era imparare a identificare queste tracce e interpretarle corre
Currency Strength Exotics
Bernhard Schweigert
4.87 (30)
ATTUALMENTE SCONTATO DEL 20%! La soluzione migliore per qualsiasi principiante o trader esperto! Questo indicatore è specializzato nel mostrare la forza della valuta per qualsiasi simbolo come coppie esotiche, materie prime, indici o futures. È il primo nel suo genere, qualsiasi simbolo può essere aggiunto alla nona riga per mostrare la vera forza della valuta di Oro, Argento, Petrolio, DAX, US30, MXN, TRY, CNH ecc. Si tratta di uno strumento di trading unico, di alta qualità e conveniente
Trend Pulse
Mohamed Hassan
5 (4)
Please contact me after purchase to immediately get your PDF strategy + documentation for Trend Pulse !  Introducing Trend Pulse , a unique and robust indicator capable of detecting bullish, bearish, and even ranging trends! Trend Pulse uses a special algorithm to filter out market noise with real precision. If the current symbol is moving sideways, Trend Pulse will send you a ranging signal, letting you know that it's not a good time to enter a trade. This excellent system makes Trend Pulse
MetaBands M4
Vahidreza Heidar Gholami
5 (2)
MetaBands uses powerful and unique algorithms to draw channels and detect trends so that it can provide traders with potential points for entering and exiting trades. It’s a channel indicator plus a powerful trend indicator. It includes different types of channels which can be merged to create new channels simply by using the input parameters. MetaBands uses all types of alerts to notify users about market events. Features Supports most of the channel algorithms Powerful trend detection algorith
Gold Channel is a volatility-based indicator, developed with a specific timing algorithm for the XAUUSD pair, which consists of finding possible corrections in the market. This indicator shows two outer lines, an inner line (retracement line) and an arrow sign, where the theory of the channel is to help identify overbought and oversold conditions in the market. The market price will generally fall between the boundaries of the channel. If prices touch or move outside the channel it is a tra
Automated Trendlines
Georgios Kalomoiropoulos
5 (16)
Le linee di tendenza sono lo strumento più essenziale di analisi tecnica nel forex trading. Sfortunatamente, la maggior parte dei trader non li disegna correttamente. L'indicatore automatizzato delle linee di tendenza è uno strumento professionale per i trader seri che ti aiuta a visualizzare il movimento di tendenza dei mercati. Esistono due tipi di linee di tendenza, linee di tendenza rialziste e linee di tendenza ribassiste. Nella tendenza rialzista, la linea di tendenza Forex viene t
Reversal Sniper is designed to find the extreme reversals of the price. Indicator collects data of Cycle Sniper Indicator. NOTE: REVERSAL SNIPER Indicator is made for Cycle Sniper Users as an additional tool.  However, it can be used by the traders who look for finding out strong reversal levels. Indicator works on all timeframes and all instruments. Reversal  Sniper  Checks: Harmonic Patterns RSI Zig Zag and Harmonic Swings Cycle Sniper Indicator's Buy / Sell Signals The complex algo i
SI PREGA DI LEGGERE LE INFORMAZIONI QUI SOTTO PRIMA DI ACQUISTARE IL PRODOTTO! Apollo Pips PLUS SP è un prodotto unico! È PER CHI VUOLE OTTENERE IL MIO NUOVO INDICATORE "APOLLO PIPS" PIÙ IL BONUS "SUPER PACK" CON ACCESSO A TUTTI I MIEI INDICATORI DI TRADING! Acquistando il prodotto Apollo Pips PLUS SP stai effettivamente acquistando una versione assolutamente nuova del mio indicatore Apollo Pips. Questa versione dell'indicatore ha un algoritmo migliorato e un parametro facile da usare che ti dà
Introducing the South African Sniper indicator created by a small group of traders with a few years trading trading the financial market profitably . This is a plug and play indicator that provides you with  BUY and SELL (SNIPER ENTRY) signals with TARGET and trail stops. The indicator Works with all MT4 trading instruments. The indicator uses previous  chart data as receipt to speculate on future market moves.
Questo cruscotto mostra gli ultimi pattern armonici disponibili per i simboli selezionati, in modo da risparmiare tempo ed essere più efficienti / versione MT5 . Indicatore gratuito: Basic Harmonic Pattern Colonne dell'indicatore Symbol : vengono visualizzati i simboli selezionati Trend: rialzista o ribassista Pattern: tipo di pattern (gartley, butterfly, bat, crab, shark, cypher o ABCD) Entry: prezzo di ingresso SL: prezzo di stop loss TP1: 1 prezzo di take profit TP2: 2 prezzo di take
PowerBall Signals è un indicatore di segnali ACQUISTA/VENDI basato sull'idea di utilizzare zone di supporto/resistenza. L'indicatore rileva speciali modelli di inversione basati su zone di supporto/resistenza e fornisce questi segnali sul grafico. L'idea principale dell'indicatore è utilizzare l'analisi MTF (Multi Time Frame) e fornire segnali basati sui livelli dell'intervallo di tempo corrente e successivo. Questo metodo consente di prevedere possibili inversioni di prezzo su qualsiasi mercato
IX Power MT4
Daniel Stein
5 (5)
IX Power porta finalmente l'imbattibile precisione di FX Power ai simboli non-Forex. Determina con precisione l'intensità delle tendenze a breve, medio e lungo termine dei vostri indici preferiti, azioni, materie prime, ETF e persino criptovalute. Potete analizzare tutto ciò che il vostro terminale ha da offrire. Provatelo e sperimentate come il vostro tempismo migliori significativamente durante il trading. Caratteristiche principali di IX Power Risultati di calcolo precisi al 100% e n
Altri dall’autore
Two Period RSI + Alerts compares long-term and short-term RSI lines, and plots a fill between them for improved visualization. Fill is colored differently according to an uptrend (short period RSI above long period RSI) or a downtrend (short period RSI below long period RSI). Short-term RSI crossing long-term RSI adds a more robust trend confirmation signal than using single period RSI alone. This is a tool to help visualize and confirm RSI trends. We hope you enjoy! Alerts Email, message, and
Catch major price movements, early in the trend. Alerts you to enter at the likely beginning of a trend, and if it's incorrect, quickly alerts you to exit to limit any loss. Designed to capture large, profitable price movements, with early entrance to maximize your returns. As shown in screenshots, typical behavior is several quick entrance/exists with small loss , and then capture of a large trend with high profits .  The Instantaneous Trend  indicator is a lag-reduced method to detect price t
Detect strength for uptrends and downtrends by tracking Buy Power and Sell Power. Stay on the right side of the market by being able to determine whether the market is in a bull or bear trend and how strong the trend is. Free download for a limited time! We hope you enjoy, with our very best wishes during this pandemic! Trend Trigger Factor  aims to ride out sideways movement, while positioning the trader in the correct side of the market to capture big trends when they occur. It was   orig
FREE
"The Squeeze indicator attempts to identify periods of consolidation in a market. In general the market is either in a period of quiet consolidation or vertical price discovery. By identifying these calm periods, we have a better opportunity of getting into trades with the potential for larger moves. Once a market enters into a "squeeze," we watch the overall market momentum to help forecast the market direction and await a release of market energy." Modified TTM Squeeze Indicator is a modifica
Laguerre SuperTrend Clouds adds an Adaptive Laguerre averaging algorithm and alerts to the widely popular SuperTrend indicator. As the name suggests, Laguerre SuperTrend Clouds (LSC) is a trending indicator which works best in trendy (not choppy) markets. The SuperTrend is an extremely popular indicator for intraday and daily trading, and can be used on any timeframe. Incorporating Laguerre's equation to this can facilitate more robust trend detection and smoother filters. The LSC uses the impro
Two Period RSI
Libertas LLC
5 (4)
Two Period RSI compares long-term and short-term RSI lines, and plots a fill between them for improved visualization. Fill is colored differently according to an uptrend (short period RSI above long period RSI) or a downtrend (short period RSI below long period RSI). Short-term RSI crossing long-term RSI adds a more robust trend confirmation signal than using single period RSI alone. This is a small tool to help visualize and confirm RSI trends. We hope you enjoy! Looking for RSI alerts? You can
FREE
Whether trading stocks, futures, options, or FX, traders confront the single most important question: to trade trend or range? This tool helps you identify ranges to either trade within, or, wait for breakouts signaling trend onset. Free download for a limited time! We hope you enjoy, with our very best wishes during this pandemic! The issue with identifying ranges is some ranges and patterns are easy to miss, and subject to human error when calculated on the fly. The Automatic Range Identi
FREE
Trendiness Index
Libertas LLC
5 (3)
"The trend is your friend" is one of the best known sayings in investing, because capturing large trendy price movements can be extremely profitable. However, trading with the trend is often easier said than done, because many indicators are based on price reversals not trends. These aren't very effective at identifying trendy periods, or predicting whether trends will continue. We developed the Trendiness Index to help address this problem by indicating the strength and direction of price trend
"Capture the sleeping and waking alligator." Detect trend entrance/exit conditions - this indicator can also be tuned according to your trading style. You can adjust a confidence parameter to reduce false positives (but capture less of the trend). This is based on a modification of the Alligator indicator by Bill Williams, an early pioneer of market psychology.  2 main strategies: either the " conservative"  approach to more frequently make profitable trades (at a lower profit), or the " high r
FREE
EMA Separation Coefficient reflects the separation between short-term and long-term exponential moving average trend resistance, as well as the direction of the current movement. Pay attention to potential crossover points when the coefficient approaches zero, this may indicate an upcoming breakout or reversal. Wait for confirmation of the trend before entering the trade, and exit when the coefficient forms a max (for calls) or a min (for puts). This is a small tool to help visualize the differe
FREE
ATR Volatility Alerts
Libertas LLC
4.33 (3)
ATR Volatility plots the ATR-based volatility, and triggers alerts when it crosses user-defined upper and lower thresholds (purple and tan lines, please see screenshots). Circles are painted when ATR volatility crosses either above the upper threshold, or below the lower threshold. This is a small tool custom-built by our group, by specific request of one of our customers. We hope you enjoy! Do you have an indicator you would like to see designed? Feel free to send us a message! Click here for m
FREE
EMA Separation plots 2 exponential moving averages, and a fill between them. The fill is colored differently according to an uptrend (short period EMA above long period EMA), or a downtrend (short period EMA below long period EMA). This is a small tool to help visualize the difference between long and short period averages. We hope you enjoy! EMA Separation can also be paired with our free EMA Separation Coefficient Parameters Short period (Default=10): # bars used to calculate short period EM
FREE
The Relative Momentum Index (RMI) was developed by Roger Altman, and introduced in his Feb 1993 article in Technical Analysis of Stocks & Commodities magazine. As its name suggests, Relative Momentum Index adds a momentum component to the traditional RSI, designed to increase reliability by decreasing spurious oscillations between defined overbought and oversold levels. This Relative Momentum Index indicator has 2 components. A change in RMI line color provides a warning signal for an upward or
Two Period RSI + Alerts compares long-term and short-term RSI lines, and plots a fill between them for improved visualization. Fill is colored differently according to an uptrend (short period RSI above long period RSI) or a downtrend (short period RSI below long period RSI). Short-term RSI crossing long-term RSI adds a more robust trend confirmation signal than using single period RSI alone. This is a tool to help visualize and confirm RSI trends. We hope you enjoy! Alerts Email, message, and
Catch major price movements, early in the trend. Alerts you to enter at the likely beginning of a trend, and if it's incorrect, quickly alerts you to exit to limit any loss. Designed to capture large, profitable price movements, with early entrance to maximize your returns. As shown in screenshots, typical behavior is  several quick entrance/exists with small loss , and then  capture of a large trend with high profits .  The   Instantaneous Trend  indicator is a lag-reduced method to detect pri
Laguerre SuperTrend Clouds   adds an Adaptive Laguerre averaging algorithm and alerts to the widely popular SuperTrend indicator. As the name suggests,   Laguerre SuperTrend Clouds (LSC)   is a trending indicator which works best in trendy (not choppy) markets. The SuperTrend is an extremely popular indicator for intraday and daily trading, and can be used on any timeframe. Incorporating Laguerre's equation to this can facilitate more robust trend detection and smoother filters. The LSC uses the
"Wouldn't we all love to reliably know when a stock is starting to trend, and when it is in flat territory? An indicator that would somehow tell you to ignore the head fakes and shakeouts, and focus only on the move that counts?" The Choppiness Index is a non-directional indicator designed to determine if the market is choppy (trading sideways) or not choppy (trading within a trend in either direction). It is an oscillating indicator between -50 (very trendy) and +50 (very choppy). There are man
Choppiness Index
Libertas LLC
5 (1)
"Wouldn't we all love to reliably know when a stock is starting to trend, and when it is in flat territory? An indicator that would somehow tell you to ignore the head fakes and shakeouts, and focus only on the move that counts?" The Choppiness Index is a non-directional indicator designed to determine if the market is choppy (trading sideways) or not choppy (trading within a trend in either direction). It is an oscillating indicator between -50 (very trendy) and +50 (very choppy). There are man
Automate your charting with the All-In-One SRES channel indicator. This is a complete package designed to address 3 questions: (1) when to enter a trade, (2) what is a good exit point, and (3) what is the probabilistic likelihood of success of the trade. Longevity and Flexibility : The All-In-One SRES calculates and charts S upport, R esistance, E xpected range, and a S queeze channel, and is enormously flexible for many trading strategies. Each option is customizable to fit your strategy, and c
"Battles between bulls and bears continue to influence price development long after the combat has ended, leaving behind a messy field that observant technicians can use to manage risk and find opportunities. Apply "trend mirror" analysis to examine these volatile areas, looking for past action to impact the current trend when price turns and crosses those boundaries." - Investopedia.com RSI Mirrors and Reflections is a robust technique using multiple RSI periods, mirrors and reflections based o
Fano Factor is a measure of the dispersion of the probability distribution of Fano noise, named after Ugo Fano, an Italian-American Physicist. Fans has applications in Particle Detection and Neuroscience for describing variability in complex multivariate data. In trading, we have discovered Fano can be used as a 'signal to noise' ratio, and can indicate the strength of price movements (i.e., price movement is greater than predicted by purely statistical measures). Like standard deviation, Fano F
SuperTrend Alerts
Libertas LLC
3 (4)
SuperTrend Alerts adds alerts to the widely popular SuperTrend indicator. As the name suggests, SuperTrend is a trending indicator which works best in trendy (not choppy) markets. SuperTrend is extremely popular for intraday and daily trading, and can be used on any timeframe. Place a call when the price closes above the SuperTrend line, and place a put when the price closes below the SuperTrend line. These crossovers are highlighted by non-repainting up/down arrows. Alerts Email, message and
True Choppiness Direction determines if the market is choppy (trading sideways) or if it is trending, as well as the trend direction and strength (green=up, red=down, grey=no trend) . The underlying algorithm is designed to detect trend movements even in the presence of noisy market data, please see screenshots. Trend strength is indicated by taller or shorter red/green fill. Choppiness index is range-bound between -50 (very trendy) and +50 (very choppy). This is a custom algorithm designed by u
"The VIX Fix is a powerful indicator that detects market bottoms for any asset " The VIX (volatility index) is a ticker symbol of implied volatility of the S&P 500, calculated by the Chicago Board Options Exchange. VIX is a popular measure of market risk, and is one of the best measures of market bottoms that currently exists. Unfortunately, it only exists for the S&P 500... The VIX Fix was published by Larry Williams in 2007, and it synthesizes a VIX volatility index for any asset (not just the
WaveTrend Momentum Oscillator is an upgrade to the popular and easy-to-use WaveTrend Oscillator. The WaveTrend Momentum Oscillator adds a momentum component to the original WaveTrend calculation, in order to provide faster and more accurate entry points during trendy market conditions. Do you prefer the original WaveTrend Oscillator? The WaveTrend Momentum Oscillator allows you to switch between momentum and original WT versions. Both provide valuable information depending on the market conditio
The  Laguerre VIX Trend Extrema   (LVTE)  indicator detects market tops and bottoms. As its name suggests, LVTE is a percentage price oscillator that identifies extreme ranges in market price. How to use:   Buy   when the indicator was in the lower "blue" range for more than 2 candles, and then moves up into grey.   Sell   when the indicator was in the upper "red" range, and then moves down into orange. Please see screenshots for examples! To make it simple, the indicator can show this by paint
Looking for strong trend entrance and exit points of trends? This incorporates volume into price calculations for a fast entry/exit, showing how supply and demand factors are influencing price, and  giving you more insights than the average trader uses. The   Volume Accumulation Trend   indicator is a cumulative indicator that uses both   volume  and   price  to investigate whether an asset is growing or falling. It identifies differences between the price and the volume flow, which lets us kno
"Battles between bulls and bears continue to influence price development long after the combat has ended, leaving behind a messy field that observant technicians can use to manage risk and find opportunities. Apply "trend mirror" analysis to examine these volatile areas, looking for past action to impact the current trend when price turns and crosses those boundaries." RSI Mirrors and Reflections is a robust technique using multiple RSI periods, mirrors and reflections based on RSI values to ind
"The Squeeze indicator attempts to identify periods of consolidation in a market. In general the market is either in a period of quiet consolidation or vertical price discovery. By identifying these calm periods, we have a better opportunity of getting into trades with the potential for larger moves. Once a market enters into a "squeeze," we watch the overall market momentum to help forecast the market direction and await a release of market energy." The Modified TTM Squeeze Indicator is a modi
The  Laguerre VIX Trend Extrema   (LVTE)  indicator detects market tops and bottoms. As its name suggests, LVTE is a percentage price oscillator that identifies extreme ranges in market price. How to use: Buy when the indicator was in the lower "blue" range for more than 2 candles, and then moves up into grey. Sell when the indicator was in the upper "red" range, and then moves down into orange. Please see screenshots for examples! To make it simple, the indicator can show this by painting "dots
Filtro:
Nessuna recensione
Rispondi alla recensione
Versione 1.4 2021.12.01
Upgrade for compatibility with new MT4
Versione 1.3 2017.03.17
V1.3 Improvements:
- Removed "alerts are on" warning popup. Warning is instead written in the indicator description and printed in the Experts tab of the terminal.
- Added UserDefine option to Color Scheme. When selecting this, users can choose their own color schemes.
- Updated the indicator icon.