Truly Volatility
- Indicatori
- Roman Starostin
- Versione: 1.9
- Aggiornato: 27 maggio 2019
Now there is no need to check volatility on third-party websites in order to determine the average movement rage of a certain currency pair.
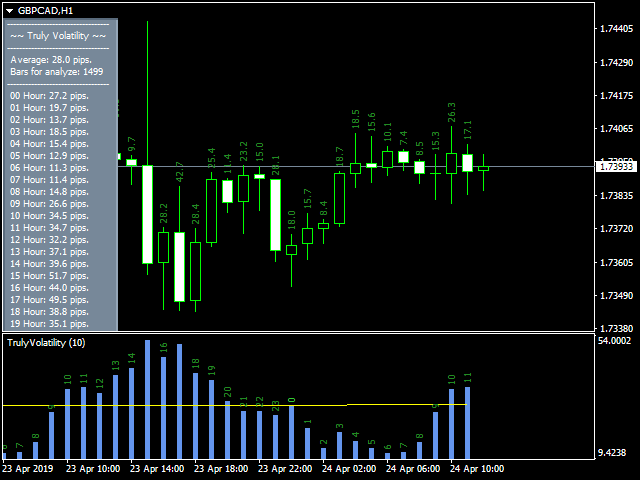
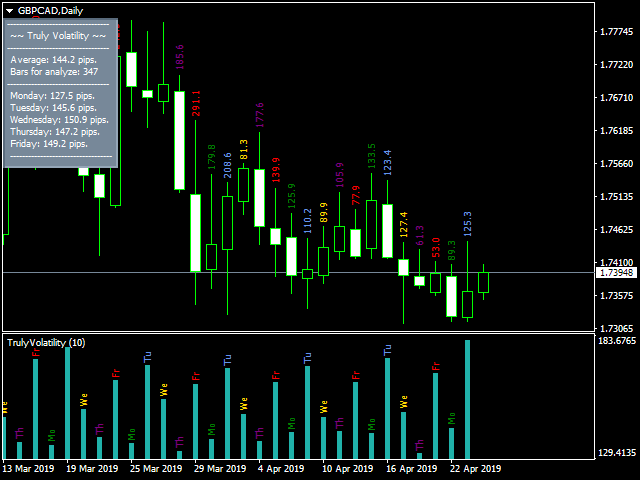
The Truly Volatility indicator is designed for determining volatility for the specified period and is displayed in a separate window as a histogram and line.
If attached to a chart with the Н1 timeframe, the indicator displays the average price movement for each hour (from 0 to 23) based on the history data. On the D1 timeframe it displays the average movement for each specific day of the week. The indicator also draws the total volatility line, calculated as the total length of N candles, divided by the number of candles. The period for analysis is specified in the settings.
Settings
- Calculated over past weeks - period of history data for calculation of volatility, specified in weeks.
- Candle type - candle length calculation type: Body - considers the Open and Close prices, Whole - consider the High and Low prices.
- Display Digits - display 4 or 5-digit point values on the indicator and text labels.
- Show Candle Size and comment - display the information panel and text labels about the size of candles on the chart.
- Show Hours and Day of Week - display the names of days of the week for D1, or the hour for H1 on the histogram.


Respects for its uniqueness!