• Panoramica
  • Recensioni (37)
  • Commenti (195)
  • Novità

FX Volume

4.58

FX Volume è il primo e unico indicatore di volume che offre una visione autentica del sentimento del mercato dal punto di vista del broker.

Fornisce notevoli informazioni sul posizionamento degli operatori istituzionali, come i broker, nel mercato Forex, molto più rapidamente dei rapporti COT.

La visualizzazione di queste informazioni direttamente sul vostro grafico è una soluzione innovativa e rivoluzionaria per il vostro successo nel trading.


Approfittate di dati di mercato unici come:

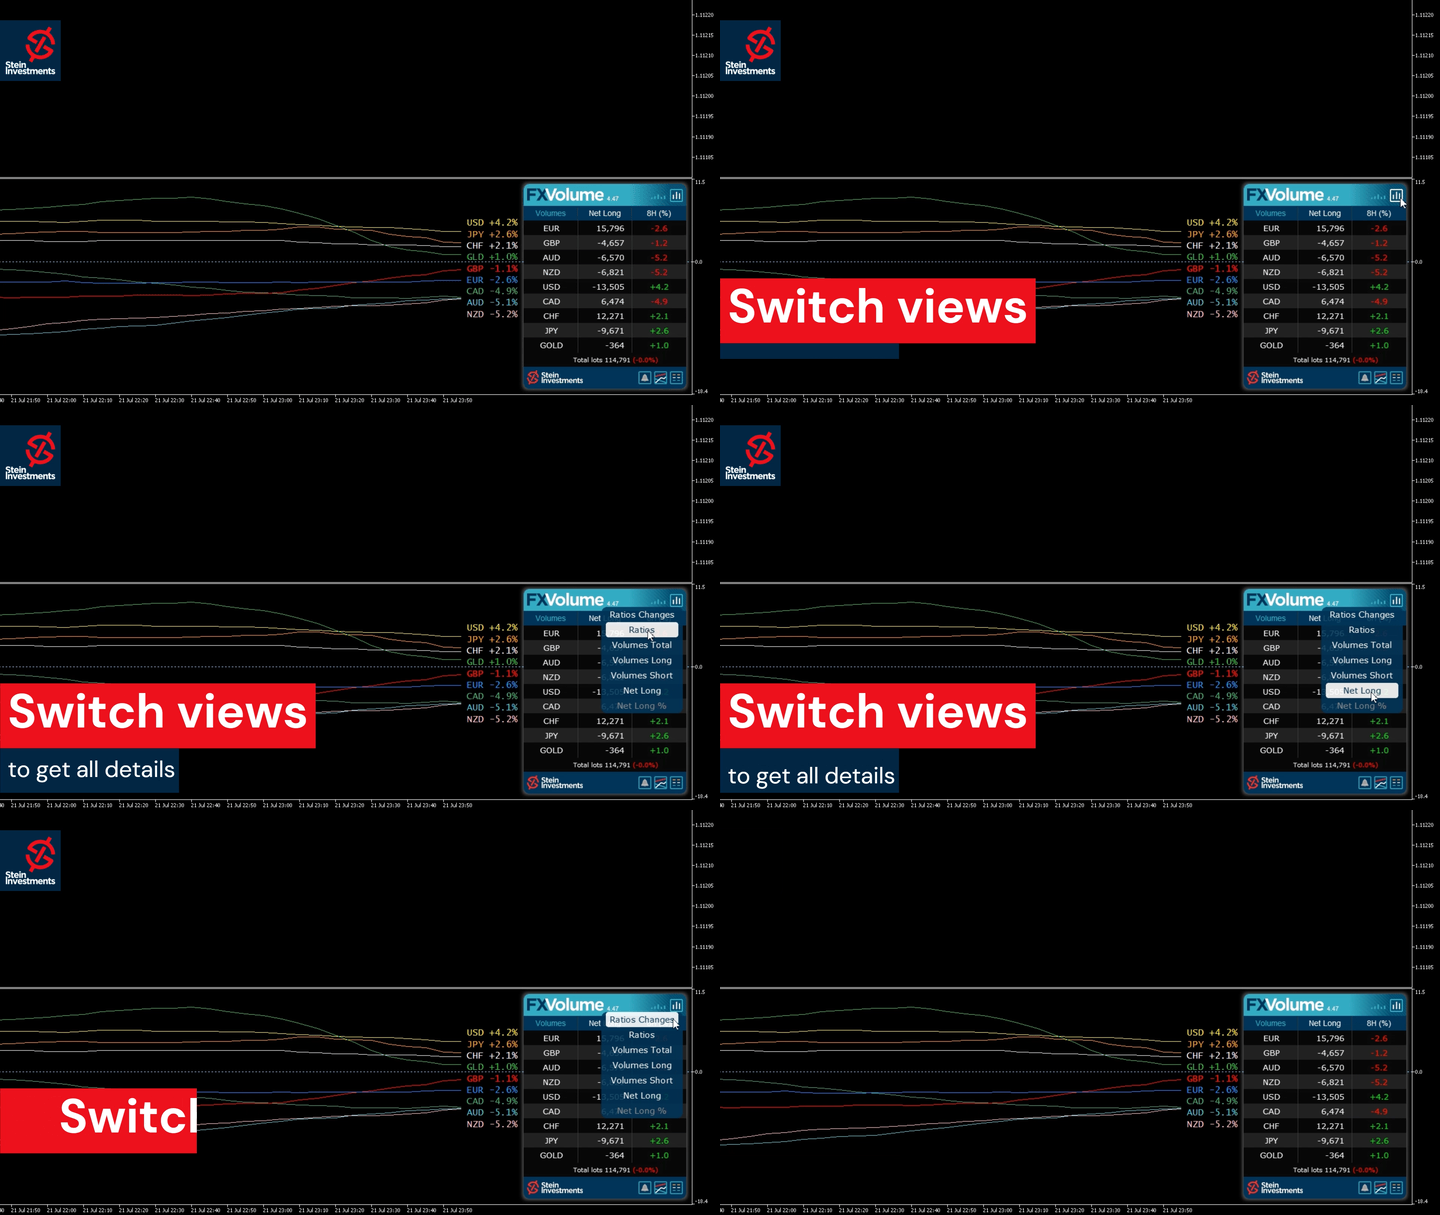
  • I rapporti visualizzano il rapporto percentuale tra posizioni lunghe e corte per le valute.
  • Le variazioni dei rapporti indicano la variazione percentuale dei rapporti lunghi in un intervallo di tempo selezionato.
  • I Volumi totali mostrano il volume combinato degli scambi (lunghi e corti) delle valute in lotti.
  • I volumi long rappresentano il volume scambiato di tutte le posizioni long per le valute.
  • I Volumi Short rappresentano il volume negoziato di tutte le posizioni short delle valute.
  • Net Long indica il volume netto long, ovvero tutte le posizioni long meno tutte le posizioni short in lotti.
  • Net Long Percent riflette la variazione percentuale del volume netto long per le valute.
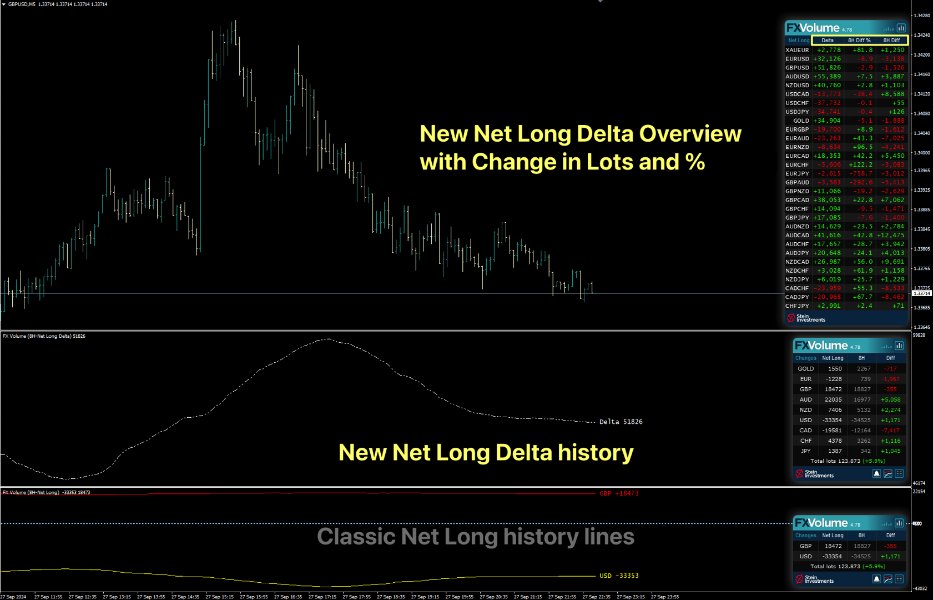
  • Net Long Delta Storia e variazione percentuale per vedere la correlazione diretta tra volume e prezzo.


Ottenere i dati unici sul volume:

  • Aggiungete l'URL https://stein.investments all'elenco degli URL consentiti nelle proprietà del vostro terminale.
  • Installate ed eseguite il nostro gestore di dati SI Connect MT4 su un grafico separato sullo sfondo del vostro terminale.


Link importanti:


Informazioni di base:

Il Forex è un mercato decentralizzato, il che ci ha spinto a innovare, sviluppare una soluzione unica e intraprendere il progetto più complesso finora realizzato per integrare queste preziose informazioni nei nostri grafici.

Da ottobre 2018, i nostri server analizzano e registrano i dati del volume di trading reale provenienti da varie fonti globali. Raccogliamo i dati, monitoriamo le fluttuazioni del volume di trading e calcoliamo un indice per le principali valute di trading sul Forex e per l'oro" e questo è solo l'inizio. In futuro, ci proponiamo di fornire tali informazioni anche per altri strumenti di trading come gli indici e le materie prime.


Come funziona:

Vorrei illustrare nel dettaglio come raccogliamo i volumi di trading effettivi e li presentiamo ai nostri clienti.

Ogni frase è numerata per facilitare la consultazione in caso di domande.

  1. L'apertura di un'operazione di acquisto di 0,2 lotti di EURUSD obbliga il vostro broker ad assumere una posizione di contropartita con una vendita di 0,2 lotti di EURUSD.
  2. Se il vostro broker inoltra l'ordine direttamente al pool di liquidità, un istituto assumerà il ruolo di controparte con uno 0,2 lotti EURUSD SELL.
  3. Il nostro fornitore di dati ci informa di un'operazione BUY di 0,2 lotti EURUSD in corso. Pur essendo anonima, sappiamo che rappresenta una posizione di trading in corso.
  4. Compiliamo e centralizziamo i dati di trading di numerosi utenti, diversi broker e una moltitudine di operazioni, tutte fornite in forma anonima dal nostro fornitore di dati.
  5. Possiamo quindi osservare il posizionamento dei trader al dettaglio su EURUSD: se stanno comprando, vendendo o se la situazione è equilibrata.
  6. Questi dati ci permettono di valutare l'accuratezza del loro giudizio. Verifichiamo se il prezzo dell'UE sale quando la maggior parte dei trader al dettaglio detiene posizioni BUY su EURUSD.
  7. Purtroppo, le loro previsioni sono spesso errate. In genere, i prezzi tendono a muoversi nella direzione esattamente opposta.
  8. Ciò potrebbe essere dovuto al fatto che i principali operatori della controparte (come menzionato ai punti 1 e 2) sono pienamente consapevoli delle posizioni dei commercianti al dettaglio, il che rende più facile per loro spingere i commercianti al dettaglio fuori.
  9. A causa della frequente imprecisione di cui al punto 7, analizziamo le posizioni dei rivenditori e le interpretiamo dal punto di vista dei "grandi".
  10. Ad esempio, se la folla dei rivenditori è all'80% rialzista (BUY) sull'EUR, in FX Volume visualizziamo una posizione all'80% ribassista (SELL), che riflette il punto di vista dei "grandi", in quanto sono loro a detenere la scommessa opposta. Questo è ciò che rende FX Volume eccezionalmente preciso, fornendovi il vantaggio necessario per un trading costantemente redditizio.

Confido che questo chiarisca il nostro processo e vi invito a chiedere se avete altre domande.


Impostazioni dell'indicatore FX Volume

  • Zona DST del broker e spostamento GMT - Controllate lo stato di SI Connect per ottenere le impostazioni corrette per il vostro terminale.
  • Confronto indietro in - Scegliete ore o minuti e definite le unità di seguito per creare approfondimenti individuali
  • Confronta con X unità indietro - Impostare un valore per il confronto tra ora e il punto desiderato nel passato.
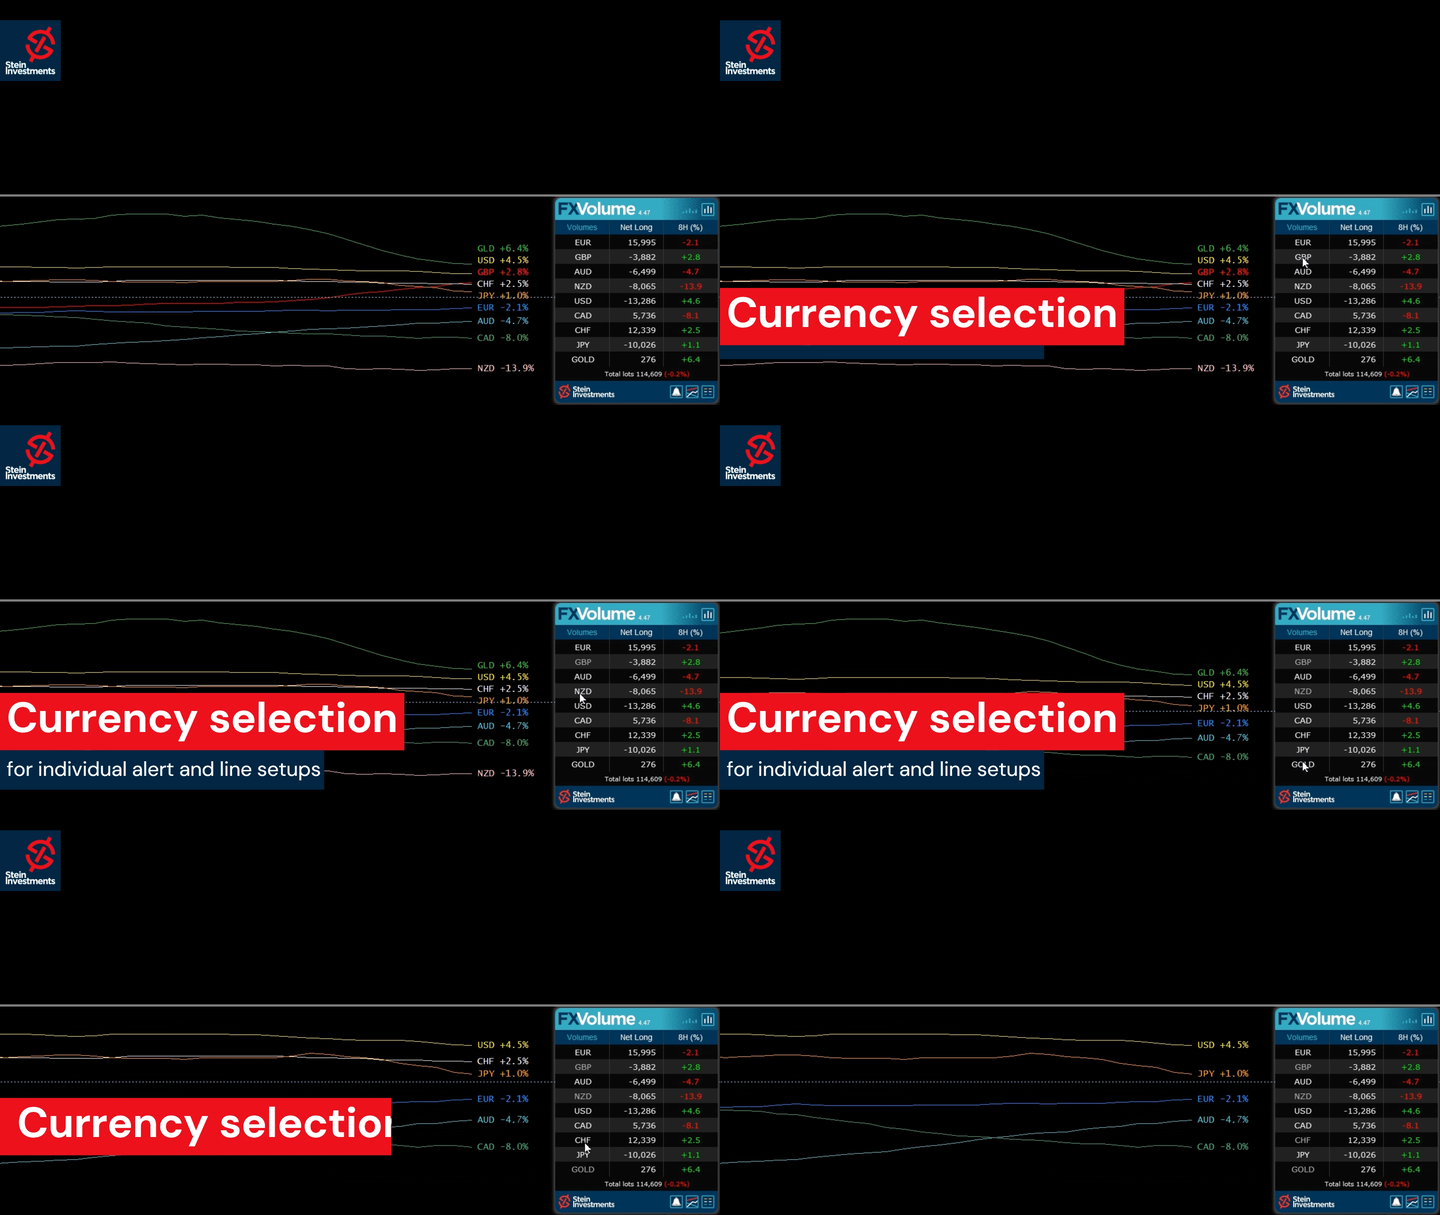
  • Visualizza tutte le righe della cronologia - Impostare su "false" per visualizzare solo le righe della cronologia delle valute relative ai simboli.
  • Valori della cronologia: Scegliere uno dei tanti approfondimenti di mercato esclusivi menzionati sopra
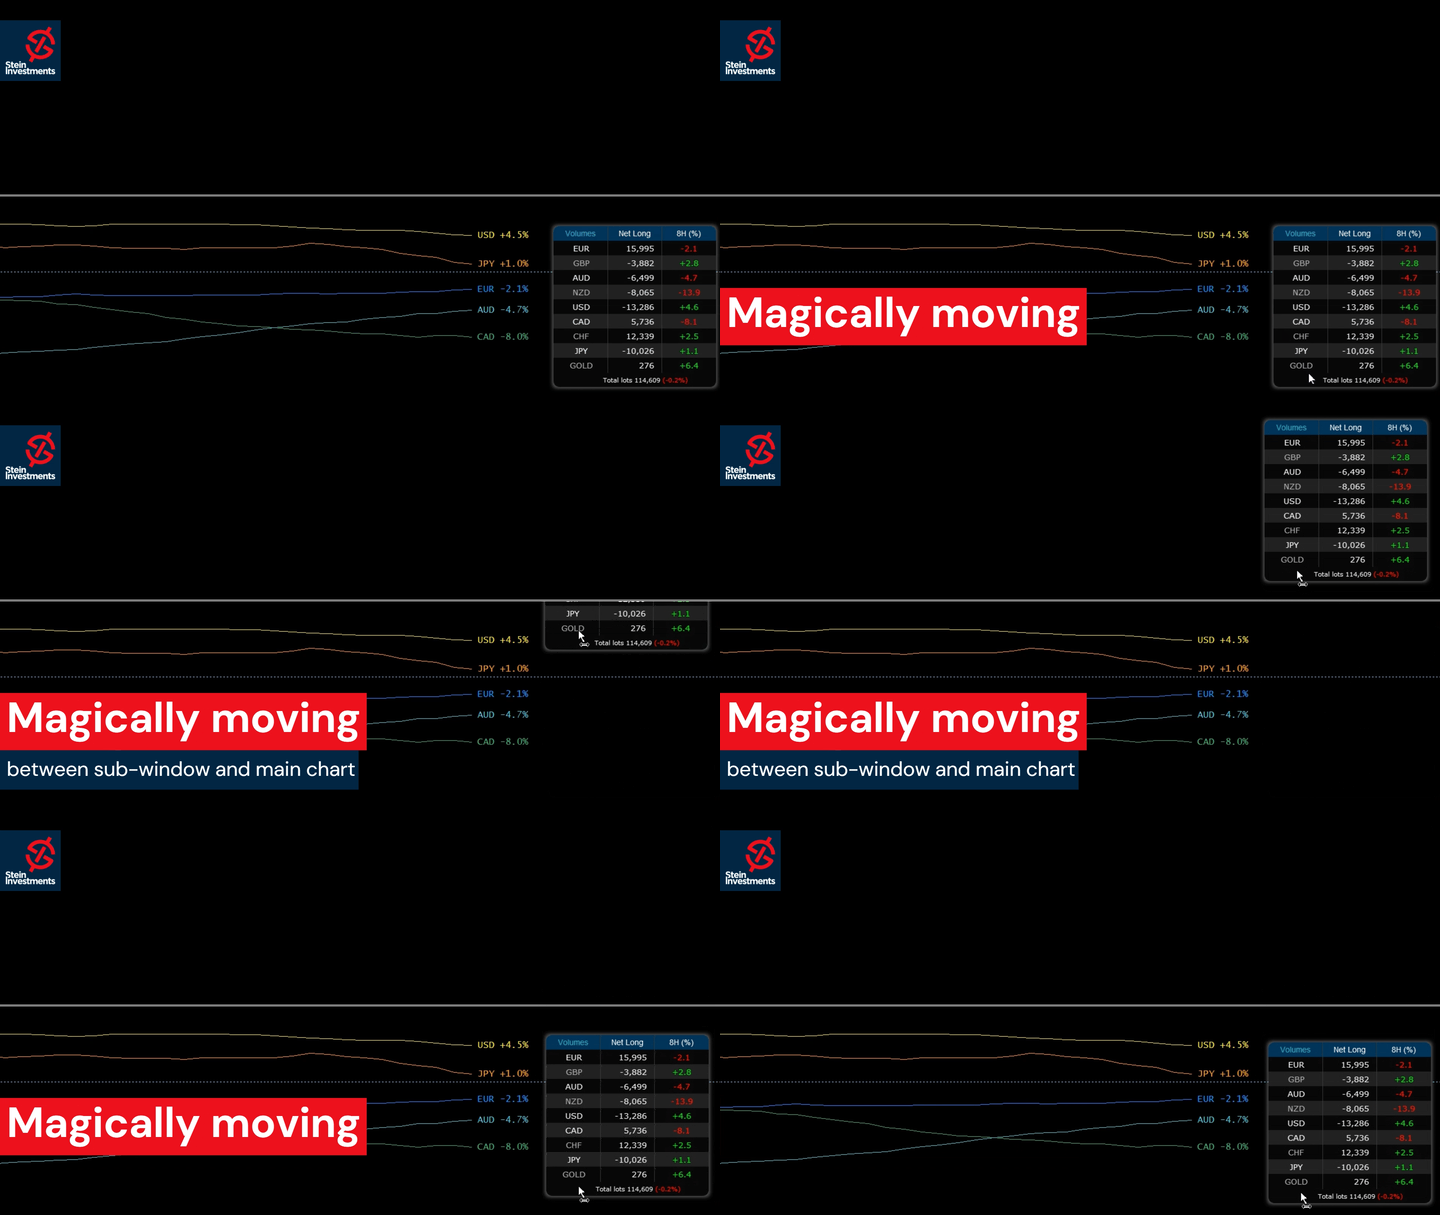
  • Impostazioni per più istanze: Necessario se si desidera combinare più istanze in una sottofinestra.
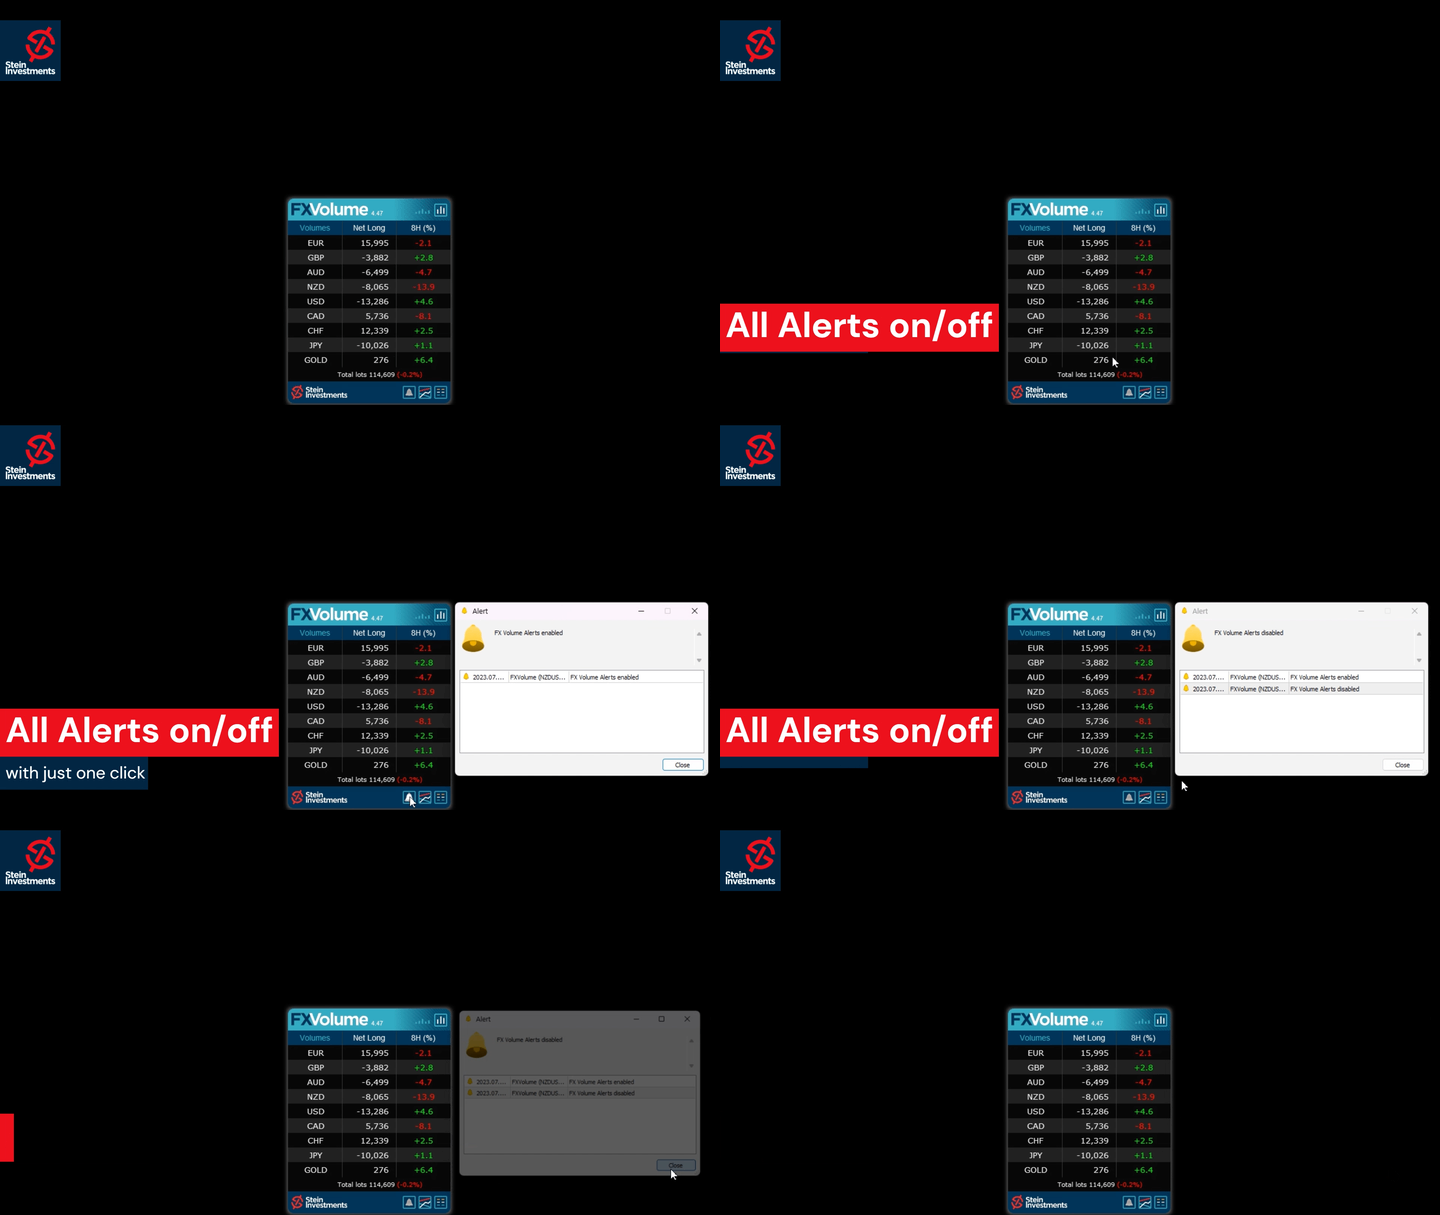
  • Impostazioni degli avvisi: Forniscono numerose opzioni di allarme basate su diversi parametri e soglie.
  • Impostazioni grafiche: Mantenete lo stile predefinito o progettate il vostro stile personale.
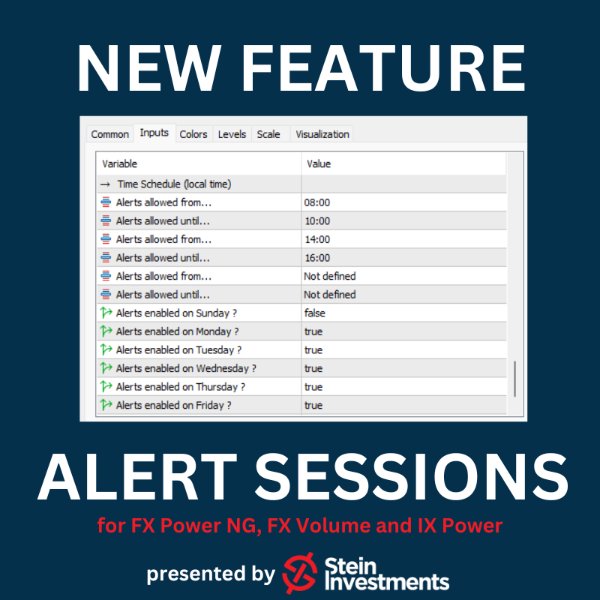
  • Pianificazione: Specificare quando si desidera ricevere gli avvisi e quando no.

Se qualcosa non è chiaro, scriveteci e vi aiuteremo.


Volete diventare un trader forex a 5 stelle sempre redditizio?

Allora inviateci uno screenshot del vostro acquisto e riceverete in cambio un invito personale alla nostra esclusiva chat di trading con oltre 500 membri.


Auguri e buon trading a tutti

Daniel e Alain


Recensioni 37
Kabelo Mataboge
63
Kabelo Mataboge 2024.07.10 18:12 
 

When applied correctly, FX volume is almost 100% accurate in terms of direction. Adding a solid entry strategy has significantly improved my trading win rate. I'm pleased to have found a reliable trading indicator after testing and using over 1,000 repainting, recalculating, and unreliable indicators. Please, Daniel, keep up the excellent work and product.

Ingo Reimann
223
Ingo Reimann 2023.12.21 16:13 
 

The best and most precise product that I have had the pleasure of getting to know in my trading career. I can recommend it to everybody. Since I started using these products, trading has also been working. The support from the developers and the community are also in a class of their own.

3316589p
870
3316589p 2022.08.29 20:34 
 

Hi Daniel, Great indicator used in conjunction with Fx Power, an invite for the the chat group would be appreciated

Prodotti consigliati
Owl smart levels
Sergey Ermolov
4.34 (35)
Versione MT5  |  FAQ L' indicatore Owl Smart Levels   è un sistema di trading completo all'interno dell'unico indicatore che include strumenti di analisi di mercato popolari come i   frattali avanzati di Bill Williams , Valable ZigZag che costruisce   la corretta struttura a onde   del mercato, e i   livelli di Fibonacci che segnano i livelli esatti di entrata nel mercato e luoghi per prendere profitti. Descrizione dettagliata della strategia Istruzioni per lavorare con l'indicatore Consulente-
Noize Absorption Index MT4
Ekaterina Saltykova
5 (1)
Noize Absorption Index - is the manual trading system that measures the difference of pressure between bears forces and bulls forces. Green line - is a noize free index that showing curent situation. Zero value of index shows totally choppy/flat market.Values above zero level shows how powerfull bullish wave is and values below zero measures bearish forces.Up arrow appears on bearish market when it's ready to reverse, dn arrow appears on weak bullish market, as a result of reverse expectation. S
Daily Candle Predictor è un indicatore che prevede il prezzo di chiusura di una candela. L'indicatore è destinato principalmente all'uso sui grafici D1. Questo indicatore è adatto sia per il trading forex tradizionale che per il trading di opzioni binarie. L'indicatore può essere utilizzato come sistema di trading autonomo o può fungere da aggiunta al sistema di trading esistente. Questo indicatore analizza la candela corrente, calcolando alcuni fattori di forza all'interno del corpo della cande
Blahtech Market Profile
Blahtech Limited
4.53 (15)
Was: $249  Now: $99   Market Profile defines a number of day types that can help the trader to determine market behaviour. A key feature is the Value Area, representing the range of price action where 70% of trading took place. Understanding the Value Area can give traders valuable insight into market direction and establish the higher odds trade. It is an excellent addition to any system you may be using. Blahtech Limited presents their Market Profile indicator for the MetaTrader community. Ins
Infinity Trend Pro
Yaroslav Varankin
1 (1)
This is a trend indicator without redrawing Developed instead of the binary options strategy (by the color of the Martingale candlestick) Also works well in forex trading When to open trades (binary options) A signal will appear in the place with a candle signaling the current candle It is recommended to open a deal for one candle of the current timeframe M1 and M5 When a blue dot appears, open a deal up When a red dot appears, open a trade down. How to open trades on Forex. When a signal is rec
Super Reversal Pattern
Parfait Mujinga Ndalika
Super Reversal Pattern Indicator Unlock the power of advanced pattern recognition with our Super Reversal Pattern Indicator. Designed for traders seeking precision and reliability, this indicator identifies one of the most effective reversal patterns in technical analysis, offering a significant edge in your trading strategy. Key Features: Non-Repainting Accuracy: Enjoy the confidence of non-repainting technology. Once a Super Reversal Pattern is detected, it remains static, providing consis
The Th3Eng PipFinite indicator is based on a very excellent analysis of the right trend direction with perfect custom algorithms. It show the true direction and the best point to start trading. With StopLoss point and Three Take Profit points. Also it show the right pivot of the price and small points to order to replace the dynamic support and resistance channel, Which surrounds the price. And Finally it draws a very helpful Box on the left side on the chart includes (take profits and Stop loss
The indicator displays the data of the Stochastic oscillator from a higher timeframe on the chart. The main and signal lines are displayed in a separate window. The stepped response is not smoothed. The indicator is useful for practicing "manual" forex trading strategies, which use the data from several screens with different timeframes of a single symbol. The indicator uses the settings that are identical to the standard ones, and a drop-down list for selecting the timeframe. Indicator Parame
Una delle sequenze numeriche è chiamata "Sequenza di incendi boschivi". È stata riconosciuta come una delle nuove sequenze più belle. La sua caratteristica principale è che questa sequenza evita andamenti lineari, anche quelli più brevi. È questa proprietà che ha costituito la base di questo indicatore. Quando si analizza una serie temporale finanziaria, questo indicatore cerca di rifiutare tutte le possibili opzioni di tendenza. E solo se fallisce, riconosce la presenza di una tendenza e dà il
This is an arrow indicator without a future function,developed based on the most advanced profit trading algorithms.It has the most innovative and advanced dual trend analysis module, as well as the latest and highly effective market trend prediction algorithm.Trends are your friends, and following larger trends can earn the maximum profit in foreign exchange. This indicator helps traders identify current trends and track them. Someone once made a profit of 10 times in a week by relying on it.No
Stepping Trend
Mpendulo Chiliza
The Stepping Trend Indicator     The Steppi ng Trend indicator uses the  average true range  (ATR indicator) in its calculation. This gives you control to set your own average true range period, I set the Default as 10.   Indicator Details. Green Arrow Up: This means you are at the starting point of a new bullish trend, it’s time to buy.   Red  Arrow  Down : This means you are at the starting point of a new  bearish  trend, it’ s time to sell .   What if you miss the Arrow Signal?   No
Heiken Ashi candle chart is an improved version of The Japanese candle chart, which can effectively filter the market "noise" of the Japanese candle chart. It is favored by many traders for its simplicity and intuition. For trend traders, the HA candle chart is a magic tool. Unlike the traditional Japanese candle chart, Heikenashi does not reflect the opening price, high price, low price and closing price of the market. Instead, Heikenashi calculates the value of a single K line in the dominant
Forex Gump
Andrey Kozak
2.4 (5)
Forex Gump is a fully finished semi-automatic trading system. In the form of arrows, signals are displayed on the screen for opening and closing deals. All you need is to follow the instructions of the indicator. When the indicator shows a blue arrow, you need to open a buy order. When the indicator shows a red arrow, you need to open a sell order. Close orders when the indicator draws a yellow cross. In order to get the most effective result, we recommend using the timeframes H1, H4, D1. There
What are Heiken Ashi Candles? Heiken Ashi, derived from the Japanese term 'Heikin Ashi,' translates to average price bars. It's an indicator depicting price bars on a chart. Formula for Heiken Ashi candles: - Heiken Ashi opening price: (previous candle's opening + closing price) / 2 - Closing price Heiken Ashi: (opening + high + low + closing) / 4 - Heiken Ashi peak: Max of high, opening, or closing price - Heiken Ashi bottom price: Min of low, opening, or closing price How to Read Heik
The Penta-O is a 6-point retracement harmonacci pattern which usually precedes big market movements. Penta-O patterns can expand and repaint quite a bit. To make things easier this indicator implements a twist: it waits for a donchian breakout in the right direction before signaling the trade. The end result is an otherwise repainting indicator with a very reliable trading signal. The donchian breakout period is entered as an input. [ Installation Guide | Update Guide | Troubleshooting | FAQ | A
Trade with Gann on your side!! MASTER CIRCLE 360 CIRCLE CHART, originally created by Gann admitted that this is “The Mother of all charts”. It is one of the last studies that this great trader left for us. The numeric tab le is apparently quite simple like all the tables and is based on square numbers, the SQUARE OF 12 and is by evolution, one of the most important square numbers. Here we can find CYCLE, PRICE AND TIME thanks to angles and grades, to show past and future support and resistance.
Intraday Levels shows intraday levels grid for intraday trading Shows a grid for the day levels, gives you a guide to know the trend and to measure intraday trades (stop-loss and take-profit). Parameters are: Levels Mode: Basic mode: Shows highest, lowest and middle levels. Advanced mode: Shows highest, lowest, middle and intermediate levels. Fibonacci mode: Shows session Fibonacci retracements levels. Momentum mode: Shows delayed Advanced levels to identify momentum. Smooth Period (Momentum
Trendiness Index
Libertas LLC
5 (3)
"The trend is your friend" is one of the best known sayings in investing, because capturing large trendy price movements can be extremely profitable. However, trading with the trend is often easier said than done, because many indicators are based on price reversals not trends. These aren't very effective at identifying trendy periods, or predicting whether trends will continue. We developed the Trendiness Index to help address this problem by indicating the strength and direction of price trend
We present you the indicator "Candle closing counter", which will become your indispensable assistant in the world of trading. That’s why knowing when the candle will close can help: If you like to trade using candle patterns, you will know when the candle will be closed. This indicator will allow you to check if a known pattern has formed and if there is a possibility of trading. The indicator will help you to prepare for market opening and market closure. You can set a timer to create a p
Alpha Trend sign has been a very popular trading tool in our company for a long time. It can verify our trading system and clearly indicate trading signals, and the signals will not drift. Main functions: Based on the market display of active areas, indicators can be used to intuitively determine whether the current market trend belongs to a trend market or a volatile market. And enter the market according to the indicator arrows, with green arrows indicating buy and red arrows indicating

For sure, this indicator has become very popular amongst traders. Through coding this indicator will give you the most accurate levels possible for your trading analysis. We have also added in the ability for you to receive alerts when the price breaks above or below a Support or Resistance lines! HOW TO USE The red rectangles represent your resistance/supply zone. The green rectangles represent your support/demand zone.  BONUS FEATURES We coded this indicator with the ability to switch between
Power Renko MT4
Pierce Vallieres
Power Renko is an indicator which plots Renko bricks underneath the chart using a histogram. You can select the brick size and the timeframe of the Renko bricks as well as whether or not to use the close price or the high/low price of the candles. Renko bricks are based on price alone, not time, therefor the Renko bricks will not be aligned with the chart's time. They are extremely useful for trend trading and many different strategies can be formed from them. Buffers are provided allowing you t
TWO PAIRS SQUARE HEDGE METER INDICATOR Try this brilliant 2 pairs square indicator It draws a square wave of the relation between your two inputs symbols when square wave indicates -1 then it is very great opportunity to SELL pair1 and BUY Pair2 when square wave indicates +1 then it is very great opportunity to BUY pair1 and SELL Pair2 the inputs are : 2 pairs of symbols         then index value : i use 20 for M30 charts ( you can try other values : 40/50 for M15 , : 30 for M30 , : 10 for H1 ,
Trading Sessions Advanced
Tumelo Patrick Rakotsoane
4 (1)
Trading Session Advanced This indicator was designed to indicate trading sessions in a chart. It draws boxes for each trading session in different colours. Trading Sessions: - London Session - New York Session - Tokyo Session - Sydney Session Some currencies are best traded during certain trading sessions. - EUR, GBP & CHF currencies have high volatility during London session.  - USD & CAD currencies have high volatility during New York session. - AUD, NZD & JPY currencies have high volatili
Signal trend indicator. Detects the direction of the trend and is coloured accordingly.  Has built in audible and visual alerts when trends change. Can send notifications to your phone or email. Allows Trend and Counter-Trend trading. Works on all timeframes, all currency pairs, metals, indices and cryptocurrencies. Can be used with binary options. Distinctive features No re-drawing; Simple and clear settings; Four types of alerts; Works on all timeframes and all trading tools; Su
Shark Deal Book
Philip Pankaj Suthagar
4 (3)
Term  "shark"  in the business world denotes a high volume investor who just made a good investment in a highly Potential business deal.So, sharks are the ones who make the market move. In our case, if an American shark bought a Japanese company, he/she has to convert American dollars into Japanese yen to make the deal. So, the demand for the Japanese yen will increase sharply. Thus USD/JPY will go short rapidly if the deal was from the shark. Another example, In the case of forex, if fed increa
Market Shaver
Remi Passanello
Rasoio da mercato   Scalper del mercato Questo indicatore fa parte dei sistemi RPTrade Pro Solutions. Market Scalper è un indicatore di tendenza giornaliero che utilizza Price Action, Dynamic Support e Resistances. È progettato per essere utilizzato da chiunque, anche il principiante assoluto nel trading può usarlo. NON ridipinge MAI. Le indicazioni sono date da vicino a vicino. Progettato per essere utilizzato da solo, non sono necessari altri indicatori. Ti dà indicazioni chiare e semplici
TrendPlus
Sivakumar Subbaiya
4 (13)
Trend Plus   Trendplus  Indicator   Time Frame: Suitable for any time frame.  Purpose: Trend Prediction. Blue and red candle indicate the buy and sell call respectively. Buy: When the blue candle is formed buy call is initiated. close the buy trades when the next red candle will formed.   Sell: When the Red candle is formed Sell call is initiated. close the Sell trades when the next blue candle will formed.   Happy trade!!
FREE
Trend Ray
Andriy Sydoruk
The indicator shows the potential trend direction by cyclical-wave dependence. Thus, all the rays of the intersection will be optimal rays, in the direction of which the price is expected to move, taking into account the indicator period. Rays can be used as a direction for potential market movement. But we must not forget that the approach must be comprehensive, the indicator signals require additional information to enter the market.
Matrixs
Andriy Sydoruk
Matrix is a Forex arrow indicator. Displays signals simply and clearly! The arrows show the direction of the transaction, and are colored accordingly, which can be seen in the screenshots. As you can see, trading with such an indicator is easy. I waited for an arrow to appear in the desired direction - I opened a deal. An arrow formed in the opposite direction - closed the deal. The indicator also displays the lines with the help of which the arrow signals are formed, taking into account the int
Gli utenti di questo prodotto hanno anche acquistato
TPSproTREND PrO
Roman Podpora
4.79 (19)
TPSpro TREND PRO   è un indicatore di tendenza che analizza automaticamente il mercato, fornisce informazioni sulla tendenza e sui rispettivi cambiamenti e fornisce segnali per entrare nelle operazioni senza ridisegnare. L'indicatore utilizza ciascuna candela e la analizza separatamente. Si riferisce a vari shock al rialzo o al ribasso. Punto di ingresso preciso per il trading di valute, criptovalute, metalli, azioni e indici! Versione MT5                   Descrizione completa dell'indicatore
Dynamic Forex28 Navigator
Bernhard Schweigert
5 (2)
Dynamic Forex28 Navigator - Lo strumento di trading Forex di nuova generazione. ATTUALMENTE SCONTATO DEL 49%. Dynamic Forex28 Navigator è l'evoluzione dei nostri indicatori popolari di lunga data, che combinano la potenza di tre in uno: Advanced Currency Strength28 Indicator (695 recensioni) + Advanced Currency IMPULSE con ALERT (520 recensioni) + CS28 Combo Signals (Bonus). Dettagli sull'indicatore https://www.mql5.com/en/blogs/post/758844 Cosa offre l'indicatore di forza di nuova generazion
Ultimate Index Advisor è uno strumento avanzato progettato per analizzare i movimenti del mercato con precisione e identificare opportunità di trading in modo dinamico. L'indicatore offre segnali basati su una combinazione di logiche ottimizzate per trend, correzioni e inversioni, rendendolo versatile per vari stili di trading. Con un'interfaccia intuitiva, Ultimate Index Advisor evidenzia punti d'entrata e d'uscita chiari grazie a frecce visibili sul grafico, eliminando l'ambiguità dalle deci
TPSpro RFI Levels
Roman Podpora
4.82 (22)
ISTRUZIONI       RUS   -   INGLESE       Si   consiglia di utilizzare con un indicatore       -       TPSpro   TENDENZA PRO -   Versione MT4         Un elemento chiave nel trading sono le zone o i livelli da cui vengono prese le decisioni di acquisto o vendita di uno strumento di trading. Nonostante i tentativi dei principali attori di nascondere la loro presenza sul mercato, lasciano inevitabilmente delle tracce. Il nostro compito era imparare a identificare queste tracce e interpretarle corre
Connect Indicator
Sukunthakan Ngernbamrung
Connect Indicator is a tool used for connecting indicators between the MQL market and MT4. The connected indicators are made by our group and can be used for other applications, such as sending messages to the Line application or Telegram application. If you have any questions, please don't hesitate to ask us to receive support. Function and indicator buffer Buffer one is the high price of the previous candle. Buffer two is the high price of the previous candle. Usage To connect indicators to fu
Entry Arrow Alerts: Finds market entry opportunities then notifies you via mobile or desktop alerts The key features include: Conservative mode . One entry signal per direction. Ideal for the patient trader looking to capture longer term moves. Aggressive mode . Multiple possible entry signals per direction. Ideal for the active trader looking to capture multiple moves within the same trend. Trigger Line . Price entry line helps cut down on false signals. Display Window . Allows you to instantly
Supply and Demand Dashboard PRO
Bernhard Schweigert
4.8 (20)
Attualmente 20% di sconto! Questo cruscotto è un software molto potente che lavora su più simboli e fino a 9 timeframe. Si basa sul nostro indicatore principale (migliori recensioni: Advanced Supply Demand ).   Il cruscotto offre un'ottima panoramica. Mostra:    Valori filtrati di domanda e offerta, compresa la valutazione della forza delle zone, distanze dei pip da/all'interno delle zone, Evidenzia le zone annidate, Fornisce 4 tipi di allarmi per i simboli scelti in tutti i (9) time-frames
TrendMaestro
Stefano Frisetti
5 (3)
nota: questo indicatore e' per METATRADER4, se vuoi la versione per  METATRADER5 questo e' il link:  https://www.mql5.com/it/market/product/108123 TRENDMAESTRO ver 2.4 TRENDMAESTRO riconosce un nuovo TREND sul nascere, non sbaglia mai. La sicurezza di identificare un nuovo TREND non ha prezzo. DESCRIZIONE TRENDMAESTRO identifica un nuovo TREND sul nascere, questo indicatore prende in esame la volatilita' i volumi ed il momentum per identificare il momento in cui c'e' un'esplosione di uno 
SI PREGA DI LEGGERE LE INFORMAZIONI QUI SOTTO PRIMA DI ACQUISTARE IL PRODOTTO! Apollo Pips PLUS SP è un prodotto unico! È PER CHI VUOLE OTTENERE IL MIO NUOVO INDICATORE "APOLLO PIPS" PIÙ IL BONUS "SUPER PACK" CON ACCESSO A TUTTI I MIEI INDICATORI DI TRADING! Acquistando il prodotto Apollo Pips PLUS SP stai effettivamente acquistando una versione assolutamente nuova del mio indicatore Apollo Pips. Questa versione dell'indicatore ha un algoritmo migliorato e un parametro facile da usare che ti dà
Currently Price 20% OFF ( for unlimited use )   BONUS  AUX VIP Club 2024 : Include  EA Airbag  and  Load Data History  to enhance the performance of this tool to its maximum potential  Click Here to Download Files   ( for users only )   Hello World! Introducing.. SMCpro VIP tool and Indicator for MetaTrader 4, designed to revolutionize your trading experience with the ICT Smart Money Concept. This system is meticulously crafted to empower traders with advanced insights and precision in
Line Magnit
Aleksey Trenin
The LineMagnit Indicator for MT4 is a highly precise tool that builds support and resistance levels which magnetically attract prices. This feature allows traders to easily determine the most probable entry and exit points in the market, as well as identify the market's directional forces, as levels are based on capital inflows into the instrument. Equipped with an intuitively understandable graphical interface, the LineMagnit Indicator enables users to quickly locate and analyze support and res
TheStrat Monitor
Robert Gerald Wood
3 (2)
If you've not already learnt about The Strat trading strategy , go google it now. I promise it won't be a waste of your time, and you will likely learn some new tricks whether you use it or not. OK, so now you know what TheStrat is, you will be able to understand what this indicator can do for you. Key Features In short, the Indicator will: Show Timeframe Continuity for all supported timeframes Supports two timeset views, Day trader and Swing trader Show when Full Timeframe Continuity is in pl
Enigmera
Ivan Stefanov
5 (3)
ENIGMERA: Il cuore del mercato https://www.enigmera.com Introduzione Questo indicatore e sistema di trading rappresenta un approccio straordinario ai mercati finanziari. ENIGMERA utilizza i cicli frattali per calcolare con precisione i livelli di supporto e resistenza. Mostra l'autentica fase di accumulazione e fornisce direzione e obiettivi.  Un sistema che funziona sia in un trend che in una correzione.  Come funziona? ENIGMERA è composto da tre linee: la linea di supporto/resistenza, la
NAM Order Blocks
NAM TECH GROUP, CORP.
5 (1)
MT4 Multi-timeframe Order Blocks detection indicator. Features - Fully customizable on chart control panel, provides complete interaction. - Hide and show control panel wherever you want. - Detect OBs on multiple timeframes. - Select OBs quantity to display. - Different OBs user interface. - Different filters on OBs. - OB proximity alert. - ADR High and Low lines. - Notification service (Screen alerts | Push notifications). Summary Order block is a market behavior that indicates order collection
RelicusRoad Pro
Relicus LLC
4.64 (102)
Ora $ 147 (aumentando a $ 499 dopo alcuni aggiornamenti) - account illimitati (PC o MAC) Manuale utente di RelicusRoad + Video di formazione + Accesso al gruppo Discord privato + Stato VIP UN NUOVO MODO DI GUARDARE IL MERCATO RelicusRoad è l'indicatore di trading più potente al mondo per forex, futures, criptovalute, azioni e indici, fornendo ai trader tutte le informazioni e gli strumenti di cui hanno bisogno per rimanere redditizi. Forniamo analisi tecniche e piani di trading per aiuta
Gold Channel is a volatility-based indicator, developed with a specific timing algorithm for the XAUUSD pair, which consists of finding possible corrections in the market. This indicator shows two outer lines, an inner line (retracement line) and an arrow sign, where the theory of the channel is to help identify overbought and oversold conditions in the market. The market price will generally fall between the boundaries of the channel. If prices touch or move outside the channel it is a tra
The Stochastic Basket Currency Strenght  brings the Stochastic indicator to a new level.  Expanding the boundaries of TimeFrames and mono-currency analysis, the SBCS take the movements of each currency that composes the cross and confront them in the whole basket of 7 crosses.  The indicator works with any combination of AUD, CAD, CHF, EUR, GBP, JPY, NZD, USD pairs and with full automation takes in account every stochastic value (main line) for the selected Time Frame.  After that, the indicator
Attualmente 20% di sconto! La soluzione migliore per ogni principiante o trader esperto! Questo software per cruscotti funziona su 28 coppie di valute. Si basa su 2 dei nostri indicatori principali (Advanced Currency Strength 28 e Advanced Currency Impulse). Offre un'ottima panoramica dell'intero mercato Forex. Mostra i valori di forza delle valute avanzate, la velocità di movimento delle valute e i segnali per 28 coppie Forex in tutti i (9) timeframe. Immaginate come migliorerà il vostro t
Vi presentiamo ON Trade Waves Patterns Harmonic Elliot Wolfe, un indicatore avanzato progettato per rilevare vari tipi di pattern sul mercato utilizzando metodi sia manuali che automatici. Ecco come funziona: Pattern Armonici: Questo indicatore è in grado di individuare pattern armonici che appaiono sul vostro grafico. Questi pattern sono fondamentali per i trader che praticano la teoria del trading armonico, come descritta nel libro di Scott Carney "Harmonic Trading vol 1 & 2". Che li disegniat
(Currently 30% OFF) Before reading the description of this indicator, I just want to introduce to you following concept Moving Average Line - Typical moving average which is based on one chart alone.  Currency Strength Line - The moving average of a certain pair in which the strength is based on 28 pairs. Can be said as the real moving average line. Moving Average indeed is one of the most popular indicator which almost every trader use. Currency Strength Meter is also a trend indicator whic
How to use Pair Trading Station Pair Trading Station is recommended for H1 time frame and you can use it for any currency pairs. To generate buy and sell signal, follow few steps below to apply Pair Trading Station to your MetaTrader terminal. When you load Pair Trading Station on your chart, Pair Trading station will assess available historical data in your MetaTrader platforms for each currency pair. On your chart, the amount of historical data available will be displayed for each currency pai
Questo indicatore è un indicatore per l'analisi automatica delle onde perfetto per il trading pratico! Caso... Nota:   non sono abituato a usare nomi occidentali per la classificazione delle onde a causa dell'influenza della convenzione di denominazione di Tang Lun (Tang Zhong Shuo Zen), ho chiamato l'onda base come   penna   e la banda dell'onda secondaria come   segmento   At allo stesso tempo, il segmento ha la direzione del trend. La denominazione   è principalmente segmento di trend   (qu
Jeslyn
Justine Kelechi Ekweh
Questo è un sistema multiuso che si adatta sia ai trader manuali Forex sia como sistema scalper o una strategia per ottenere uno slancio molto forte, trader di opzioni binarie o per essere utilizzato dagli EA universali nel trading di automazione. Jeslyn è una strategia basata su anni di ricerca e si concentra su una particolare strategia di azione dei prezzi. Potrebbe sembrare un semplice indicatore a freccia, ma ha algoritmi sofisticati e logici. Non trae i suoi calcoli da altri indicato
Bomb Bank Signal
Igor Pereira Calil
5 (1)
Segnale bancario bomba: il tuo indicatore di fiducia in MetaTrader 4 Bomb Bank Signal è un potente indicatore per MetaTrader 4, progettato per identificare le tendenze più rilevanti nel mercato finanziario. Se cerchi uno strumento che anticipi con precisione i movimenti, la Bomb Bank è l'alleato di cui hai bisogno. Come funziona: Questo indicatore combina tre metodi distinti – analisi del volume, chiusura delle candele e trend simmetrico – per rilevare e segnalare opportunità di acquisto
SR arrows liquid lines
Teresinha Moraes Correia
In the fifth update , the indicator now aims to predict the direction of the next candle, issuing a buy or sell arrow precisely when the conditions are met. Since its first version, which showed support and resistance levels on the chart, up to the current version 5, many improvements have been made. One of the key changes is the removal of visual support and resistance levels to prevent memory overload. This is no longer necessary, as arrows are now issued when the price is near or touches t
TPA True Price Action indicator reveals the true price action of the market makers through 100% non-repainting signals (except early signals mode) strictly at the close of a candle! TPA shows entries and re-entries, every time the bulls are definitely stronger than the bears and vice versa. Not to confuse with red/green candles. The shift of power gets confirmed at the earliest stage and is ONE exit strategy of several. There are available now two free parts of the TPA User Guide for our custo
Trend Oscillator: Identificazione Fluida e Affidabile del Trend di Mercato Trend Oscillator è un indicatore avanzato per MT4 progettato per assistere i trader nell'identificare con precisione la direzione del trend e i suoi potenziali punti di inversione. Grazie a una rappresentazione visiva intuitiva, questo indicatore mostra chiaramente i momenti in cui il mercato è in trend rialzista o ribassista, semplificando l'analisi e migliorando la lettura del grafico. È adatto per una vasta gamma di me
MR Reversal Patterns 4
Sergey Khramchenkov
5 (2)
In the "Masters of Risk" trading system, one of the main concepts is related to places where markets change direction. In fact, this is a change in priority and a violation of the trend structure at the extremes of the market, where supposedly there are or would be stop-losses of "smart" participants who are outside the boundaries of the accumulation of volume. For this reason, we call them "Reversal Patterns" - places with a lot of weight for the start of a new and strong trend. Some of the imp
PipTick VSA MT4
Michal Jurnik
1 (2)
The   Volume Spread Analysis indicator   is based on the original Volume Spread Analysis method. It was designed for quick and easy recognition of VSA patterns. Even though this indicator looks very simple, it is the most sophisticated tool we've ever made. It is a really powerful analytical tool that generates very reliable trading signals. Because it is very user-friendly and understandable, it is suitable for every type of trader, regardless of his experience. What is VSA? VSA - Volume Spr
Volume by Price MT4
Brian Collard
4.6 (10)
The Volume by Price Indicator for MetaTrader 4 features Volume Profile and Market Profile TPO (Time Price Opportunity). Volume and TPO histogram bar and line charts. Volume Footprint charts. TPO letter and block marker collapsed and split structure charts. Static, dynamic and flexible range segmentation and compositing methods with relative and absolute visualizations. Session hours filtering and segment concatenation with Market Watch and custom user specifications. Graphical layering, positio
Altri dall’autore
Custom Alerts MT5
Daniel Stein
5 (2)
Custom Alerts è un versatile strumento di monitoraggio multi-mercato che identifica setup promettenti su tutte le otto principali valute (USD, CAD, GBP, EUR, CHF, JPY, AUD e NZD), nonché sull'ORO (XAU), su tutte le 28 coppie Forex e ORO basate su queste valute e su un massimo di sette indici come US30, UK100, WTI, Bitcoin, ecc. È completamente personalizzabile. Lo strumento raccoglie i dati dai nostri indicatori FX Power, FX Volume e IX Power e notifica gli eventi significativi.   Prima di in
FX Power MT5 NG
Daniel Stein
4.75 (8)
FX Power MT5 NG rappresenta la versione avanzata del popolare misuratore di forza delle valute, FX Power, che ha avuto successo nel mercato mql5 per oltre otto anni. Questo misuratore di forza di nuova generazione conserva tutte le caratteristiche apprezzate nell'FX Power originale e aggiunge: Analisi della forza di ORO/XAU Risultati di calcolo più precisi Periodi di analisi configurabili Un limite di calcolo personalizzabile per migliorare le prestazioni Impostazioni speciali per istanze mul
FX Power MT4 NG
Daniel Stein
5 (14)
FX Power MT4 NG rappresenta la versione avanzata del popolare misuratore di forza delle valute, FX Power, che ha avuto successo nel mercato mql5 per oltre otto anni. Questo misuratore di forza di nuova generazione conserva tutte le caratteristiche apprezzate nell'FX Power originale e aggiunge: Analisi della forza di ORO/XAU Risultati di calcolo più precisi Periodi di analisi configurabili Un limite di calcolo personalizzabile per migliorare le prestazioni Impostazioni speciali per istanze mul
FX Volume MT5
Daniel Stein
4.93 (14)
FX Volume è il primo e unico indicatore di volume che offre una visione autentica del sentimento del mercato dal punto di vista del broker. Fornisce notevoli informazioni sul posizionamento degli operatori istituzionali, come i broker, nel mercato Forex, molto più rapidamente dei rapporti COT. La visualizzazione di queste informazioni direttamente sul vostro grafico è una soluzione innovativa e rivoluzionaria per il vostro successo nel trading. Approfittate di dati di mercato unici come: I ra
Custom Alerts MT4
Daniel Stein
5 (1)
Custom Alerts è un versatile strumento di monitoraggio multi-mercato che identifica setup promettenti su tutte le otto principali valute (USD, CAD, GBP, EUR, CHF, JPY, AUD e NZD), nonché sull'ORO (XAU), su tutte le 28 coppie Forex e ORO basate su queste valute e su un massimo di sette indici come US30, UK100, WTI, Bitcoin, ecc. È completamente personalizzabile. Lo strumento raccoglie i dati dai nostri indicatori FX Power, FX Volume e IX Power e notifica gli eventi significativi.   Prima di in
FX Levels è un indicatore di supporto e resistenza eccezionalmente accurato che fonde il tradizionale metodo Lighthouse con un approccio dinamico innovativo, funzionando perfettamente su tutti i simboli di trading. Si tratta di coppie di valute, indici, azioni o materie prime. FX Levels identifica i punti di inversione e li visualizza sul grafico, che possono essere utilizzati come obiettivi di profitto nelle vostre attività di trading. Nello sviluppo di FX Levels, abbiamo sfruttato la nostra v
IX Power MT4
Daniel Stein
4.67 (6)
IX Power porta finalmente l'imbattibile precisione di FX Power ai simboli non-Forex. Determina con precisione l'intensità delle tendenze a breve, medio e lungo termine dei vostri indici preferiti, azioni, materie prime, ETF e persino criptovalute. Potete analizzare tutto ciò che il vostro terminale ha da offrire. Provatelo e sperimentate come il vostro tempismo migliori significativamente durante il trading. Caratteristiche principali di IX Power Risultati di calcolo precisi al 100% e n
IX Power MT5
Daniel Stein
4.17 (6)
IX Power   porta finalmente l'imbattibile precisione di FX Power ai simboli non-Forex. Determina con precisione l'intensità delle tendenze a breve, medio e lungo termine dei vostri indici preferiti, azioni, materie prime, ETF e persino criptovalute. Potete   analizzare tutto ciò che   il vostro terminale ha da offrire. Provatelo e sperimentate come   il vostro tempismo migliori significativamente   durante il trading. Caratteristiche principali di IX Power Risultati di calcolo precisi al
FX Trend
Daniel Stein
4.8 (94)
Vuoi diventare un trader forex a 5 stelle costantemente redditizio? 1. Leggi la descrizione di base del nostro semplice sistema di trading   e il  suo importante aggiornamento della strategia nel 2020 2. Invia uno screenshot del tuo acquisto per ottenere il tuo invito personale alla nostra esclusiva chat di trading FX Trend mostra la direzione della tendenza, la durata, l'intensità e la valutazione della tendenza risultante per tutti i time frame in tempo reale. Vedrai a colpo d'occhio in qu
Taurus MT5
Daniel Stein
5 (1)
Taurus rappresenta il culmine degli sforzi dedicati a perfezionare la già efficace strategia di Mean Reversion, sfruttando i nostri esclusivi dati sui volumi di trading reali. Il sistema negozia ogni simbolo utilizzando le sue impostazioni migliori, fornendo un eccezionale rapporto rischio/rendimento e un'esperienza di trading equilibrata e priva di stress per i suoi utenti. Fatti chiave Strategia di mean reversion basata su dati unici di volume reale Gestione seria del rischio senza griglie, m
FX Trend MT5
Daniel Stein
4.63 (32)
Vuoi diventare un trader forex a 5 stelle costantemente redditizio? 1.   Leggi la descrizione di base del nostro semplice   sistema di   trading   e il  suo importante aggiornamento della strategia nel 2020 2.   Invia uno screenshot del tuo acquisto per ottenere il tuo invito personale alla nostra esclusiva chat di trading FX Trend   mostra la direzione della tendenza, la durata, l'intensità e la valutazione della tendenza risultante per tutti i time frame in tempo reale. Vedrai a colpo d'occ
Vuoi diventare un trader forex a 5 stelle costantemente redditizio? 1. Leggi la descrizione di base del nostro semplice sistema di trading e  il  suo importante aggiornamento della strategia nel 2020 2. Invia uno screenshot del tuo acquisto per ottenere il tuo invito personale alla nostra esclusiva chat di trading Questo Trade Manager è l'aggiunta ideale per tutti gli utenti FX Trend che amano utilizzare una gestione completamente automatizzata delle operazioni. Rileva immediatamente le tu
Trade Manager MT5
Daniel Stein
4.33 (3)
Vuoi diventare un trader forex a 5 stelle costantemente redditizio? 1.   Leggi la descrizione di base del nostro semplice   sistema di   trading   e  il  suo importante aggiornamento della strategia nel 2020 2.   Invia uno screenshot del tuo acquisto per ottenere il tuo invito personale alla nostra esclusiva chat di trading Questo Trade Manager   è l'aggiunta ideale per tutti gli utenti   FX Trend   che amano utilizzare una gestione completamente automatizzata delle operazioni. Rileva immed
Taurus MT4
Daniel Stein
Taurus rappresenta il culmine degli sforzi dedicati a perfezionare la già efficace strategia di Mean Reversion, sfruttando i nostri esclusivi dati sui volumi di trading reali. Il sistema negozia ogni simbolo utilizzando le sue impostazioni migliori, fornendo un eccezionale rapporto rischio/rendimento e un'esperienza di trading equilibrata e priva di stress per i suoi utenti. Fatti chiave Strategia di mean reversion basata su dati unici di volume reale Gestione seria del rischio senza griglie, m
Crosshair è uno strumento fantastico che semplifica la nostra analisi del grafico portando le candele dei prezzi perfettamente in linea con i valori degli indicatori nelle sottofinestre. È possibile attivarlo e disattivarlo tramite una singola pressione della "C" della vostra tastiera, e fornisce una modalità righello per misurazioni precise che può essere attivata e disattivata tramite il tasto "R" della vostra tastiera. Guardate il nostro breve video tutorial incorporato qui sotto per ved
Crosshair
Daniel Stein
Crosshair è uno strumento fantastico che semplifica la nostra analisi del grafico portando le candele dei prezzi perfettamente in linea con i valori degli indicatori nelle sottofinestre. È possibile attivarlo e disattivarlo tramite una singola pressione della "C" della vostra tastiera, e fornisce una modalità righello per misurazioni precise che può essere attivata e disattivata tramite il tasto "R" della vostra tastiera. Guardate il nostro breve video tutorial incorporato qui sotto per ved
SI Connect MT5
Daniel Stein
5 (3)
SI Connect è un'utility che stabilisce la connessione ai nostri server per utilizzare FX Volume o i sistemi di trading SIEA. Istruzioni tecniche per preparare il vostro terminale all'uso di SI Connect Consentire le richieste web e inserire https://stein.investments nell'elenco degli URL consentiti in Opzioni terminale -> Sottocategoria Expert Advisors . Hai bisogno di una sola istanza EA in esecuzione per ogni terminale, ma deve funzionare costantemente in background per prendere gli ultimi da
FREE
SI Connect
Daniel Stein
5 (1)
SI Connect è un'utility che stabilisce la connessione ai nostri server per utilizzare FX Volume o i sistemi di trading SIEA. Istruzioni tecniche per preparare il vostro terminale all'uso di SI Connect Consentire le richieste web e inserire https://stein.investments nell'elenco degli URL consentiti in Opzioni terminale -> Sottocategoria Expert Advisors . Hai bisogno di una sola istanza EA in esecuzione per ogni terminale, ma deve funzionare costantemente in background per prendere gli ultimi da
FREE
SIEA Zen MT4
Daniel Stein
SIEA ZEN - major update   Live signals We recommend using the SIEA MT5 versions to run realistic real-tick multi-symbol backtest. TRADING STYLE SIEA ZEN   trades all 28 trading pairs based on the 8 major currencies, USD, CAD, EUR, CHF, GBP, AUD, NZD, and JPY. Our unique volume analysis determines market imbalance and how intense they are to spot reverse entry opportunities. SIEA ZEN  closes all its positions at the end of every month and starts a new cycle at the beginning of the ne
SIEA PRO NG è la nuova generazione di SIEA PRO ed è completamente diversa da tutti i precedenti EA della nostra azienda. I prezzi indicati sono prezzi scontati per il lancio sul mercato di SIEA PRO NG! Utilizzare la versione MT5 di SIEA PRO NG per eseguire un backtest multi-simbolo in real-tick. I fatti principali in sintesi negozia una strategia di mean reversion basato su 5 anni completi di dati unici di volume reale ogni operazione è dotata di uno stop loss e di un take profit fissi la dura
SIEA Zen
Daniel Stein
4 (4)
SIEA ZEN - major update   Default risk live signal     Dynamic risk live signal TRADING STYLE SIEA ZEN trades all 28 trading pairs based on the 8 major currencies, USD, CAD, EUR, CHF, GBP, AUD, NZD, and JPY. Our unique volume analysis determines market imbalance and how intense they are to spot reverse entry opportunities. SIEA ZEN  closes all its positions at the end of every month and starts a new cycle at the beginning of the next month. In this way, we'll achieve an awesome
SIEA Pro MT5 NG
Daniel Stein
4.5 (2)
SIEA PRO NG è la nuova generazione di SIEA PRO ed è completamente diversa da tutti i precedenti EA della nostra azienda. I prezzi indicati sono prezzi scontati per il lancio sul mercato di SIEA PRO NG! I fatti principali in sintesi negozia una strategia di mean reversion basata su 5 anni completi di dati unici di volume reale ogni operazione è corredata da uno stop loss e da un take profit fissi la durata media dell'operazione è inferiore alle 48 ore molte opzioni per la messa a punto individ
Filtro:
Kabelo Mataboge
63
Kabelo Mataboge 2024.07.10 18:12 
 

When applied correctly, FX volume is almost 100% accurate in terms of direction. Adding a solid entry strategy has significantly improved my trading win rate. I'm pleased to have found a reliable trading indicator after testing and using over 1,000 repainting, recalculating, and unreliable indicators. Please, Daniel, keep up the excellent work and product.

Daniel Stein
95097
Risposta dello sviluppatore Daniel Stein 2024.07.10 21:51
Dear Kabelo, thank you so much for this wonderful feedback. It's highly appreciated. 🙏🙂
Ingo Reimann
223
Ingo Reimann 2023.12.21 16:13 
 

The best and most precise product that I have had the pleasure of getting to know in my trading career. I can recommend it to everybody. Since I started using these products, trading has also been working. The support from the developers and the community are also in a class of their own.

Daniel Stein
95097
Risposta dello sviluppatore Daniel Stein 2023.12.21 16:27
Dear Ingo, thank you very much for your outstanding feedback. It's highly appreciated, and we're more than happy having members like you in our trading group. 🙂
Tim Eubanks
5762
Tim Eubanks 2023.08.31 02:51 
 

Very ineffective tool!

Daniel Stein
95097
Risposta dello sviluppatore Daniel Stein 2023.08.31 07:31
And for me, it's the most efficient tool because it tells me exactly when it's worth looking at the market.
If you like to know how I use FX Volume for my daily manual trading, I suggest taking a look at my Volume Power description at https://www.mql5.com/en/blogs/post/753806 You can also subscribe to our Morning Briefing channel to get daily updates, details and screenshots at https://www.mql5.com/en/channels/morningbriefing
Both help to get a better understanding of how to work with FX Volume.
Juan Chacon
1229
Juan Chacon 2022.11.16 21:16 
 

I bought it twice and it was a waste of time and money, please do not spend your money, my advice is to use stop loss and exceed the profit ratio.

Daniel Stein
95097
Risposta dello sviluppatore Daniel Stein 2023.08.25 19:41
Dear Juan, I don't understand how Volume is related to using a stop loss. And why did you never raise any questions about how to use this kind of real-market data? I recommend taking a look at my Volume Power description at https://www.mql5.com/en/blogs/post/753806 which explains in all details how I use FX Volume for trading. You can also subscribe to our Morning Briefing channel to get daily updates, details and screenshots at https://www.mql5.com/en/channels/morningbriefing And finally, we do have FX Volume info channel on Telegram at https://t.me/SI_FX_Volume to understand in-depth what FX Volume is about
3316589p
870
3316589p 2022.08.29 20:34 
 

Hi Daniel, Great indicator used in conjunction with Fx Power, an invite for the the chat group would be appreciated

Daniel Stein
95097
Risposta dello sviluppatore Daniel Stein 2022.08.29 20:54
Thanks a lot for your positive feedback. I sent you an invitation via private message. Best regards, Daniel
wuzzy66
922
wuzzy66 2022.07.02 09:41 
 

Another excellent product from Daniel who is the creator this indicator lets you make informed Decision ASAP when you know the volume of the trade is been concentrated on tried it on Gold excellent it showed be that there was more volume on the Dollar than Gold and took straight a sell position which paid off no more guess work with this indicator combing it other tools such as the FX power

Daniel Stein
95097
Risposta dello sviluppatore Daniel Stein 2022.07.02 18:18
Thanks a lot for your detailed review and excellent feedback. It's highly appreciated.👍
Carlos Alexandre Ribeiro Da Silva
376
 

Excellent indicator, I resubscribed it because it is not the entry trigger, but the "certainty" of the market direction. It brings you the peace of mind of following the big players. Not to mention the support of all Daniel's products. More than I recommend!!!

Daniel Stein
95097
Risposta dello sviluppatore Daniel Stein 2022.07.02 18:17
Thanks a lot for your wonderful review. 👍
Thomas Bradley Butler
30902
Thomas Bradley Butler 2022.03.29 19:50 
 

maybe long term but not for day trading. Long +6000 USD and -300 GBP with 62% long USD and 30% long GBP. Should sell GBP/USD but it does the opposite. Really just confusion. lost most of the trades with the volume

Daniel Stein
95097
Risposta dello sviluppatore Daniel Stein 2022.07.02 18:16
Hi Thomas, I recommend having a look at its info channel to get a better understanding of how to use FX Volume https://t.me/SI_FX_Volume
josedan
325
josedan 2022.01.31 15:52 
 

This is the best tool as far as am concerned.. As a trend trader, you need volume and all what I see in the market is tick volume.. Daniel was able to come up with this amazing tool and the tool has made me realize that what I was taught by NNFX about tick volume is garbage... So many people criticise the tool for being lagging but I differ... Fxvolume is not lagging, you have to find a way as per how to use it so as to fit it into your system... I am only pleading with him to include minute comparison because it is what I use in entering trade in time... Please Daniel include minute comparison. I contacted Daniel about including minute comparison which he earlier promised to include but he said the update does not gather enough momentum and directed me to use history lines... I do use history lines but it is stressful... Please include minute comparison in the tool for me.. Daniel and co.... have reached out to me as per the minute comparison... They have promised to look into it... I must commend them for excellent customer service delivery.. Daniel has been so helpful in helping me as per answering my questions.. Yes, the requested feature is there in the updated version... I do really like it

Daniel Stein
95097
Risposta dello sviluppatore Daniel Stein 2022.04.01 14:36
Dear Jose, the requested feature has been released with version 4.0. We're sure you'll like it.
victor9090
637
victor9090 2021.12.09 23:10 
 

Simplemente voy a decir una palabra: Gracias! He encontrado lo que siempre he querido. Simplemente maravilloso trabajo y lo seguiré pagando por muchos años mas.

MILAD ORANGI
117
MILAD ORANGI 2021.12.09 21:42 
 

Unfortunately, the support was not as good as I thought and will not be updated

Daniel Stein
95097
Risposta dello sviluppatore Daniel Stein 2021.12.24 12:42
Dear Milad, you can't request a new feature and expect to get it immediately. Of course, we improve and update our tools regularly, but we follow our schedule, not yours.
motsusi
170
motsusi 2021.08.12 01:46 
 

Fx Pqwer assisted me great deal with my trading but is limited to currencies. As I ventured into gold, I realised there was a huge gap left by absence of Fx Power. I reluctantly purchased Fx Volume as it covers gold. That has been one of my best ever decisions in trading this year. Fx Vlolume coupled with Fx Trend is indeed a masterpiece. Than you Daniel for this 35th century innovation.

Zachary David Cox
928
Zachary David Cox 2021.04.12 14:10 
 

Very helpful and well done indicator. Thanks

cicas65
220
cicas65 2021.03.10 10:35 
 

Un'unica parola per descrivere l'estro di Daniel: Stupefacente! Tutti i prodotti di altissimo livello. Complimenti Daniel sei un grande! One word to describe Daniel's inspiration: Amazing! All products of the highest level. Congratulations Daniel you are great!

safariforex
136
safariforex 2021.03.08 22:50 
 

If you are reading this message, congratulation, you finally made it. Welcome to the winning team. And no it's not a sale pitch, just showing my appreciation for the author and his amazing indicator.

Arnel Arnao
2002
Arnel Arnao 2021.03.04 07:21 
 

First Thank you for sharing this indicator. Its Highly Recommended Indicator. Worth every penny. I recover the rental fee in just 1 day of trading. The Customer service is excellent. I just have 1 wish and I hope Stein will look into it that will make this more powerful. I wish Stein will provide an option for showing volume data in a single panel instead of switching back in forth in the options. I want to see Ratio,Change, Long/Short/total volume at one glance. Sometimes I missed some important information because I did not check it. Overall 6 stars for this excellent indicator.

Daniel Stein
95097
Risposta dello sviluppatore Daniel Stein 2021.03.04 08:46
Hi Arnel, first of all, thanks for your positive feedback. We're happy you enjoy using FX Volume. A combined view of all information is already on our todo list, but you can also combine several FX Volume instances in one chart to get all the information you need. Here's the corresponding post of our FX Volume info channel https://t.me/SI_FX_Volume/57. In case of questions drop a line and I'll assist. All the best, Daniel
LUDY LAMBARA
1355
LUDY LAMBARA 2021.01.13 08:37 
 

this is the best trading tool ever shared to public.... and the support was very quick.... 5star

Sandy Wahyudi
584
Sandy Wahyudi 2020.12.04 16:39 
 

Amazing all tools from Daniel. I have already use all tools..trend, power, lighthouse, volume, and power play. Just follow STS and forget it. All my trade like the games. Good suuport too from Daniel. Thanks.

RDI
1482
RDI 2020.11.09 22:07 
 

L'utente non ha lasciato alcun commento sulla valutazione.

crimson
456
crimson 2020.07.15 14:34 
 

This volume indicator is unique and amazing. Somehow it didn't go well with my trades. It shows real volume data, but seems lagging indicator to me.

12
Rispondi alla recensione
Versione 4.82 2024.10.16
Fixed alerts that were incorrectly turned off.
Versione 4.81 2024.10.15
Fixed and improved GUI responsiveness on MT4
Versione 4.79 2024.10.14
Fixed a recently introduced iCustom bug that caused a "cannot set timer" error.
Versione 4.78 2024.09.28
FX Volume 4.78 contains the following changes:

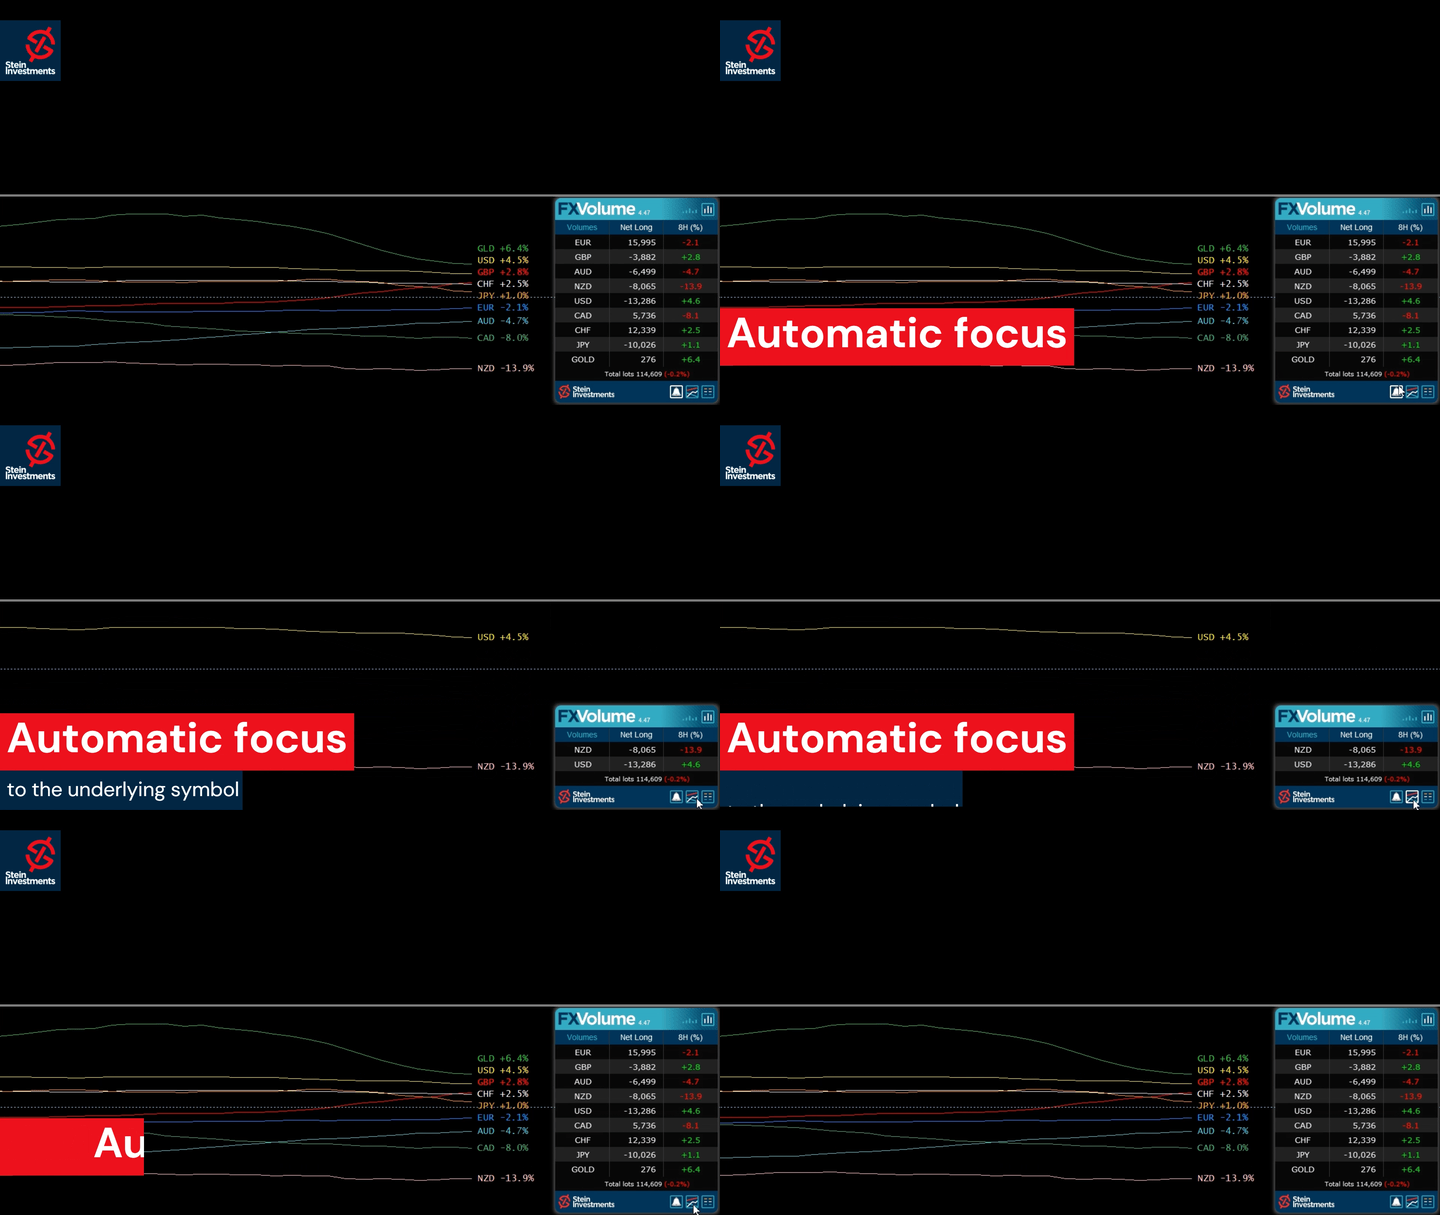
All views have been reconstructed using the updated SI framework. The Net Long Delta History Mode has been introduced as new History Line Mode.

The Net Long Delta Overview has been added as an alternative view in the Symbol List panel, and has been established as the default view for the symbol list when any of the three Net Long options is chosen in the properties.

Gold has been set to display by default.

Additionally, saved settings will now be cleared when a chart is closed.
Versione 4.68 2024.07.12
New Features:
- Alert Scheduler: Now you can customize the timing for indicator signals to fit your daily routine without being disturbed when you're busy.

Bug Fixes:
- Fixed occasional loss of history line colours, width, and style.
- Removed "Gold" plot visibility when not used by settings.

Improvements:
- Enhanced data reliability in extreme cases.
- Improved processing for "full" updates.
Versione 4.55 2023.08.30
Fixed bug when symbols alert enabled
Versione 4.54 2023.08.07
Fixed color change bug on history line labels
Versione 4.53 2023.08.01
Added INSTANCE_ID input parameter

Fixed GOLD bug, shifting all currencies data
Versione 4.52 2023.07.31
Fixed iCustom call, sometimes displaying the panel

Added Gold input parameters, and updated to use last framework changes
Versione 4.51 2023.07.27
Fixed alert input parameter labels
Versione 4.50 2023.07.26
Fixed invalid pointer, framework bug when no history lines are displayed

Fixed bug in loading FXV parameters
Versione 4.49 2023.07.25
Fixed MT4 strategy tester issue of missing history line colors
Versione 4.48 2023.07.24
Fixed minor bugs

Added an alert button in the panel

Alerts are now individually configurable according to currencies selected

Update with last framework and generic changes

Changed input parameters (without effect on iCustom requests)

Changed currency sorting in the panel following a logical convention for symbol names
Versione 4.42 2023.06.01
Fixed GUI DPI adjustment bug
Versione 4.41 2023.06.01
⚠️Due to necessary changes in our panel management, you have to reconfigure your charts once after the update⚠️

New Features
Added history mode "Net Long % change"
Added new main panel view "Net long % change"
Added alerts for "Net long % change" drop & rise

Changed indicator label on chart to display one decimal at % values
Changed indicator digits according to history mode
Changed the zoom factor to use % values
Symbols list refactoring as a new panel


Graphics
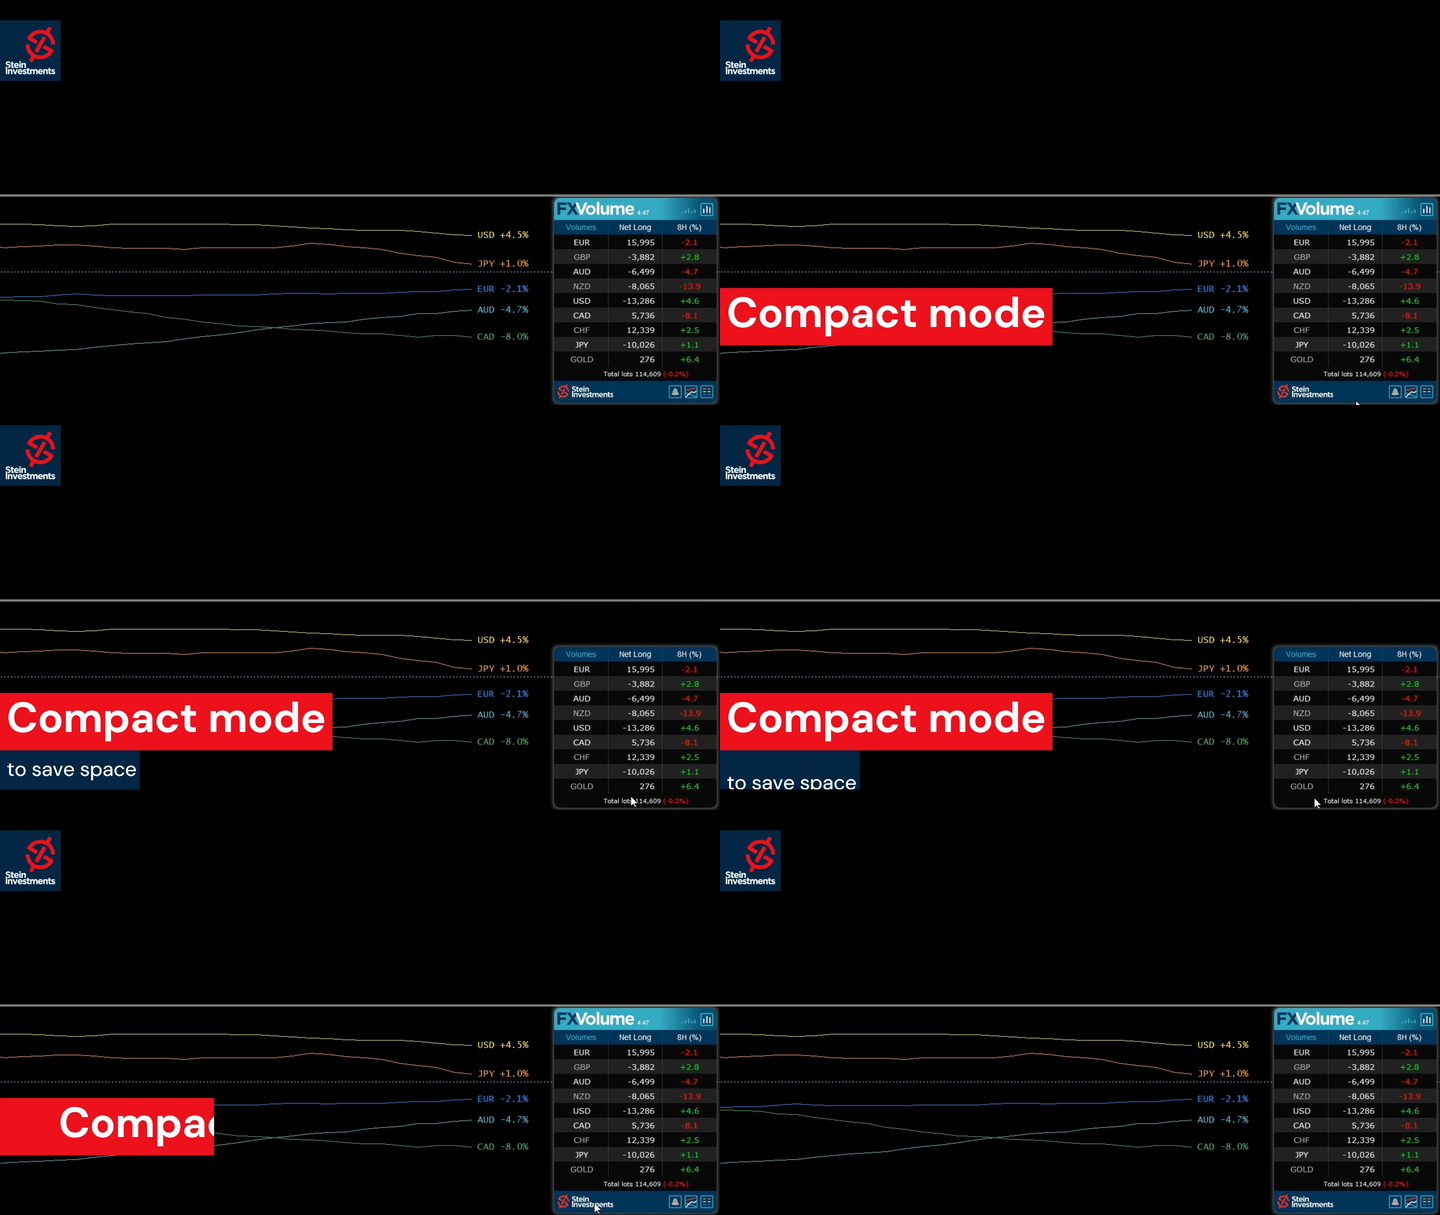
New rounded corner panel design.
Added a different color for the "Past" data column.
Added input for panel back color if the auto-scheme is disabled
Improved plot labels display to avoid overlapping. (MT5 only)


Under the hood
Apply complete internal refactoring
Apply the last framework update
Versione 4.10 2022.03.08
Fixed resource loading issue on some Mac/Linux systems

Fixed graphical panel bug when missing past data
Versione 4.0 2022.03.02
FX Volume 4.0 comes with two additional features.

1. The option to use the internal comparison calculation on a minute basis which allows comparison below our previous minimum of 1 hour.

2. Inspired by our fellow trader Luke, we created a Net Long Volume view including history lines to understand better how the Net Long volume correlates with the market moves we see on the chart.

Check our Stein Investments YouTube channel to see a video of the new features.

We're sure you'll like the new features.
Versione 3.58 2021.09.01
Optimized FX Volume to be fully compatible with MT4/MT5 templates
Versione 3.53 2021.05.08
Transition version to use data in common data folder

Fixed bug with GMT when running FX Volume on a weekend for the first time

Optimizations when used as free demo version in the strategy tester

Versione 3.50 2021.04.08
Fixed minor bug when alerts are enabled
Versione 3.49 2021.04.01
This update contains the following changes:

- New Alert options based on Long and Short Volume
- New Alert filters based on the dominance of one side available,
i.e. if Volume Long is bigger than Volume Short, you'll get only alerts for the Volume Long side
- Improved communication with the new SI Connect 2.x
- Optimized settings managements

and these changes are related to the strategy tester usage

- Fixed current candle update bug
- Added parameter to start with a focus on chart currencies
- Improved backtesting performance
Versione 3.35 2021.03.11
Fixed M1 issue when used in the strategy tester
Versione 3.34 2021.03.10
Fixed row labels in Changes view
Versione 3.33 2021.03.10
Internal refactoring
Changed SI Connect detection method
Improved performance when used in the strategy tester
Versione 3.28 2021.02.26
FX Volume GUI enabled in Strategy Tester visual mode when called via iCustom
Versione 3.27 2021.02.26
Besides various minor fixes and improvements we made a few specific improvements when using FX Volume inside an EA and in the strategy tester like:

- Improve behaviour when called from iCustom
- Improved data processing (all modes)
- Fix minor display bugs while using the visual mode
- Disabled alerts in tester mode
Versione 3.25 2021.02.22
Optimized SI Connect EA detection in case of heavy usage (more than 20 instances)
Versione 3.24 2021.02.17
Fix symbols list display (top of the list possibly hidden)
Versione 3.23 2021.02.17
With this update, it's finally possible to combine different views AND comparison periods in just one chart.

In this way, you'll easily see if the short term volume is still dynamic and supporting the volume change of a higher period.
This offers an entirely new grade of precision because you now see exactly when to enter when to exit and if it's still worth to hold the position.

We hope you'll enjoy the new flexibility provided by FX Volume.
Versione 3.18 2021.02.10
Fixed bug resulting in orphan objects on the chart

Fixed bug of line style changes when using several instances
Versione 3.17 2021.02.04
This release is another huge step forward and provides the following new features.

- Additional colouration for the positive and negative percentage values

- History lines for Volume Total, Volume Long and Volume short are now available

- All history lines can be hidden completely via parameters in the indicator properties

- Use multiple instances of FX Volume in one chart to create individual comparison views.
Note: Every instance has to use a different "History lines and buffers" mode to manage all instances correctly.

- Volume Total, Volume Long and Volume Short are now available in the indicator buffers

IMPORTANT: Please note that the history lines and the panel information is managed independently!
If you switch to a different panel view, this does NOT change the volume history lines. You have to change them in the indicator properties.

Please note also that the value labels of the history lines differ from the information seen in the panel because the panel displays always the latest available information while the history line buffer provides an OHLC volume data average for the entire candle. Please visit our FX Volume info channel at https://t.me/SI_FX_Volume to get more detailed information
Versione 3.1 2021.02.01
Renamed view labels for a better usability
Versione 3.0 2021.02.01
This major update provides a deeper insight into the real trading market sentiment

Now you can see the total volume of the long and short side separately as well as how it changed during the selected comparison period. With this information, you can easily spot on which side of the market there is an upcoming dynamic in the real trading volume.

And because we are often asked for it we added all this information for GOLD as well.

Enjoy the new amazing features of FX Volume and leave a review if you like it.
Versione 2.26 2020.12.21
Fixed minor bug occurring rarely at a terminal restart
Versione 2.25 2020.12.18
Minor bug fixed causing an empty panel due to unchanged data

Added special section for the alert option in the indicator properties
Versione 2.24 2020.12.16
The following new features have been added:

-Alert on long ratio rise/drop
-Alert on total volume rise/drop
-Alert on delta increase/decrease

We hope you'll enjoy the new alert options.
Versione 2.22 2020.12.02
Disabled DEBUG mode
Versione 2.21 2020.11.23
Fixed empty panel bug
Versione 2.20 2020.09.18
Changed Delta calculation display to provide more accurate results

Added total volume buffer -> ask for the updated code snippets

FX Volume is now ready to be used in the MT4 strategy tester!

Please note that you have to copy the FX Volume data file manually from \\MQL4\Files to \\tester\files\SI Lab in your terminal's data folder to be able to run backtests with FX Volume in your MT4 (an MT5 handles this task automatically)

Versione 2.16 2020.06.24
The panel uses current and raw data only. OHLC is used only for history lines.

Fixed bug in panel update when data are not directly available.

Added an alert for insufficient Terminal "Max bars" settings.
Versione 2.0 2020.06.20
Dear customers, please welcome our fantastic FX Volume 2.0. We spent weeks of work designing this beautiful panel, adding excellent features, and providing more detailed information to offer you outstanding user experience and a real edge in trading.

To benefit from all improvements it is necessary that you update FX Volume and SI Connect to the latest available version!
Versione 1.26 2020.05.14
Fixed bug in detecting the SI Connect EA
Versione 1.25 2020.05.14
Use updated libraries
Versione 1.24 2020.03.09
Added security to avoid alert flooding

Fixed bug which checks and sends alert continuously if the data file can't be opened
Versione 1.23 2020.03.08
Improved backward compatibility
Versione 1.19 2020.03.08
Improved EA detection -> switch to SI Connect
Versione 1.15 2020.03.04
Fixed bug chart changing to EURUSD when clicking above "Changes/Ratios" label

Added the possibility to set your individual color and line style via the Colors tab at the indicator properties
Versione 1.13 2020.03.02
Fixed GMT Offset