• Panoramica
  • Recensioni
  • Commenti
  • Novità

Volume Thermal Vision

Scopri il Potere del Volume con Volume Thermal Vision

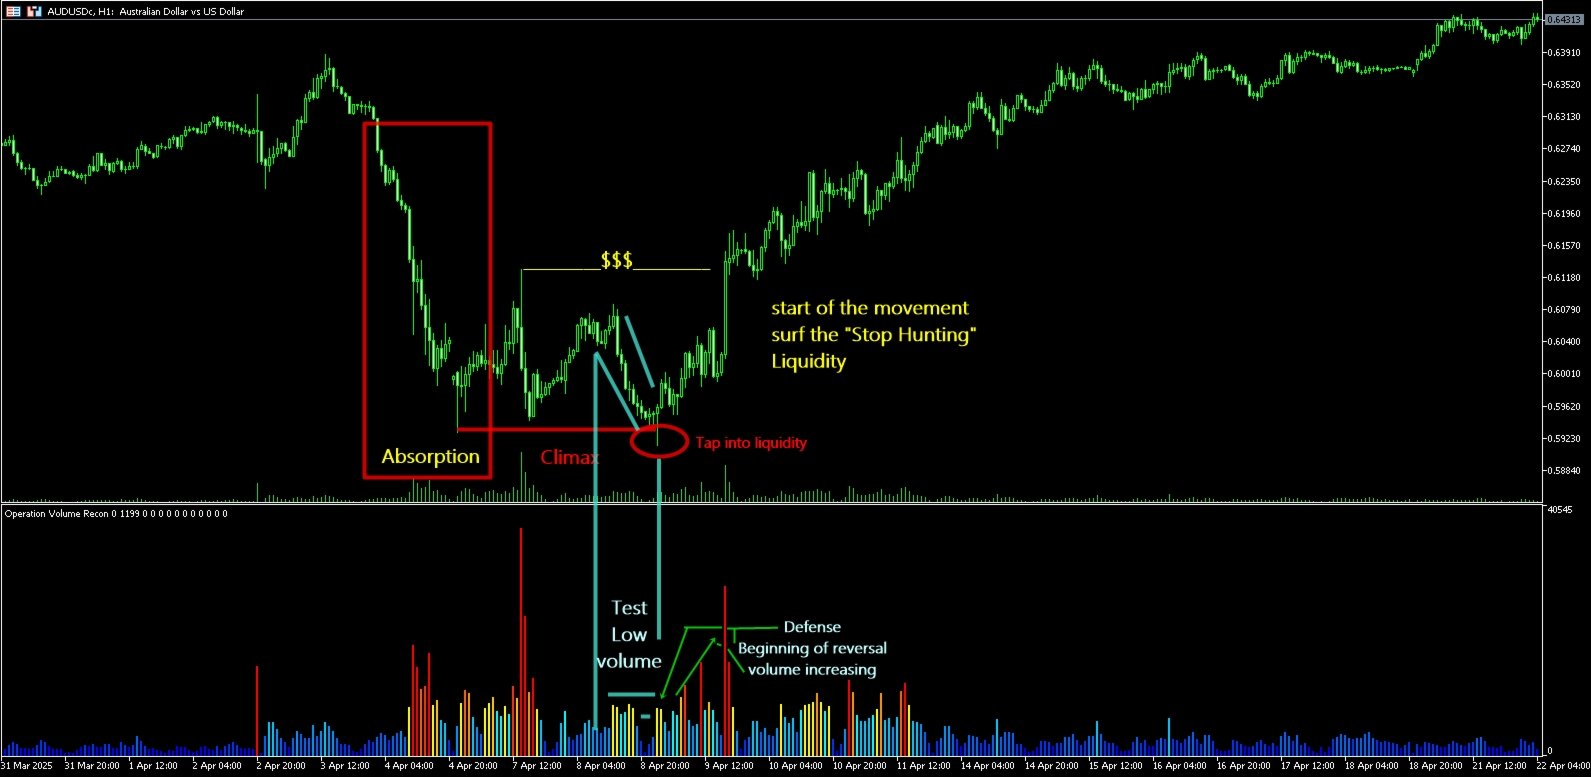
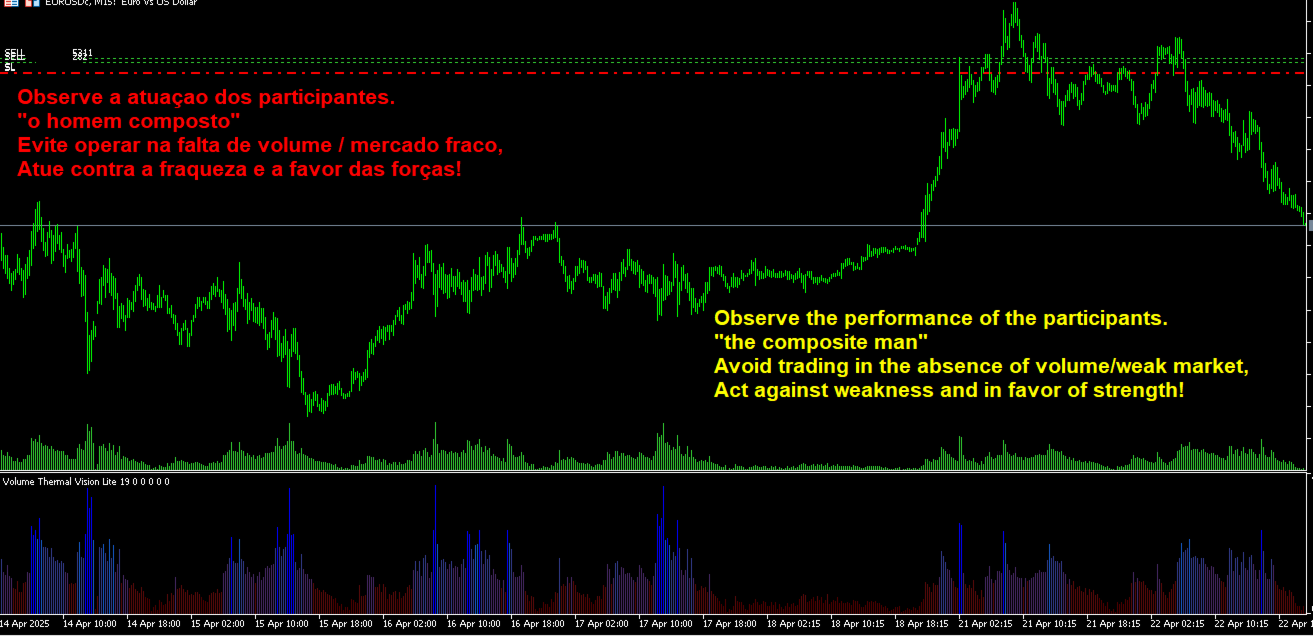
Sei pronto a portare il tuo trading al livello successivo? Presentiamo Volume Thermal Vision, l’indicatore di volume definitivo per MetaTrader 5 che trasforma l’analisi del volume in un vantaggio strategico. Sviluppato per trader che vogliono identificare opportunità ad alta probabilità, questo indicatore è perfetto per metodologie come VSA (Volume Spread Analysis), ICT (Inner Circle Trader), SMC (Smart Money Concepts) e Wyckoff, aiutandoti a decifrare il comportamento del mercato su coppie come EURUSD, GBPUSD, US30 e altre.

Perché scegliere Volume Thermal Vision?

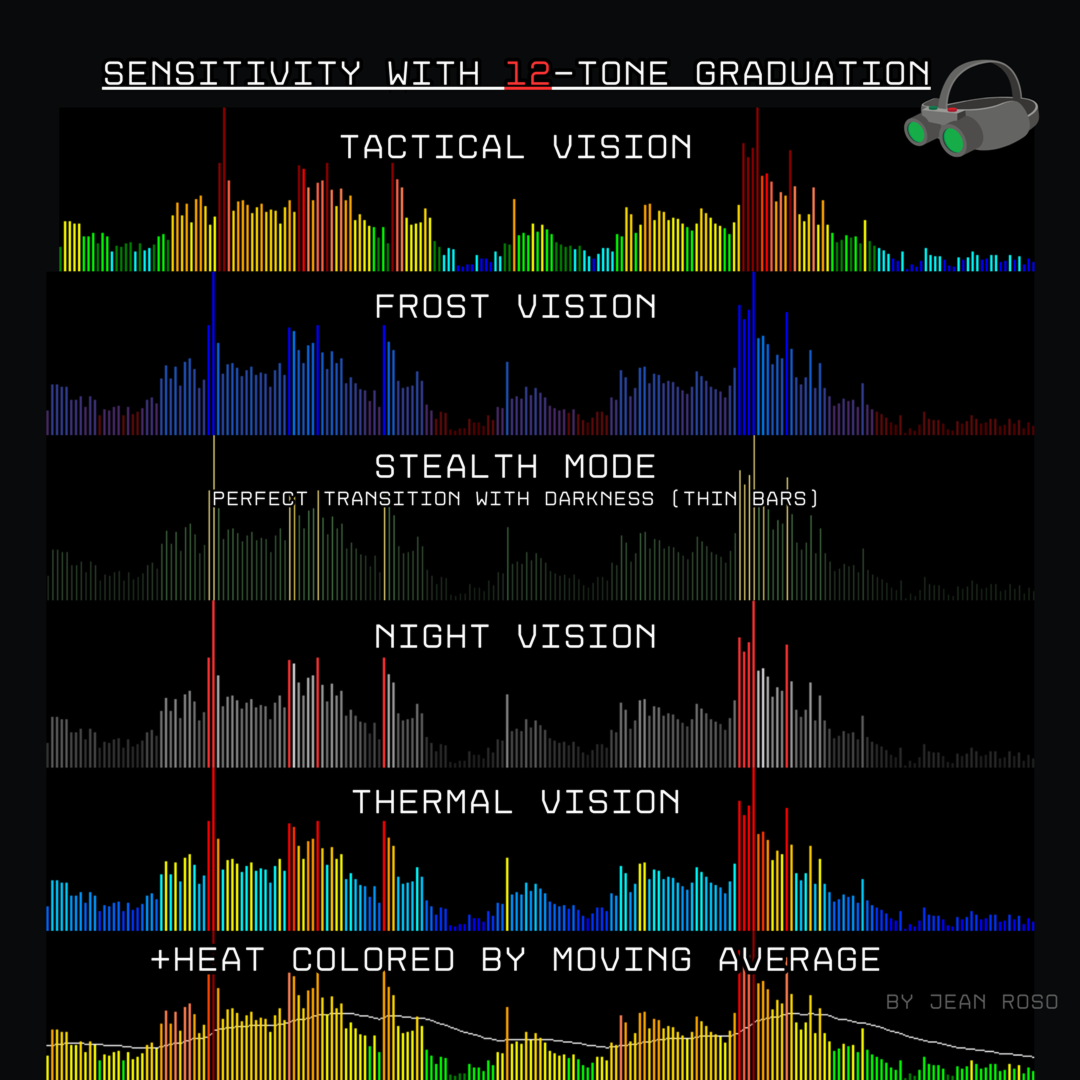
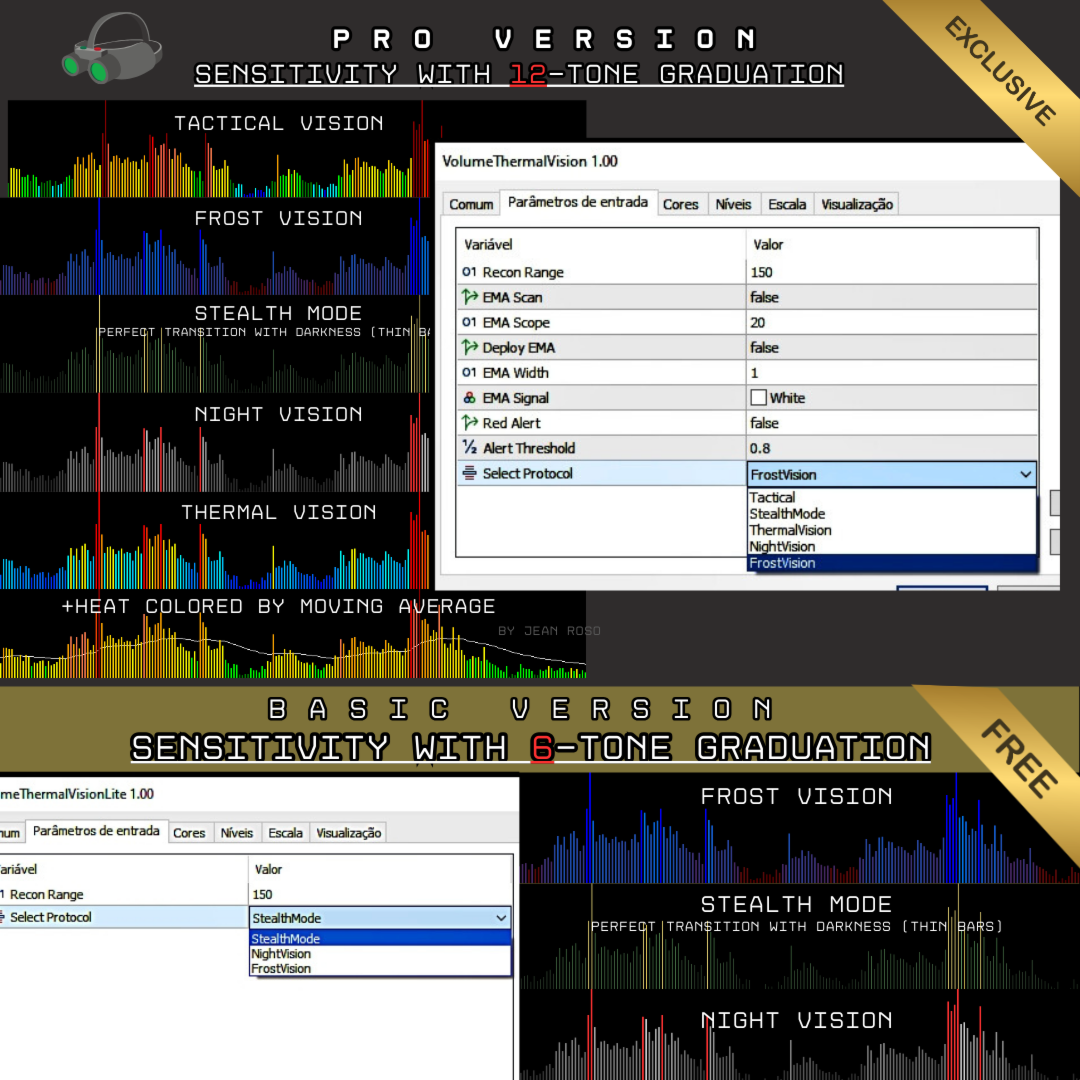
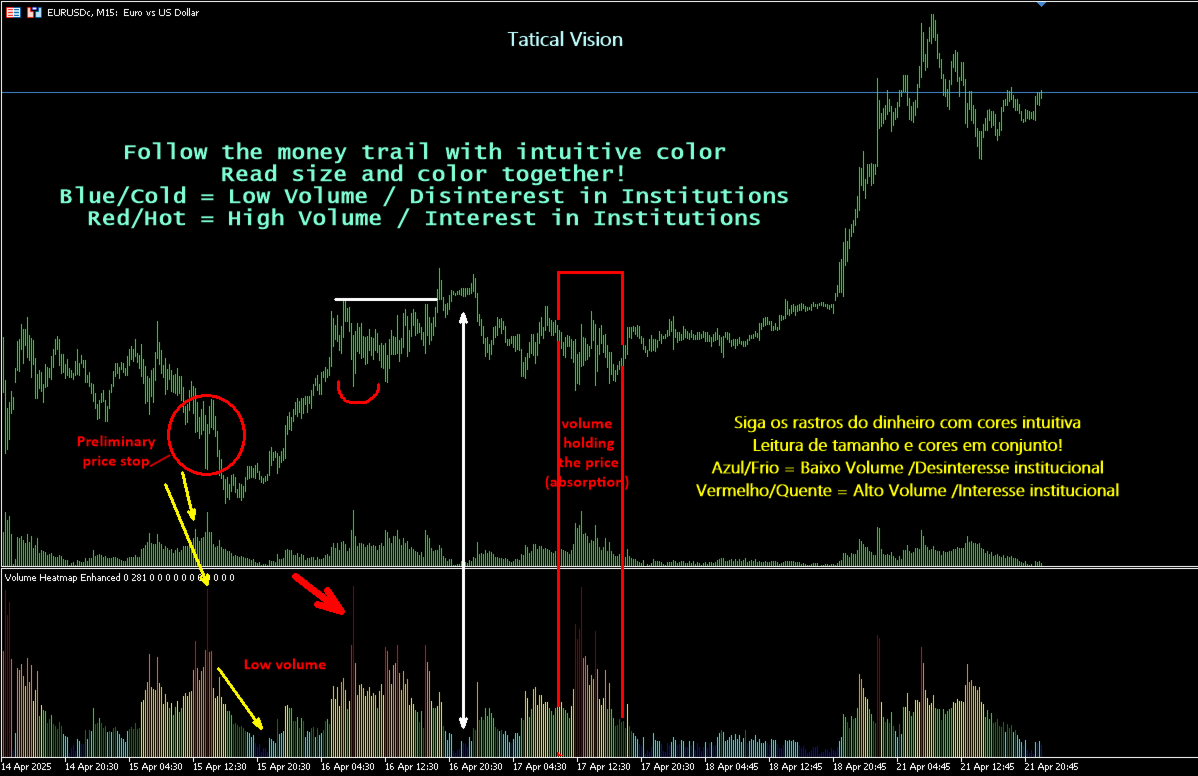
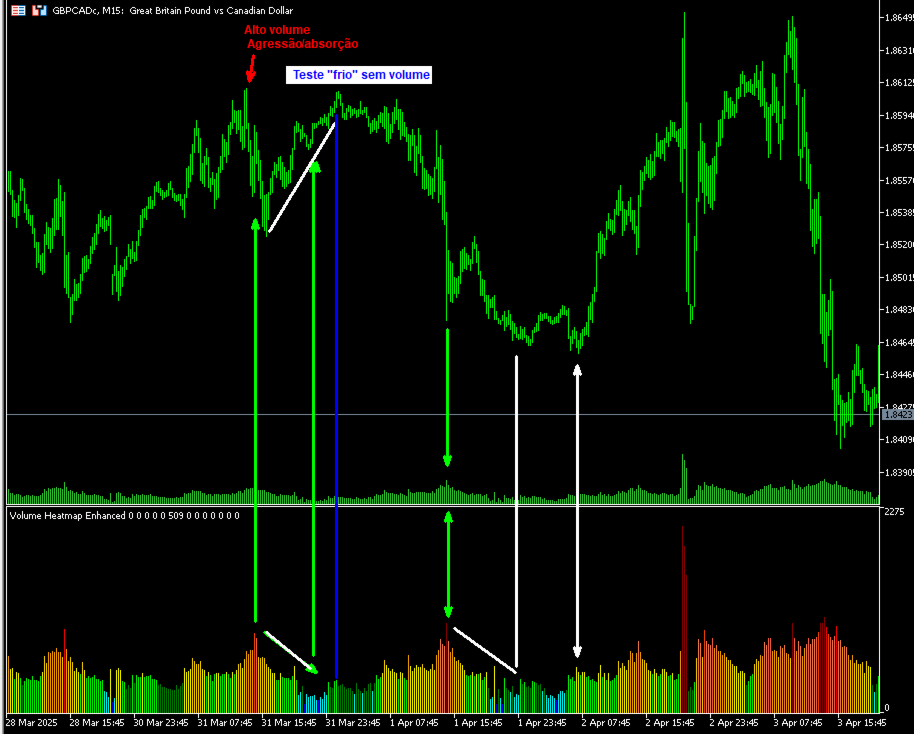
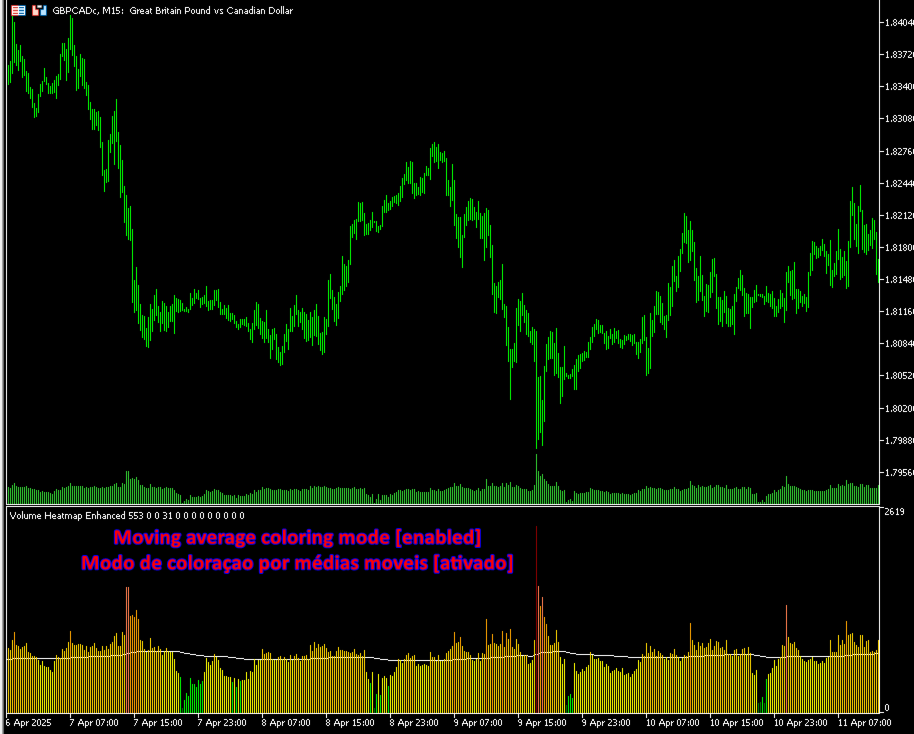
  • Analisi avanzata del volume: Visualizza l’intensità del volume con 12 livelli di colore, permettendoti di rilevare accumuli, distribuzioni e movimenti istituzionali con chiarezza.

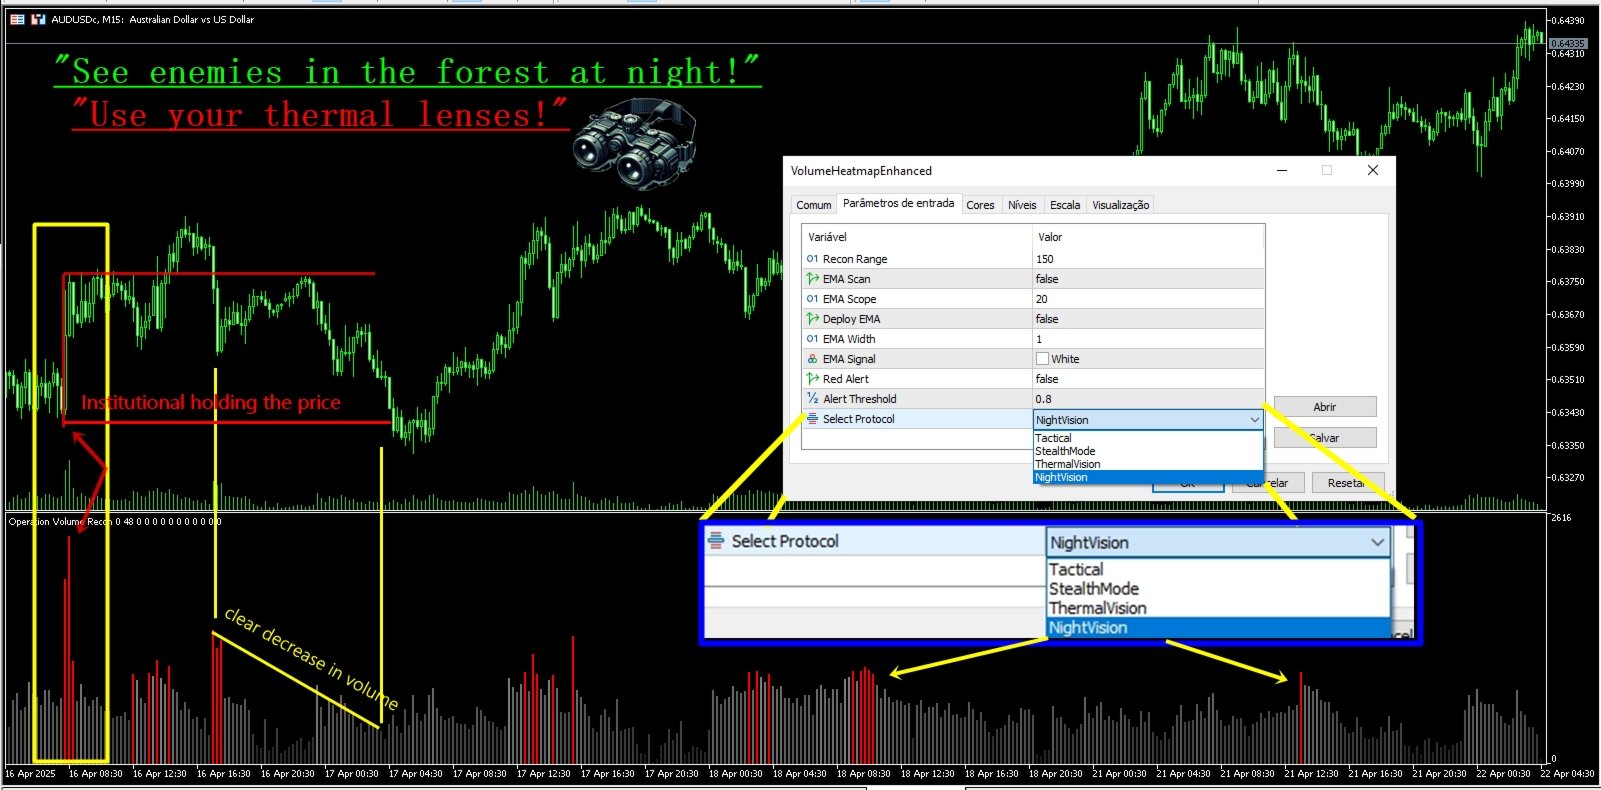
  • Protocolli visivi esclusivi: Scegli tra 4 modalità – Tactical, StealthMode, ThermalVision e NightVision – per personalizzare la visualizzazione in base al tuo stile di trading.

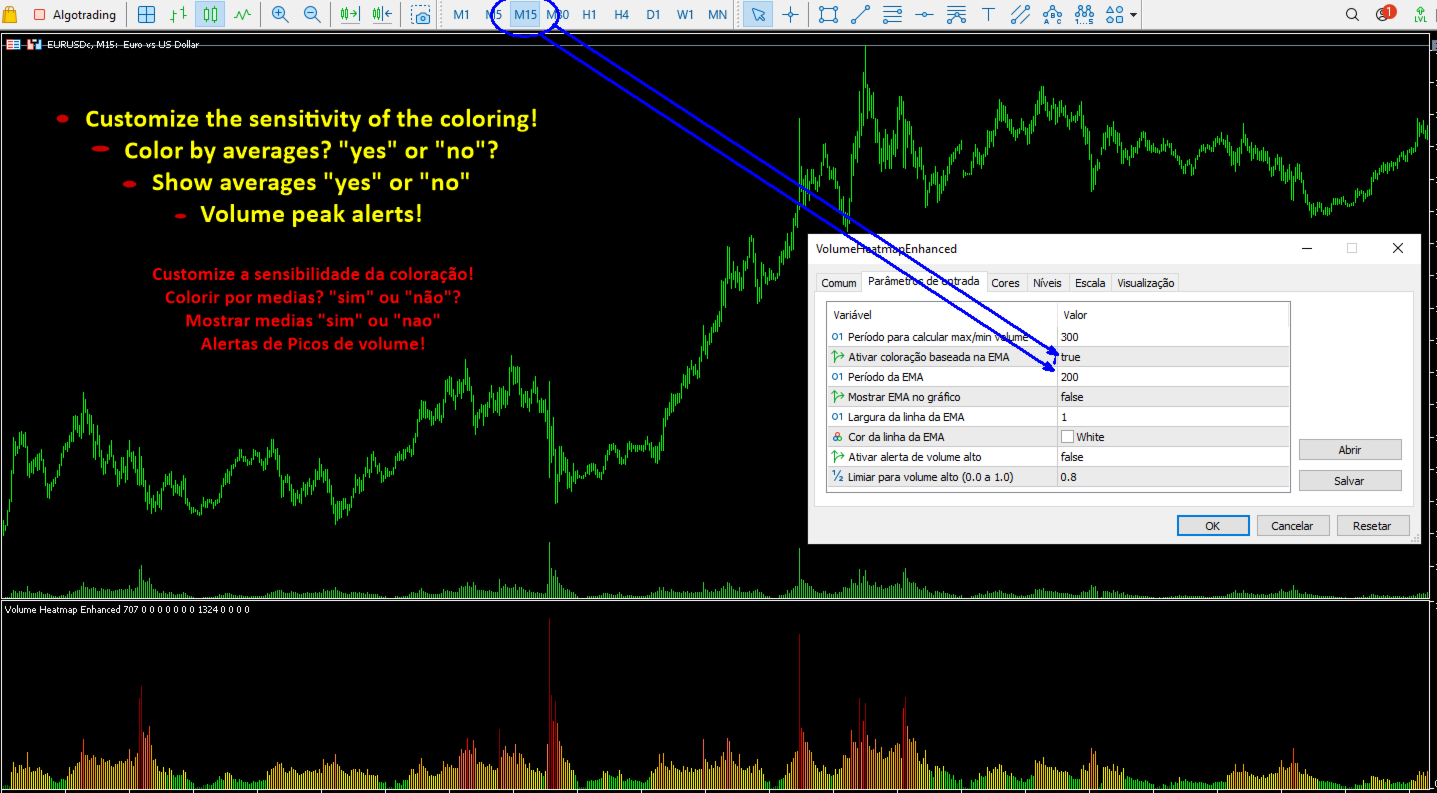
  • EMA integrata: Aggiungi una Media Mobile Esponenziale (EMA) per confermare le tendenze e individuare con precisione punti di entrata e uscita.

  • Avvisi ad alta intensità: Ricevi notifiche automatiche quando il volume raggiunge livelli critici, restando sempre un passo avanti al mercato.

  • Facile da usare: Configurazione rapida con parametri regolabili, come l’area di analisi (Recon Range) e la soglia degli avvisi, per adattarsi alle tue strategie.

Ideale per tutti i trader
Che tu sia un principiante o un trader esperto, Volume Thermal Vision è lo strumento che mancava per decifrare il mercato. Utilizzalo su qualsiasi timeframe e asset – dal forex agli indici – e ottimizza le tue decisioni basate sui dati reali di volume, applicando in modo più efficace le tecniche VSA, ICT, SMC e Wyckoff.

Provalo ora su MQL5 Market
Scarica la versione di prova gratuita su MQL5 Market e guarda Volume Thermal Vision in azione. Trasforma il tuo modo di analizzare il mercato e inizia a fare trading con maggiore fiducia già oggi.

Supporto dedicato: Hai domande? Contattami su jeantw7@gmail.com e ti aiuterò a sfruttare al massimo Volume Thermal Vision.

Volume Thermal Vision – La Visione che Fa la Differenza nel Tuo Trading


Prodotti consigliati
This z-score indicator shows the correct z-score of an asset, as it uses the normalized price data for calculation, which is the only correct way. Z-score is only applicable for normal distributed data, therefore not the actual price is considered, but the normalised returns, which were assumed to follow a normal distribution. Returns are mean reverting and assumed to follow a normal distribution, therefore z-score calculation of returns is more reliable than z-score on price, as price is NOT m
The indicator highlights the points that a professional trader sees in ordinary indicators. VisualVol visually displays different volatility indicators on a single scale and a common align. Highlights the excess of volume indicators in color. At the same time, Tick and Real Volume, Actual range, ATR, candle size and return (open-close difference) can be displayed. Thanks to VisualVol, you will see the market periods and the right time for different trading operations. This version is intended f
FREE
Waves Sizer
Flavio Javier Jarabeck
3.67 (6)
Wyckoff fans, enjoy! Ideally to be used with the Weis Waves indicator, but it can be easily used alone, the Waves Sizer puts the range (in resulting Price movement) done by the Price on its market swings. You can control how accurate or loose will be the swings. This tool is very helpful for visually know how much the Price has traveled in your Timeframe. This way you can confront this level of effort with the resulting Volume, etc... Weis Waves indicator: https://www.mql5.com/en/market/produc
FREE
Aggression Volume
Flavio Javier Jarabeck
4.2 (15)
Aggression Volume Indicator is the kind of indicator that is rarely found in the MQL5 community because it is not based on the standard Volume data provided by the Metatrader 5 platform. It requires the scrutiny of all traffic Ticks requested on the platform... That said, Aggression Volume indicator requests all Tick Data from your Broker and processes it to build a very special version of a Volume Indicator, where Buyers and Sellers aggressions are plotted in a form of Histogram. Additionally,
FREE
Value Chart Candlesticks
Flavio Javier Jarabeck
4.73 (11)
The idea of a Value Chart indicator was presented in the very good book I read back in 2020 , " Dynamic Trading Indicators: Winning with Value Charts and Price Action Profile ", from the authors Mark Helweg and David Stendahl. The idea is simple and the result is pure genius: Present candlestick Price analysis in a detrended way! HOW TO READ THIS INDICATOR Look for Overbought and Oversold levels. Of course, you will need to test the settings a lot to find the "correct" one for your approach. It
FREE
Weis Waves
Flavio Javier Jarabeck
2.83 (18)
The original author is David Weis, an expert in the Wyckoff Method. The Weis Wave is a modern adaptation of the 1930's Wyckoff Method, another expert in Tape Reading techniques and Chart Analysis. Weis Waves takes market volume and stacks it into waves according to price conditions giving the trader valuable insights about the market conditions. If you want to learn more about this subject you can find tons of videos in YouTube. Just look for "The Wickoff Method", "Weis Wave" and "Volume Spread
FREE
Trade Sniper
Thomas Bradley Butler
Presentazione di Trade Sniper: il tuo vantaggio sui mercati. Versione MT4: https://www.mql5.com/en/market/product/122371 Stanco di perdere operazioni redditizie o di essere trovato dalla parte sbagliata del mercato? Scopri Trade Sniper, l'indicatore all'avanguardia che sfrutta la potenza delle tendenze per darti un netto vantaggio nel tuo trading. Trend Sniper non è solo un altro indicatore banale. È uno strumento sofisticato che combina algoritmi avanzati con principi di trading collaudati
MIDAS Super VWAP
Flavio Javier Jarabeck
4.44 (9)
Imagine VWAP, MVWAP and MIDAS in one place... Well, you found it! Now you can track the movement of Big Players in various ways, as they in general pursue the benchmarks related to this measuring, gauging if they had good execution or poor execution on their orders. Traders and analysts use the VWAP to eliminate the noise that occurs throughout the day, so they can measure what prices buyers and sellers are really trading. VWAP gives traders insight into how a stock trades for that day and deter
FREE
This indicator sums up the difference between the sells aggression and the buys aggression that occurred in each Candle, graphically plotting the waves of accumulation of the aggression volumes.   Through these waves an exponential average is calculated that indicates the direction of the business flow. Note: This indicator DOES NOT WORK for Brokers and/or Markets WITHOUT the type of aggression (BUY or SELL).   Be sure to try our Professional version with configurable features and alerts:  Agre
FREE
The Volume Weighted ATR indicator is a helpful tool for measuring market activity. It is based on the idea of the Volume-Weighted ATR. Combining these two elements helps identify potential turning points or breakout opportunities. The indicator for the classification of the activity of the market uses the moving average and its multiples. Accordingly, where the VWATR bar is located (relative to the moving average), it is labelled as ultra-low, low, average, high, very high or ultra high. The Vo
FREE
AvgVolumes
Marco Montemari
5 (1)
This indicator is based on Volumes standard indicator, calculates the average of Volumes based on the last N bars set by users, and if the value of the volume is bigger then a set % respect the average a different color will be used. The indicator is shown in a separate indicator window. This version has now a limitation in setting the % about the threshold. If you are interested to set threshold consider to buy the PRO version ( https://www.mql5.com/en/market/product/35925 ) If you want to use
FREE
Basic Vwap
james mugendi
Simple Vwap with the daily, weekly and monthly VWAP is the abbreviation for   volume-weighted average price , which is a technical analysis tool that shows the ratio of an asset's price to its total trade volume. It provides traders and investors with a measure of the average price at which a stock is traded over a given period of time. How it's used Identify entry and exit points:   Traders can use VWAP to determine when to buy or sell an asset.   Understand price trends :  Traders can use V
FREE
Market Marker MT5
Evgeny Shevtsov
3.8 (5)
The indicator displays peak levels of activity formed by the maximum volume, tracks the correlation of the candles on all timeframes (from the highest to the lowest one). Each volume level is a kind of key trading activity. The most important cluster is inside a month, week, day, hour, etc. Indicator operation features A volume level receives Demand status if the nearest volume level located to the left and above has been broken upwards. A volume level receives Supply status if the nearest volu
BoxInside MT5
Evgeny Shevtsov
5 (4)
This indicator calculates the volume profile and places labels that correspond to the VAH, VAL and POC levels, for each candle individually. Indicator operation features The indicator works on the timeframes from M3 to MN, but it uses the history data of smaller periods: M1 - for periods from M3 to H1, M5 - for periods from H2 to H12, M30 - for the D1 period, H4 - for the W1 period, D1 - for the MN period. The color and location of the VAL, VAH and POC labels on the current candle are considere
FREE
VP hidden
Emr Aljnaby
4.22 (9)
The indicator works to convert normal volume into levels and determine financial liquidity control points. It is very similar in function to Fixed Volume Profile. But it is considered more accurate and easier to use than the one found on Trading View because it calculates the full trading volumes in each candle and in all the brokers present in MetaTrade, unlike what is found in Trading View, as it only measures the broker’s displayed prices. To follow us on social media platforms: telegram
FREE
Haven Volume Profile
Maksim Tarutin
3.5 (2)
Haven Volume Profile è un indicatore multifunzionale per l'analisi del profilo di volume che aiuta a identificare i livelli di prezzo chiave basati sulla distribuzione del volume di scambi. È stato progettato per i trader professionisti che desiderano comprendere meglio il mercato e identificare i punti di ingresso e di uscita cruciali per le loro operazioni. Altri prodotti ->  QUI Caratteristiche principali: Calcolo del Point of Control (POC) - il livello con la massima attività commerciale, ut
FREE
White Weis Volume Ticks
Ricardo Almeida Branco
5 (4)
White Weis Volume This indicator shows the sum of the volume in each wave, bulish or bearish, as idealized by David Weis , but it brings an important addition , which is the marking of the bar with the highest volume of the wave (White Bar)! In coding the indicator, it was sought to optimize the code to require minimal processing during use and not to overload mt5. The indicator can be used for pre-trading analysis and study, where the trader analyzes possible points of support and resistance
Blahtech VWAP MT5
Blahtech Limited
5 (1)
Was: $69  Now: $49   Blahtech VWAP - Volume Weighted Average Price (VWAP) is the ratio of price to total volume. It provides an average price over a specified time interval.  Links [  Install  |  Update  |  Documentation   ] Feature Highlights Configurable VWAP Line Sessions, intervals, anchored or continuous Previous day settlement line Standard Deviation bands Alerts at bar close or real time Automatic Broker or Tick volumes Significantly reduced CPU usage Input Parameters Expert Advisor Mo
Simple Weis Wave
Jean Jacques Huve Ribeiro
3.67 (3)
One of the best tools for analyzing volume, Weis Wave was idelized by David Weis, to facilitate the reading of directional flow. For the VSA method disciples it is an evolution of the practices created by Richard Wycoff, facilitating a predictive reading of the market, always seeking an accumulation and distribution of the negotiated contracts. Cumulative wave volume  Range of wave ( removed) Average Wave volume Ref "Tim Ord lectures" ( removed)
FREE
Do you use volume in your reading of the market? Certainly many traders use it, and do not imagine operating without it. The Color Histogram Volume Set indicator allows the user to choose the value that he considers interesting to monitor. When you pass this you will have visual confirmation and if you want you will also have the audible alert that is given by the indicator. Of course, there are other ways to try to find a high volume, such as assessing whether the volume is above av
Stackable VWAP
Flavio Javier Jarabeck
3.5 (4)
Volume Weighted Average Price (VWAP) is a trading benchmark commonly used by Big Players that gives the average price a Symbol has traded throughout the day. It is based on both Volume and price. Additionally we put in this indicator the MVWAP (Moving Volume Weighted Average Price). For those who do not know the usage and the importance od this indicator I recommend a great article about this subject at Investopedia ( https://www.investopedia.com/articles/trading/11/trading-with-vwap-mvwap.asp
FREE
Market tops are characterized by Volume Climax Up bars, High Volume Churn and Low Volume Up bars (also called Testing). Market bottoms are characterized by Volume Climax Down bars, High Volume Churn and Low Volume Down bars (Testing). Pullbacks, in either up or down trends, are similar to market topping or bottoming patterns, but shorter in duration and with simpler volume patterns.
FREE
VWAP Indicator
LUC JACOBUS A VERHEECKE
4.13 (23)
Volume Weighted Average Price (VWAP) The volume weighted average price (VWAP) is a  trading   benchmark  used by traders that gives the average price a security has traded at throughout the day, based on both volume and price. It is important because it provides traders with insight into both the trend and value of a security. This indicator VWAP V2 is free and is the manual version of the extended Easy VWAP indicator (30 Euro), where the date and time properties are automatically entered. With
FREE
VWAP indicator for MT5
Renaud Herve Francois Candel
Moving VWAP Indicator Moving VWAP is an important indicator drawing the Volume-Weighted Average Price (VWAP). The VWAP is a reference used by institutional traders and acts as a level of support / resistance. If price is above VWAP then means market is bullish. If price is below VWAP then means market is bearish. It can be used to enter in the market with low risk (near VWAP) and also identify the correct direction of the market. The Moving VWAP is as simple as a Simple Moving Average. The m
Cumulative Delta MT5
Evgeny Shevtsov
4.54 (56)
The indicator analyzes the volume scale and splits it into two components - seller volumes and buyer volumes, and also calculates the delta and cumulative delta. The indicator does not flicker or redraw, its calculation and plotting are performed fairly quickly, while using the data from the smaller (relative to the current) periods. The indicator operation modes can be switched using the Mode input variable: Buy - display only the buyer volumes. Sell - display only the seller volumes. BuySell -
FREE
VWAP and MVWAP
Flavio Javier Jarabeck
4.17 (6)
Volume Weighted Average Price (VWAP) is a trading benchmark commonly used by Big Players that gives the average price a Symbol has traded throughout the day. It is based on both Volume and price. Additionally we put in this indicator the MVWAP (Moving Volume Weighted Average Price). For those who do not know the usage and the importance od this indicator I recommend a great article about this subject at Investopedia ( https://www.investopedia.com/articles/trading/11/trading-with-vwap-mvwap.asp )
FREE
Adjustable Consecutive Fractals  looks for 2 or more fractals in one direction and sends out a on screen alert, sound alert and push notification, for strong reversal points . Adjustable Consecutive Fractals, shows the fractals on chart along with a color changing text for buy and sell signals when one or more fractals appear on one side of price. Adjustable Consecutive Fractals is based Bill Williams Fractals . The standard Bill Williams fractals are set at a non adjustable 5 bars, BUT withe th
BoxChart MT5
Evgeny Shevtsov
5 (7)
The market is unfair if only because 10% of participants manage 90% of funds. An ordinary trader has slim changes to stand against these "vultures". This problem can be solved. You just need to be among these 10%, learn to predict their intentions and move with them. Volume is the only preemptive factor that faultlessly works on any timeframe and symbol. First, the volume appears and is accumulated, and only then the price moves. The price moves from one volume to another. Areas of volume accumu
LT Donchian Channel
Thiago Duarte
4.83 (6)
Donchian Channel is an indicator created by Richard Donchian. It is formed by taking the highest high and the lowest low of the last specified period in candles. The area between high and low is the channel for the chosen period. Its configuration is simple. It is possible to have the average between the upper and lower lines, plus you have alerts when price hits one side. If you have any questions or find any bugs, please contact me. Enjoy!
FREE
Donchian Pro
Paulo Henrique Faquineli Garcia
5 (3)
The Donchian Channel Channels are among the most popular tools of technical analysis, as they visually convey to the analyst the limits within which most price movement tends to occur. Channel users know that valuable information can be obtained at any time, whether prices are in the central region of a band or close to one of the border lines. One of the best known techniques to explore these concepts is Bollinger Bands. However, John Bollinger was not the only one to research the application
FREE
Gli utenti di questo prodotto hanno anche acquistato
NOTA: CYCLEMAESTRO e' distribuito solo su questo sito web, non ci sono altri distributori.  La versione DEMO e' solo per referenza e non e' supportata, la versione definitiva e' perfettamente funzionante e supportata. CYCLEMAESTRO , il primo ed unico indicatore di Analisi Ciclica, utile per dare segnai di TRADING, BUY, SELL, STOP LOSS, ADDING. Creato sulla logica di   Serghei Istrati   e programmato da   Stefano Frisetti ;   CYCLEMAESTRO non e' un indicatore come gli altri , la sfida era intepre
MonetTrend — Премиум-индикатор для торговли по тренду (M30, H1, H4) MonetTrend — это мощный и визуально понятный трендовый индикатор, созданный для торговли на таймфреймах M30, H1 и H4. Он идеально подходит для работы с волатильными инструментами, такими как: • Золото (XAUUSD) • Криптовалюты (BTCUSD) • Валютные пары (EURUSD, USDJPY и др.) Ключевые особенности MonetTrend: • Автоматическое отображение Take Profit 1 (TP1) и Stop Loss (SL): После появления сигнала индикатор сразу показывает: • TP
RelicusRoad Pro MT5
Relicus LLC
4.79 (19)
Ora $ 147 (aumentando a $ 499 dopo alcuni aggiornamenti) - account illimitati (PC o MAC) Manuale utente di RelicusRoad + Video di formazione + Accesso al gruppo Discord privato + Stato VIP UN NUOVO MODO DI GUARDARE IL MERCATO RelicusRoad è l'indicatore di trading più potente al mondo per forex, futures, criptovalute, azioni e indici, fornendo ai trader tutte le informazioni e gli strumenti di cui hanno bisogno per rimanere redditizi. Forniamo analisi tecniche e piani di trading per aiutare og
Quantum TrendPulse
Bogdan Ion Puscasu
5 (13)
Ecco   Quantum TrendPulse   , lo strumento di trading definitivo che combina la potenza di   SuperTrend   ,   RSI   e   Stocastico   in un unico indicatore completo per massimizzare il tuo potenziale di trading. Progettato per i trader che cercano precisione ed efficienza, questo indicatore ti aiuta a identificare con sicurezza le tendenze di mercato, i cambiamenti di momentum e i punti di entrata e uscita ottimali. Caratteristiche principali: Integrazione SuperTrend:   segui facilmente l'andame
TPSpro RFI Levels MT5
Roman Podpora
4.55 (20)
Zone di inversione / Volumi di picco / Zone attive di un attore importante =       SISTEMA TS TPSPRO ISTRUZIONI RUS       /       ISTRUZIONI       ITA       /           Versione MT4        Ogni acquirente di questo indicatore riceve inoltre GRATIS: 6 mesi di accesso ai segnali di trading dal servizio RFI SIGNALS: punti di ingresso già pronti secondo l'algoritmo TPSproSYSTEM. Materiali didattici con aggiornamenti regolari: immergiti nella strategia e accresci il tuo livello professionale. Assis
MONEYTRON – ТВОЙ ЛИЧНЫЙ СИГНАЛ НА УСПЕХ! XAUUSD | AUDUSD | USDJPY | BTCUSD Поддержка таймфреймов: M5, M15, M30, H1 Почему трейдеры выбирают Moneytron? 82% успешных сделок — это не просто цифры, это результат продуманной логики, точного алгоритма и настоящей силы анализа. Автоматические сигналы на вход — не нужно гадать: когда покупать, когда продавать. 3 уровня Take Profit — ты сам выбираешь свой уровень прибыли: безопасный, уверенный или максимум. Четкий Stop Loss — контролируешь риск
MetaForecast M5
Vahidreza Heidar Gholami
5 (3)
MetaForecast predice e visualizza il futuro di qualsiasi mercato basandosi sull'armonia dei dati dei prezzi. Sebbene il mercato non sia sempre prevedibile, se esiste un modello nei prezzi, MetaForecast può prevedere il futuro con la massima precisione possibile. Rispetto ad altri prodotti simili, MetaForecast può generare risultati più accurati analizzando le tendenze di mercato. Parametri di input Past size (Dimensione passata) Specifica il numero di barre che MetaForecast utilizza per creare
CBT Quantum Maverick Sistema di Trading Binario ad Alta Efficienza CBT Quantum Maverick è un sistema di trading binario ad alte prestazioni progettato per trader che cercano precisione, semplicità e disciplina. Non è necessaria alcuna personalizzazione: il sistema è ottimizzato per fornire risultati efficaci fin dall'inizio. Con un po' di pratica, i segnali possono essere facilmente compresi. Caratteristiche principali: Precisione dei Segnali: Segnali di trading basati sulla candela attuale,
Presentazione       Quantum Breakout PRO   , l'innovativo indicatore MQL5 che sta trasformando il modo in cui scambi le zone di breakout! Sviluppato da un team di trader esperti con un'esperienza di trading di oltre 13 anni,       Quantum Breakout PRO       è progettato per spingere il tuo viaggio di trading a nuovi livelli con la sua strategia innovativa e dinamica della zona di breakout. Quantum Breakout Indicator ti fornirà frecce di segnalazione sulle zone di breakout con 5 zone target di
IQ Gold Gann Levels a non-repainting, precision tool designed exclusively for XAUUSD/Gold intraday trading. It uses W.D. Gann’s square root method to plot real-time support and resistance levels, helping traders spot high-probability entries with confidence and clarity. William Delbert Gann (W.D. Gann) was an exceptional market analyst, whose trading technique was based on a complex blend of mathematics, geometry, astrology, and ancient mathematics which proved to be extremely accurate. Download
MTF Supply Demand Zones MT5
Georgios Kalomoiropoulos
5 (1)
Nuova generazione di zone di domanda e offerta automatizzate. Algoritmo nuovo e innovativo che funziona su qualsiasi grafico. Tutte le zone vengono create dinamicamente in base all'azione dei prezzi del mercato. DUE TIPI DI AVVISI --> 1) QUANDO IL PREZZO RAGGIUNGE UNA ZONA 2) QUANDO SI FORMA UNA NUOVA ZONA Non ottieni un altro indicatore inutile. Ottieni una strategia di trading completa con risultati comprovati.     Nuove caratteristiche:     Avvisi quando il prezzo raggiunge la zona di
FxaccurateLS
Shiv Raj Kumawat
WHY IS OUR FXACCCURATE LS MT5 THE PROFITABLE ? PROTECT YOUR CAPITAL WITH RISK MANAGEMENT Gives entry, stop and target levels from time to time. It finds Trading opportunities by analyzing what the price is doing during established trends. POWERFUL INDICATOR FOR A RELIABLE STRATEGIES We have made these indicators with a lot of years of hard work. It is made at a very advanced level. Established trends provide dozens of trading opportunities, but most trend indicators completely ignore them! The
Trade smarter, not harder: Empower your trading with Harmonacci Patterns This is arguably the most complete harmonic price formation auto-recognition indicator you can find for the MetaTrader Platform. It detects 19 different patterns, takes fibonacci projections as seriously as you do, displays the Potential Reversal Zone (PRZ) and finds suitable stop-loss and take-profit levels. [ Installation Guide | Update Guide | Troubleshooting | FAQ | All Products ] It detects 19 different harmonic pri
Blahtech Supply Demand MT5
Blahtech Limited
4.54 (13)
Was: $299  Now: $149  Supply Demand uses previous price action to identify potential imbalances between buyers and sellers. The key is to identify the better odds zones, not just the untouched ones. Blahtech Supply Demand indicator delivers functionality previously unavailable on any trading platform. This 4-in-1 indicator not only highlights the higher probability zones using a multi-criteria strength engine, but also combines it with multi-timeframe trend analysis, previously confirmed swings
L'Oscillatore dell'Indice di Precisione (Pi-Osc) di Roger Medcalf di Precision Trading Systems La Versione 2 è stata attentamente rielaborata per essere estremamente veloce nel caricarsi sul tuo grafico e sono state apportate alcune altre migliorie tecniche per migliorare l'esperienza. Il Pi-Osc è stato creato per fornire segnali di sincronizzazione del trading accurati progettati per individuare punti di esaurimento estremi, i punti ai quali i mercati vengono costretti a recarsi solo per eli
The   Time_Price_SQ9_Degree   indicator is based on the 9 Gann square. Using this indicator, you can identify strong time and price zones. The indicator displays the levels as a degree value. The degrees can be set in the settings. After launching, the MENU button appears. If it is highlighted, it can be moved to any point on the graph, and after double-clicking on it, it stops being highlighted and menu buttons appear. To hide the menu, just double-click on the button, it will become highlight
[ MT4 Version ] Are you tired of spending months on demo or live accounts to test your trading strategies? The Backtesting Simulator is the ultimate tool designed to elevate your backtesting experience to new heights. Utilizing Metatrader historical symbol information, it offers an unparalleled simulation of real market conditions. Take control of your testing speed, test ideas quickly or at a slower pace, and witness remarkable improvements in your testing performance. Forget about wasting tim
DESCRIZIONE ICSM (Impulse-Correction SCOB Mapper) è l'indicatore che analizza il movimento dei prezzi e identifica impulsi validi, correzioni e SCOB (Single Candle Order Block). È uno strumento potente che può essere utilizzato con qualsiasi tipo di analisi tecnica perché è flessibile, informativo, facile da usare e migliora sostanzialmente la consapevolezza del trader delle zone di interesse più liquide. IMPOSTAZIONI Generale | Visivi Tema colore — definisce il tema colore dell'ICSM. SCOB
Alla ricerca di un potente indicatore di trading forex che possa aiutarti a identificare facilmente opportunità di trading redditizie? Non guardare oltre il Super Segnale Bestia. Questo indicatore basato sulle tendenze di facile utilizzo monitora continuamente le condizioni del mercato, cercando nuove tendenze in via di sviluppo o saltando su quelle esistenti. Il Beast Super Signal fornisce un segnale di acquisto o di vendita quando tutte le strategie interne sono allineate e sono al 100% in con
Volume by Price MT5
Brian Collard
3.25 (4)
Volume Profile, Footprint and Market Profile TPO (Time Price Opportunity). Volume and TPO histogram bar and line charts. Volume Footprint charts. TPO letter and block marker collapsed and split structure charts. Static, dynamic and flexible range segmentation and compositing methods with relative and absolute visualizations. Session hours filtering and segment concatenation with Market Watch and custom user specifications. Graphical layering, positioning and styling options to suit the user's a
TPA True Price Action indicator reveals the true price action of the market makers through 100% non-repainting signals strictly at the close of a candle! TPA shows entries and re-entries, every time the bulls are definitely stronger than the bears and vice versa. Not to confuse with red/green candles. The shift of power gets confirmed at the earliest stage and is ONE exit strategy of several. There are available now two free parts of the TPA User Guide for our customers. The first "The Basics"
AT Forex Indicator MT5
Marzena Maria Szmit
5 (5)
The AT Forex Indicator MT5 is a sophisticated trading tool designed to provide traders with a comprehensive analysis of multiple currency pairs. This powerful indicator simplifies the complex nature of the forex market, making it accessible for both novice and experienced traders. AT Forex Indicator uses advanced algorithms to detect trends, patterns and is an essential tool for traders aiming to enhance their forex trading performance. With its robust features, ease of use, and reliable signal
Was: $249  Now: $149   Market Profile defines a number of day types that can help the trader to determine market behaviour. A key feature is the Value Area, representing the range of price action where 70% of trading took place. Understanding the Value Area can give traders valuable insight into market direction and establish the higher odds trade. It is an excellent addition to any system you may be using. Inspired by Jim Dalton’s book “Mind Over Markets”, this indicator is designed to suit the
[ MT4 Version ]  [ Order Blocks ]  [ Kill Zones ]  [ SMT Divergences ] How to trade using Order Blocks :  Click here User Interface Performance:  During testing in the strategy tester, the UI may experience lag. Rest assured, this issue is specific to the testing environment and does not affect the indicator's performance in live trading. Elevate your trading strategy with the  Order Blocks ICT Multi TF  indicator, a cutting-edge tool designed to enhance your trading decisions through advanced o
[ MT4 Version ]  [ Kill Zones ]  [ SMT Divergences ] How to trade using Order Blocks:  Click here User Interface Performance:  During testing in the strategy tester, the UI may experience lag. Rest assured, this issue is specific to the testing environment and does not affect the indicator's performance in live trading. Elevate your trading strategy with the  Order Blocks ICT Multi TF  indicator, a cutting-edge tool designed to enhance your trading decisions through advanced order block analysis
KT Trend Trading Suite MT5
KEENBASE SOFTWARE SOLUTIONS
KT Trend Trading Suite è un indicatore multifunzione che combina una strategia di trend following con diversi punti di breakout come segnali di ingresso. Una volta che una nuova tendenza è stata identificata, l’indicatore offre numerose opportunità di ingresso per seguire con successo il trend. Una soglia di pullback viene utilizzata per evitare segnali di ingresso poco rilevanti. La versione MT4 è disponibile qui  https://www.mql5.com/en/market/product/46268 Caratteristiche Combina diverse
Visual Heatmap Book Analyzer
Alexandre Moraes De Souza Lima
Visual Heatmap Book Analyser This indicator monitors the market liquidity and generates colors based on order patterns, quantities, and renewal activities in the book. This allows you to visualize the order flow and identify areas of high and low liquidity and activity. The indicator uses machine learning techniques to analyze the order behavior in the book, enabling it to detect patterns and trends in orders, allowing you to make informed decisions about your trading operations. The color pale
SMT Divergences MT5
Diego Arribas Lopez
MT4 Version SMT Divergences MT5 SMT Divergences is one of the most innovative indicators in the market. It offers the possibility of analyzing price divergences between 2 pairs. These divergences highlight and help to foresee what banks and institutions are planning to do. SMT divergences also provides you with a kill zones indicator and the possibility of filtering divergences occurring during these kill zones.  This indicator is specially powerful if applied in 2 highly correlated pairs. A pri
How to use Pair Trading Station Pair Trading Station is recommended for H1 time frame and you can use it for any currency pairs. To generate buy and sell signal, follow few steps below to apply Pair Trading Station to your MetaTrader terminal. When you load Pair Trading Station on your chart, Pair Trading station will assess available historical data in your MetaTrader platforms for each currency pair. On your chart, the amount of historical data available will be displayed for each currency pai
The Naveen Dynamic Square  MT5  is one of the best known  technical analysis tools  inspired  by WD Gann along with the Gann Fan and Gann Box. It is considered a cornerstone of his trading technique that is based on time and price symmetry. The Naveen Dynamic Square MT5   is a powerful tool in finance for determining support and resistance levels based on a stock's extreme price points. It works by extrapolating probable price levels from a central value, typically an all-time or cyclical high o
Altri dall’autore
Volume Thermal Vision Basic
Jean Carlos Martins Roso
Volume Thermal Vision Basic è la versione semplificata del rinomato indicatore Volume Thermal Vision, progettata per i trader che desiderano analizzare l’intensità del volume con praticità ed efficienza. Con 6 livelli di colori vivaci, scegli tra le modalità StealthMode, NightVision e FrostVision per visualizzare i dati di volume in modo chiaro e strategico. Perfetto per i principianti o come complemento alla tua analisi, questo indicatore è leggero, intuitivo e ideale per ottimizzare le tue dec
FREE
Filtro:
Nessuna recensione
Rispondi alla recensione
Versione 1.3 2025.04.22
Added FrostVision mode with red at lower levels (1 and 2) and blue dominance at levels 3 to 12. Improved NightVision with brighter midtones and vibrant red peak (C'255,50,50'). Updated StealthMode with military green tones, gold peak and thinner bars (width 1). ThermalVision and Tactical kept unchanged.