Self drawn Fibonacci indicator
- Indicatori
- Ge Senlin
- Versione: 3.0
Functional description of automatic Fibonacci line indicator (including high and low channel lines)
Indicator name
Automatic Fibonacci retracement line + high and low channel auxiliary
Functional introduction
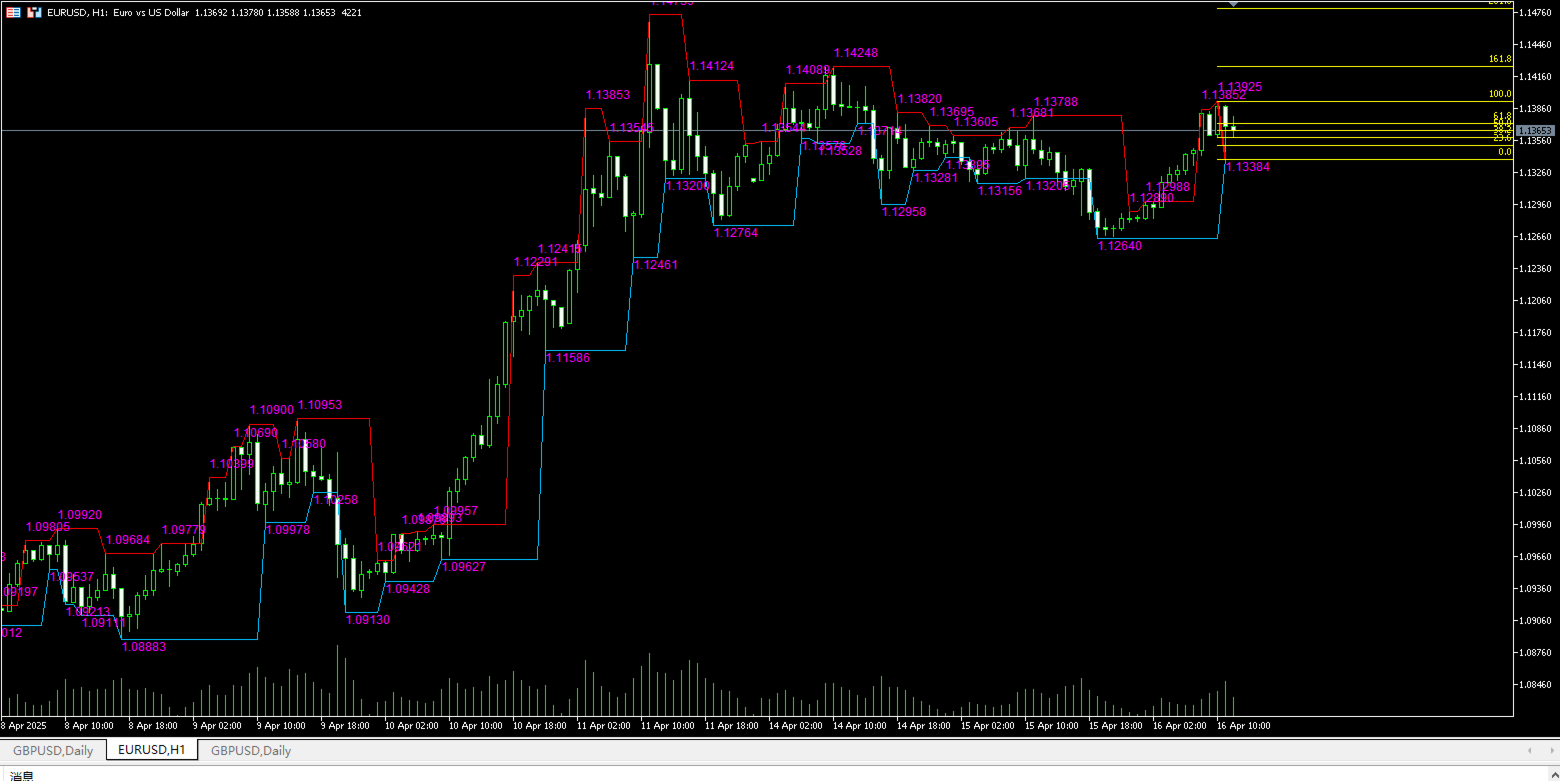
This indicator combines the automatically identified high and low points of the band, automatically draws the Fibonacci retracement/extension line, and draws the highest and lowest price channel lines of the current analysis interval to provide traders with clearer support/resistance reference and trend analysis basis.
Main functions
1. Automatic band identification
o The program identifies key bands according to the preset algorithm Fractal high and low points);
o Select the most recent obvious high and low points as the basis for drawing;
o Automatic update without manual intervention.
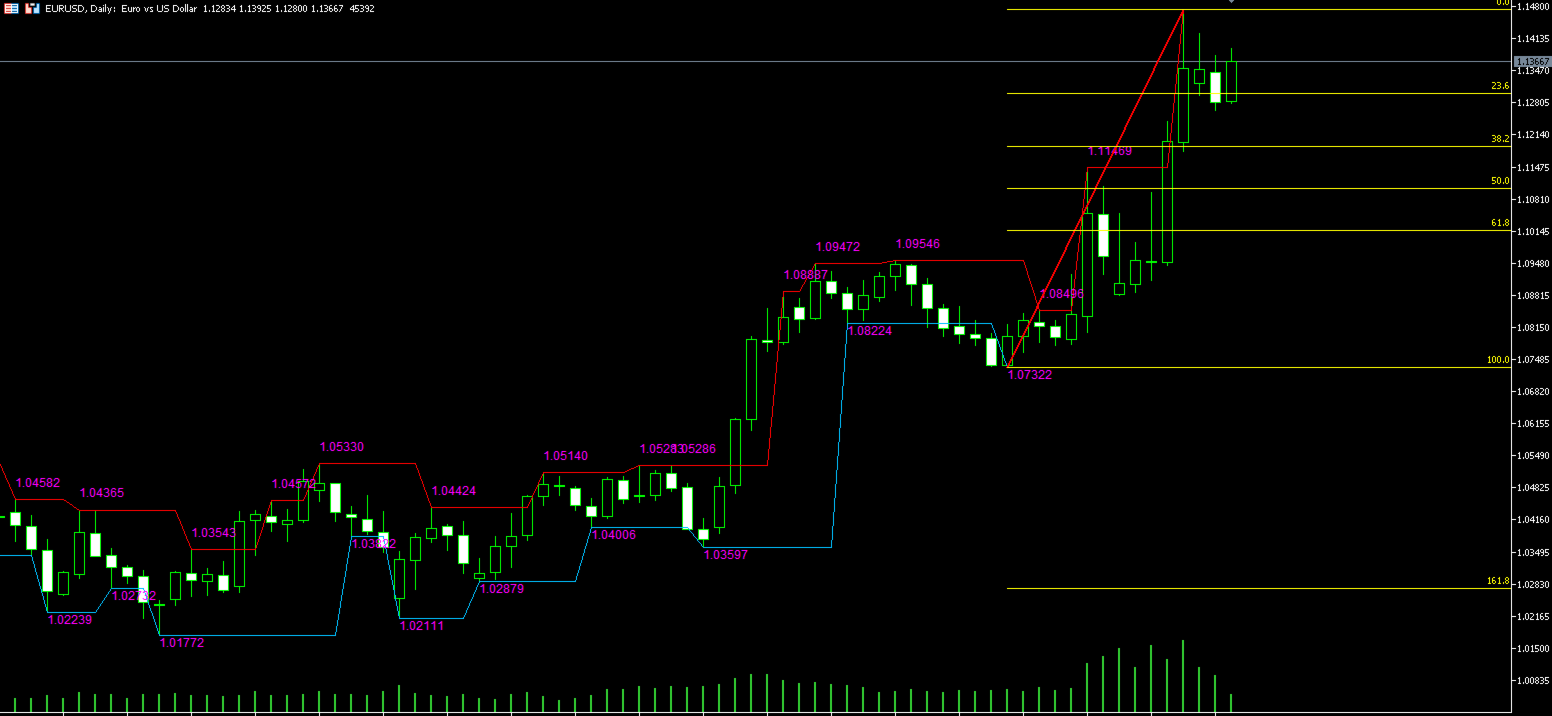
2. Fibonacci retracement/extension line drawing
o Automatically calculate the following commonly used ratios: 0%, 23.6%, 38.2%, 50%, 61.8%, 100%, 161.8%, etc.;
o Draw horizontal reference lines for each level and mark the values;
3. High and low channel line drawing
o Automatically draw "highest price line" and "lowest price line" price labels within the selected calculation interval;
o Display the price channel width within the current interval to facilitate judgment of whether the price is in the breakthrough/oscillation stage.
4. Automatic update and multi-period adaptation
o Indicators are automatically refreshed with the market;
o Can be used for any time period (such as 1 minute to weekly);
o Keep the chart tidy and adapt to short-term and band strategies.
5. Chart-friendly settings
o Supports custom line color, transparency, and style;
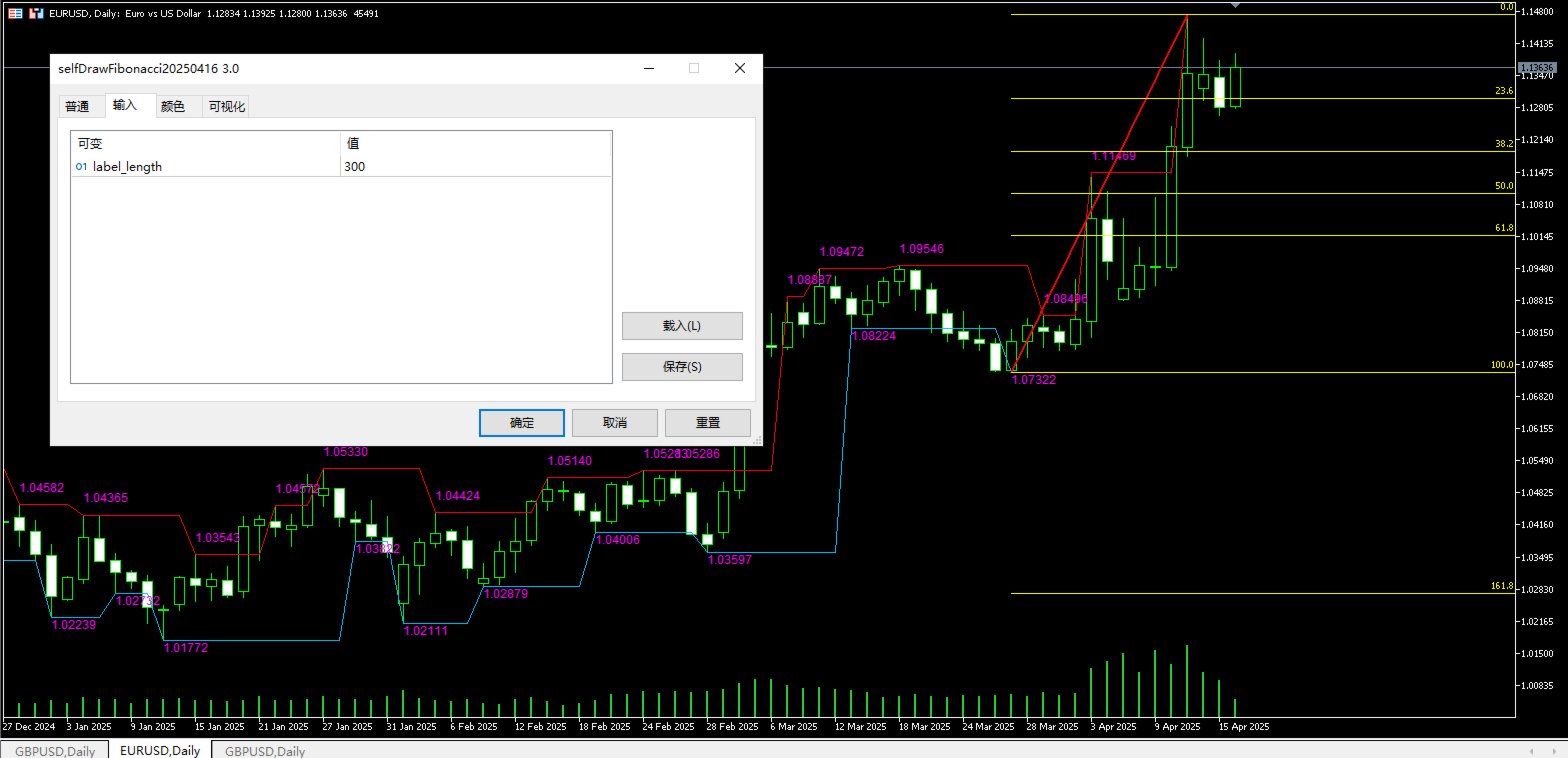
Technical parameters
Interval length: specifies the number of K-lines to display price labels
Application scenarios
• Predicting callback/rebound areas in trending markets;
• Determining whether the price breaks through a key ratio;
• Using price channels to identify shock consolidation or impending market changes;
• Providing a reference for take-profit/stop-loss areas to improve the stability of the trading system.
Advantages
• No manual operation required, automatic identification and drawing;
• Dynamically tracking market evolution and automatically adjusting key positions;
• High and low channels assist in identifying breakthroughs, retracements, and other forms;
• Adapting to a variety of trading styles: trends, bands, short-term, etc.