Executor Trend Indicator
- Indicatori
- Ren Xiang Wang
- Versione: 1.30
OV-VCS_ATR Trading Rules
The OV-VCS_ATR indicator is a popular trend-following technical analysis tool that helps traders identify the current market trend and potential entry/exit points. Below are the general trading rules for using the
OV-VCS_ATR indicator:
1. Indicator Overview
-
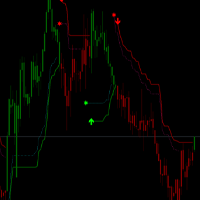
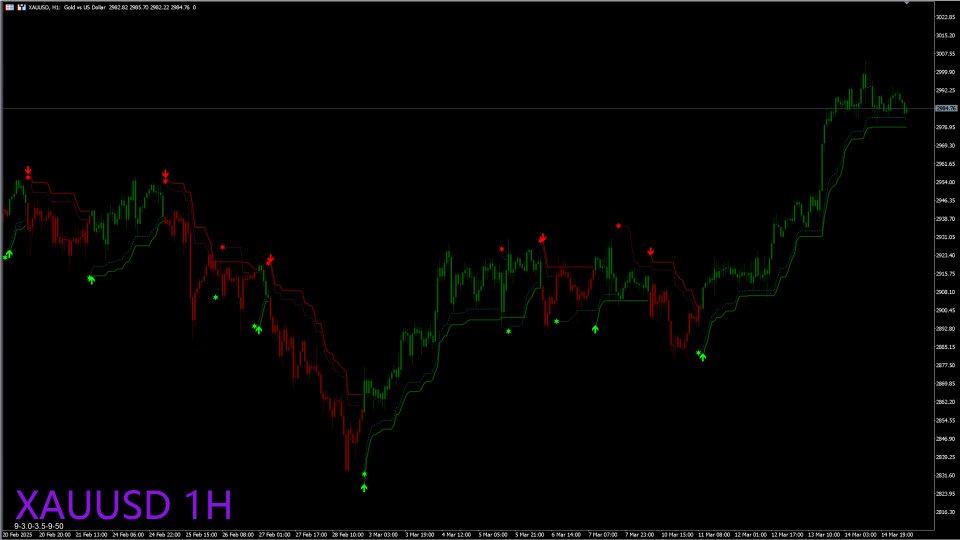
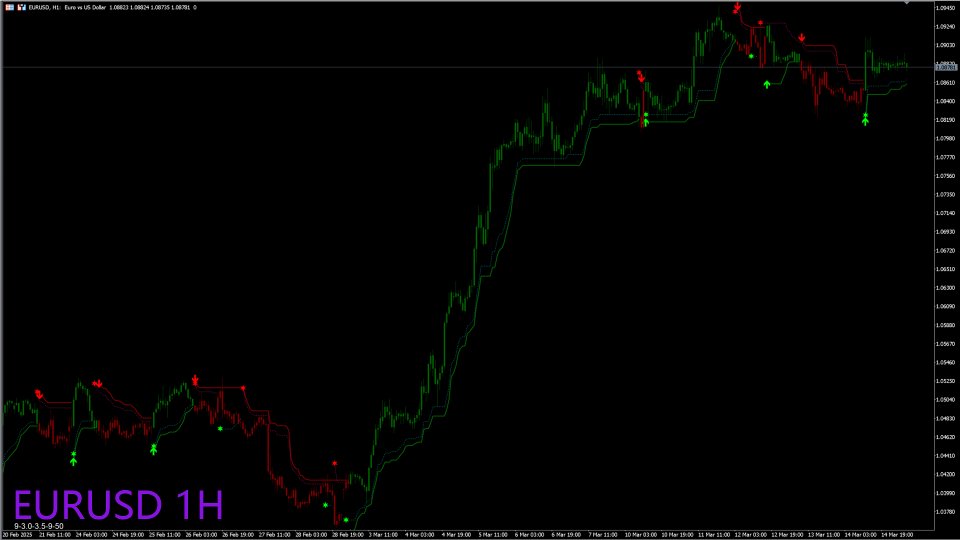
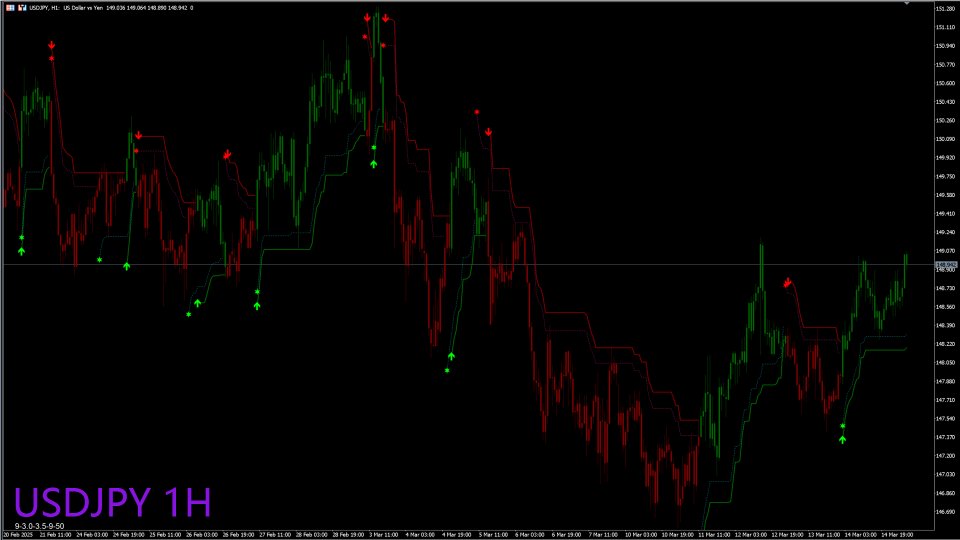
The OV-VCS_ATR indicator consists of a line plotted on the price chart, which changes color to indicate the trend direction:
-
Green Line: Indicates an uptrend (buy signal).
-
Red Line: Indicates a downtrend (sell signal).
-
2. Trading Rules
Buy Signal (Uptrend)
-
Entry: When the OV-VCS_ATR line turns green, it signals a potential buy opportunity. Enter a long position (BUY) when the price closes above the OV-VCS_ATR line.
-
Stop Loss: Place the stop loss just below the OV-VCS_ATR line or at a recent swing low.
-
Take Profit: Use a trailing stop (e.g., follow the OV-VCS_ATR line) or set a fixed profit target based on support/resistance levels.
Sell Signal (Downtrend)
-
Entry: When the OV-VCS_ATR line turns red, it signals a potential sell opportunity. Enter a short position (SELL) when the price closes below the OV-VCS_ATR line.
-
Stop Loss: Place the stop loss just above the OV-VCS_ATR line or at a recent swing high.
-
Take Profit: Use a trailing stop (e.g., follow the OV-VCS_ATR line) or set a fixed profit target based on support/resistance levels.
3. Key Parameters
-
ATR Period: The OV-VCS_ATR indicator uses the Average True Range (ATR) to calculate volatility. A common setting is ATR(9).
-
Multiplier: A multiplier applied to the ATR to determine the distance of the OV-VCS_ATR line from the price. Common values are 3.0, 3.5. A higher multiplier makes the indicator less sensitive to price fluctuations.
4. Additional Tips
-
Trend Confirmation: Combine the OV-VCS_ATR indicator with other tools like moving averages, RSI, or MACD to confirm the trend direction.
-
Timeframe Suitability: The OV-VCS_ATR indicator works well on multiple timeframes (e.g., 1-minute, 1-hour, daily charts). Adjust the ATR period and multiplier based on your trading style (scalping, day trading, or swing trading).
-
Avoid Choppy Markets: The OV-VCS_ATR indicator may generate false signals in sideways or ranging markets. Use it in trending markets for better accuracy.
5. Example Strategy
-
Identify Trend: Wait for the OV-VCS_ATR line to turn green (uptrend) or red (downtrend).
-
Enter Trade: Open a BUY position when the price closes above the green OV-VCS_ATR line or a SELL position when the price closes below the red OV-VCS_ATR line.
-
Manage Risk: Set a stop loss below/above the OV-VCS_ATR line and use a trailing stop to lock in profits.
-
Exit Trade: Close the position when the OV-VCS_ATR line changes color (e.g., green to red or red to green).
By following these rules, traders can effectively use the OV-VCS_ATR indicator to identify trends and manage trades. However, always backtest and practice in a demo account before applying it to live trading.
