• Panoramica
  • Recensioni
  • Commenti (4)
  • Novità

Verdure Woodie Pivot Trail

Overview

This is the WOODIE version in the Verdure Pivot Trail Series. Verdure Woodie Pivot Trail plots WOODIE pivot levels for every bar on the chart. Pivot levels are great at determining turning points in the market and when period pivot levels are compared to daily pivot level, these turns can be accurately predicted and timed.


Features

  • Dynamically calculates and draws Pivot levels for every bar on the chart (Central Pivot Point, R1, R2, R3, S1, S2 and S3)
  • Pivot level can be used to trail positions or to determine turning points in the market.
  • Works on all 9 timeframes from M1 to MN1.
  • Values for previous periods are contained in the buffer and can be viewed in the data window. This is particularly useful if you want to understand how price behaves around pivot levels.
  • Fully customizable options from INPUT tab of the indicator property window.
  • Can be configured to send email for every period.
  • Can be configured to send notification for every period to mobile terminal.
  • Can be used in EAs using iCustom to get data from the appropriate buffer.


Benefits

  • Saves time as you never have to manually calculate pivots levels again...NEVER
  • Makes use of data from your broker's platform so you do not need to rely on the already calculated pivot points from some websites on the Internet whose data might be different from your broker's
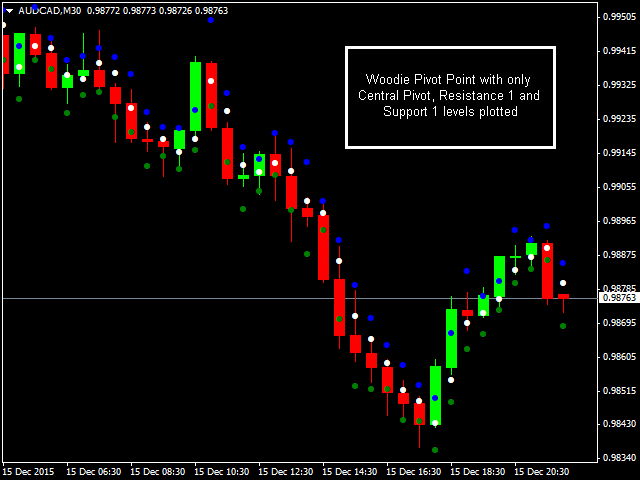
  • Fully customizable, so that you only display pivot levels that you use in your strategy. For example, you can choose to only display Central Pivot, Resistance 1 and Support 1. This is quite useful in the sense that it helps to keep your chart clean and tidy. You can choose to display any combination of pivot levels.
  • Can be used on all instruments on MetaTrader 4
Prodotti consigliati
5TT Pivot Lines is a visual display of pivot lines. These are primarily support and resistance points with the 'Blue' Pivot Point. Pivot points are useful for determining key levels for entry or exits (setting targets and stop loss levels). Having these support & resistance lines visually displayed on the chart is very useful for intraday traders. 5TT Pivot Lines come with some user-friendly settings to decide if to display the lines or connectors on the chart Settings CandlesBack: This gives th
Custom Pivots
Tsvetan Tsvetanov
4 (4)
Pivots Points are significant levels traders can use to determine directional movement, support and resistance. Pivot Points use the prior period's high, low and close to formulate future support and resistance. In this regard, Pivot Points are predictive and leading indicators. Pivot Points were originally used by floor traders to set key levels. Floor traders are the original day traders. They deal in a very fast moving environment with a short-term focus. At the beginning of the trading day,
This support and resistance indicator gives u a)support level b)resistance level c)direction(trend) all in one.The indicator is based on the top 3 best levels there are!Red dots are sell direction and green dots are buy direction,if candles dont break these levels u get in after the 3rd dot,always use higher time frames from h1 up so its more clear where direction is going,also u can set the indicator to your time frame that u are lookin at.
Introduction Professional traders use pivot points as support/resistance levels or as an indicator of a trend. Basically, a pivot point are areas at which the direction of price movement can  possibly  change. What makes pivot points so popular is their objectivity as they are recalculated each time the price moves further. The pivot points indicator implements 5 popular pivot points calculation and drawing: Standard –  The most basic and popular type of the pivots, each point serve as an indica
KT Auto Trendline MT4
KEENBASE SOFTWARE SOLUTIONS
KT Auto Trendline draws the upper and lower trendlines automatically using the last two significant swing highs/lows. Trendline anchor points are found by plotting the ZigZag over X number of bars. Features No guesswork requires. It instantly draws the notable trendlines without any uncertainty. Each trendline is extended with its corresponding rays, which helps determine the area of breakout/reversal. It can draw two separate upper and lower trendlines simultaneously. It works on all timeframe
Optimized Version of the Pivot-Based Adaptive Support, Resistance, and Signal Line Indicator No Parameters, Simple and Easy to Use, Suitable for Daily and Lower Timeframes. Advantages: Applicable to all instruments. Suitable for all timeframes. The indicator automatically adjusts with changing data, providing more accurate signals. Instructions for Use: If the current price breaks above the signal line, the trend is bullish, with the initial target being the upper resistance line. If the price
Indicator Support and Resistence plain in your chart seven lines; Red line=Resistence 3. Red line=Resistence 2. Red line=Resistence 1. Yellow line= Pivot. Green line= Support 1. Green line= Support 2. Green line= Support 3. adattable in all timeframe (minute 1, minute   5, minute   15, minute   30, Hour 1, Hour 4,Day 1,Week 1,Mounth 1); Buy under support and sell over the resistence;
support resistance levels indicator mt4: Questo strumento è un indicatore multi-timeframe che identifica e traccia le linee di supporto e resistenza, così come i livelli di Fibonacci, su un grafico con la stessa precisione dell'occhio umano. I livelli di supporto e resistenza TW per il forex hanno un algoritmo complesso che scansiona il grafico per identificare i precedenti livelli di stabilizzazione dei prezzi e rimbalzi, registrando il numero di tocchi. Sei stanco di disegnare manualmente i
Pivots
Paul Geirnaerdt
Pivots is an indicator to show pivots for relevant time frames. Besides the pivots the indicator can also show daly open line, the resistance and support levels, the ADR Fibonacci levels and the order of the pivots. Pivots includes an intelligent algorithm to eliminate Sunday candles, but only if your broker provides those. Pivots are significant price levels that may serve as support, resistance or breakout levels Settings textFont - font to use for the labels. textSize - font size. textColor -
Pivot Points MT4
KEENBASE SOFTWARE SOLUTIONS
KT Pivot Points automatically plots the daily, weekly, and monthly pivot levels on a chart with the precise calculation based on the latest data. Pivot points is a widely used indicator in technical analysis, particularly in the Forex market. Features Send alerts when the price touches the pivot level.  It offers complete customization for each kind of pivot level.   Shows daily, weekly, and monthly pivot levels without any fuss. It uses minimum CPU resources for faster calculation. Compatible
The price is moving between two curve tunnel lines in a trend. The two lines of a tunnel represent support and resistance. In an uptrend, for instance, a trade might be entered at the support of the trend line (shown by the red line in the chart) and exited at resistance of the upper tunnel line (shown by the blue line). Tunnel show trend direction for any timeframe (if you have enough bars on the chart for higher timeframes). Trend, or price tunnel, can be up, down or sideways. If the current p
Pivot Pro
Igor Semyonov
Description Pivot Pro  is a universal color indicator of the  Pivot Points  levels systems. You can select one of its three versions:  Standard   Old , Standard New  and  Fibo . The system will automatically calculate the  Pivot Point  on the basis of market data for the previous day ( PERIOD_D1 ) and the system of support and resistance levels, three in each. It can also display price tags for each level. You can color the indicator lines. Only a method of calculation of the third level of supp
Description Pivot System  is a universal color multicurrency/multisymbol indicator of the  Pivot Points  levels systems. You can select one of its three versions:  Standard   Old ,  Standard New  and  Fibo . It plots pivot levels in a separate window. The system will automatically calculate the  Pivot Point  on the basis of market data for the previous day ( PERIOD_D1 ) and the system of support and resistance levels, three in each. It can also display price tags for each level. You can color th
CityScape summarizes prices into an easy to read pattern that oscillates between 0 and 1. Repetition of CityScape pattern may indicate that the price pattern will also be repeated. CityScape pattern can be used as a quick reference to predict what the price may do by looking for a similar CityScape Pattern in the recent past. Cross currency pairs and cross timescale pattern comparisons may also provide insight into what the price will do. Inputs Local Max period: Controls the width of the CityS
Capital Pivot
Mr Nisit Noijeam
Pivot Points และระดับ (Support) และ(Resistance) บนแผนภูมิการเทรดใน MetaTrader 4 สำหรับตลาด Forex : คำนวณ Pivot Points : สคริปต์คำนวณจุด Pivot โดยใช้ข้อมูลราคาประวัติศาสตร์ เช่น ราคาเปิด, ราคาสูงสุด, ราคาต่ำสุด, และราคาปิด จากช่วงเวลาที่กำหนด (เช่น วัน, ชั่วโมง, ฯลฯ) จุด Pivot และระดับต่างๆ เช่น R1, R2, R3 (ระดับการต้านทาน) และ S1, S2, S3 (ระดับการสนับสนุน) ถูกคำนวณออกมา แสดงบนแผนภูมิ : หลังจากคำนวณจุด Pivot และระดับต่างๆ, สคริปต์จะแสดงเส้นเหล่านี้บนแผนภูมิ MT4 เพื่อช่วยให้นักเทรดสามารถเห็นจุดที่
Magic Pivot
Evgeny Belyaev
Magic Pivot is a professional indicator for finding the support and resistance lines; it has been developed by a group of professional traders. The indicator plots three support lines and three resistance lines, where a price reversal is highly probable. Magic Pivot is an excellent tool for scalping and intraday trading.   Advantages High accuracy of signals. Suitable for scalping and intraday trading. The indicator does not redraw. Simple indicator setup, minimum parameters. Works on any financ
PivotSupportResistance This indicator plots horizontal lines at daily pivot levels R3, R2, R1, Pivot, S1, S2, S3, where R means Resistance and S means Support. This indicator can be applied to any chart period, although daily pivots on charts with long periods are meaningless (if you switch your chart timeframe greater than daily chart, you will get alert and indicator will not work). Labels are shown for the most recent day's levels. There are no external inputs, so it is easy to use. Please re
This is a very complex indicator that calculates resistance and supportlevels. When the calculation is done, it merges levels that are close to eachother. It support different timeframes, simply by changing timeframe. Features: See support and resistance levels Alarm can be set off when price enters a support/resistance zone Different timeframes See screenshots for visual.
Special offer : ALL TOOLS , just $35 each! New tools   will be   $30   for the   first week   or the   first 3 purchases !  Trading Tools Channel on MQL5 : Join my MQL5 channel to update the latest news from me Indicatore di Canale di Regressione Lineare è un potente strumento di analisi tecnica che aiuta i trader a identificare trend di prezzo e potenziali punti di inversione. Calcolando e visualizzando canali di regressione lineare, bande e proiezioni future, questo indicatore offre una prosp
Indicator can drawing Support Level (Lowest price of choosed Time Frame) and Resistance Level (Highest price of choosed Time Frame), and this indicator can drawing last of Pivot Level from the Last of Support Resistance Level. Support and Resistance based Highest and Lowest at choosed Time Frame can be your next good experience for your forex trade to maximize your trade win and lost ratio. Parameter : _S_and_R__Setup_ ,          Default is   # SUPPORT AND RESISTANT # , No Need To Change Drawin
LevelsPivotMt4
Andrey Spiridonov
The LevelsPivotMT4 plots the pivot points and forms the support and resistance levels. The indicator does not repaint. Default colors Yellow - pivot point. Green - resistance levels R1, R2, R3. Red - support levels S1, S2, S3. Installed similar to any standard indicator. Analysis rules Trade the rebound from support or resistance lines. Accordingly, the target is the central line (the pivot point, yellow by default).
FREE
MetaTrend M4
Vahidreza Heidar Gholami
Meta Trend Indicator is an efficient way to forecast and detect the trend in any market. It reveals the trend, support and resistance levels, volatility and the maximum potential target, all in one indicator. To adapt to the price and to decrease consecutive trend failures, the internal trend detector algorithm studies the market and dynamically chooses the right values for the internal parameters. This indicator is a perfect trend filter for any strategy or expert advisor. Features Super Adapti
Camarilla Pivot Points is a math-based price action analysis tool that generates potential   intraday support and resistance levels.  Pivot price values are stored in output buffers within this indicator, enabling any Expert Advisor to utilize this indicator's data for trading purposes. This indicator offers the potential for developing numerous strategies. To explore some of these strategies, please visit the following websites:  https://www.babypips.com/forexpedia/camarilla-pivot-points https:
FIBO Price Alert Indicator is very simple but powerful indicator. This is a very well-known indicator that allows you to see and exploit Fibonacci's retracements. This indicator can be used in any currency pairs and on any time frame, but preferably on higher time frames. Moreover, it's relatively easy to trade with FIBO Price Alert Indicator. This indicator produces two signals: BUY Signal: When the price crosses over the virtual line. SELL Signal: When the price crosses under the virtual line.
Pivot Points Multi
Professoft Limited
Pivot Points Indicator Features: Send alerts when a pivot line is hit Displays Daily, Weekly, Monthly Indicators at the same time on the chart Restricting the time during the day when the alerts are sent Adjust the styling settings for the Pivot lines Settings: Show Daily Pivots Show Weekly Pivots Show Monthly Pivots Weekly Pivots Hit Notification Enabled Monthly Pivots Hit Notification Enabled Hit Check Frequency Time Restriction Enabled From Hour To Hour PP Color R1 Color R2 Color R3 Color S1
Created by imjesstwoone and mickey1984, this trade model attempts to capture the expansion from the 10:00-14:00 EST 4h candle using just 3 simple steps. All of the information presented in this description has been outlined by its creators, all I did was translate it to MQL4. All core settings of the trade model may be edited so that users can test several variations, however this description will cover its default, intended behavior using NQ 5m as an example. Step 1 is to identify our Price Ra
Classic Fractals indicator for MT4, with additional Trendlines connecting the latest couples of fractals ( fractals are showing highest high, and lowest low on each period) Rules for trendlines: -if new top fractal is below the last one = new resistance line -if new bot fractal is above the last one = new support line -Trendlines can be hidden -Fractals can be hidden Fractal Period = can be both even or uneven number, as it is setting for half (one side) of the bars sequence for findin
Supply Demand Zone Pro Indicator works with all products and timeframes. It is using a new calculation method, and now you can select the desired zone on any timeframe! Strongest Zones are already enabled by default This is a great advantage in trading.This indicator has a built in backtester enabled by default, just move the chart. Supply and Demand ? Supply is a price zone where sellers outnumbered buyers and drove the price lower. Demand is a price zone where buyers outnumbers sellers and dr
-   Real price is 80$   - 40% Discount ( It is 49$ now ) - Lifetime update free Contact me for instruction, add group and any questions! Related Products:  Bitcoin Expert , Gold Expert - Non-repaint - I just sell my products in Elif Kaya profile, any other websites are stolen old versions, So no any new updates or support. Introduction The breakout and retest strategy is traded support and resistance levels. it involves price breaking through a previous level.  The break and retest strategy is
VR Cub
Vladimir Pastushak
VR Cub è un indicatore per ottenere punti di ingresso di alta qualità. L'indicatore è stato sviluppato per facilitare i calcoli matematici e semplificare la ricerca dei punti di ingresso in una posizione. La strategia di trading per la quale è stato scritto l'indicatore ha dimostrato la sua efficacia per molti anni. La semplicità della strategia di trading è il suo grande vantaggio, che consente anche ai trader alle prime armi di commerciare con successo con essa. VR Cub calcola i punti di apert
Gli utenti di questo prodotto hanno anche acquistato
Gann Made Easy
Oleg Rodin
4.79 (109)
Gann Made Easy è un sistema di trading Forex professionale e facile da usare che si basa sui migliori principi del trading utilizzando la teoria di mr. WD Gann. L'indicatore fornisce segnali ACQUISTA e VENDI accurati, inclusi i livelli di Stop Loss e Take Profit. Puoi fare trading anche in movimento utilizzando le notifiche PUSH. Vi prego di contattarmi dopo l'acquisto! Condividerò i miei consigli di trading con te e fantastici indicatori bonus gratuitamente! Probabilmente hai già sentito parlar
Dynamic Forex28 Navigator
Bernhard Schweigert
5 (4)
Dynamic Forex28 Navigator - Lo strumento di trading Forex di nuova generazione. ATTUALMENTE SCONTATO DEL 49%. Dynamic Forex28 Navigator è l'evoluzione dei nostri indicatori popolari di lunga data, che combinano la potenza di tre in uno: Advanced Currency Strength28 Indicator (695 recensioni) + Advanced Currency IMPULSE con ALERT (520 recensioni) + CS28 Combo Signals (Bonus). Dettagli sull'indicatore https://www.mql5.com/en/blogs/post/758844 Cosa offre l'indicatore di forza di nuova generazione?
Scalper Inside PRO
Alexey Minkov
4.75 (61)
!SPECIAL SALE!  An exclusive indicator that utilizes an innovative algorithm to swiftly and accurately determine the market trend. The indicator automatically calculates opening, closing, and profit levels, providing detailed trading statistics. With these features, you can choose the most appropriate trading instrument for the current market conditions. Additionally, you can easily integrate your own arrow indicators into Scalper Inside Pro to quickly evaluate their statistics and profitability
FX Levels MT4
Daniel Stein
5 (2)
FX Levels: Supporti e Resistenze di Precisione Eccezionale per Tutti i Mercati Panoramica Rapida Cercate un modo affidabile per individuare livelli di supporto e resistenza in ogni mercato—coppie di valute, indici, azioni o materie prime? FX Levels fonde il metodo tradizionale “Lighthouse” con un approccio dinamico all’avanguardia, offrendo una precisione quasi universale. Basato sulla nostra esperienza reale con i broker e su aggiornamenti automatici giornalieri più quelli in tempo reale, FX
FX Volume
Daniel Stein
4.59 (34)
FX Volume: Scopri il Vero Sentimento di Mercato dalla Prospettiva di un Broker Panoramica Rapida Vuoi portare la tua strategia di trading a un livello superiore? FX Volume ti offre informazioni in tempo reale su come i trader retail e i broker sono posizionati—molto prima che compaiano report in ritardo come il COT. Che tu miri a guadagni costanti o desideri semplicemente un vantaggio più solido sui mercati, FX Volume ti aiuta a individuare grandi squilibri, confermare i breakout e perfezionar
IX Power MT4
Daniel Stein
4.67 (6)
IX Power: Scopri approfondimenti di mercato per indici, materie prime, criptovalute e forex Panoramica IX Power è uno strumento versatile progettato per analizzare la forza di indici, materie prime, criptovalute e simboli forex. Mentre FX Power offre la massima precisione per le coppie di valute utilizzando i dati di tutte le coppie disponibili, IX Power si concentra esclusivamente sui dati di mercato del simbolo sottostante. Questo rende IX Power una scelta eccellente per mercati non correlat
FX Power MT4 NG
Daniel Stein
4.94 (18)
FX Power: Analizza la Forza delle Valute per Decisioni di Trading Più Intelligenti Panoramica FX Power è lo strumento essenziale per comprendere la reale forza delle principali valute e dell'oro in qualsiasi condizione di mercato. Identificando le valute forti da comprare e quelle deboli da vendere, FX Power semplifica le decisioni di trading e rivela opportunità ad alta probabilità. Che tu segua le tendenze o anticipi inversioni utilizzando valori estremi di Delta, questo strumento si adatta
Advanced Supply Demand
Bernhard Schweigert
4.91 (294)
CURRENTLY 26% OFF !! Best Solution for any Newbie or Expert Trader! This indicator is a unique, high quality and affordable trading tool because we have incorporated a number of proprietary features and a new formula. With this update, you will be able to show double timeframe zones. You will not only be able to show a higher TF but to show both, the chart TF, PLUS the higher TF: SHOWING NESTED ZONES. All Supply Demand traders will love it. :) Important Information Revealed Maximize the potentia
Scalper Vault
Oleg Rodin
5 (28)
Scalper Vault è un sistema di scalping professionale che ti fornisce tutto il necessario per scalping di successo. Questo indicatore è un sistema di trading completo che può essere utilizzato dai trader di forex e opzioni binarie. L'intervallo di tempo consigliato è M5. Il sistema fornisce segnali di freccia accurati nella direzione della tendenza. Ti fornisce anche i segnali più alti e più bassi e i livelli di mercato di Gann. Gli indicatori forniscono tutti i tipi di avvisi, comprese le notifi
Chart Patterns All in One
Davit Beridze
4.68 (19)
Prova "Chart Patterns All in One" in modalità demo e ricevi un bonus. Inviami un messaggio dopo averlo testato in modalità demo per ricevere il tuo bonus. Lascia un commento dopo l'acquisto per ricevere 8 indicatori di alta qualità come bonus. L'indicatore Chart Patterns All-in-One aiuta i trader a visualizzare vari modelli di grafici comunemente utilizzati nell'analisi tecnica. Questo indicatore supporta l'identificazione dei possibili comportamenti del mercato, ma non garantisce la redditivit
Currency Strength Exotics
Bernhard Schweigert
4.87 (31)
ATTUALMENTE SCONTATO DEL 20%! La soluzione migliore per qualsiasi principiante o trader esperto! Questo indicatore è specializzato nel mostrare la forza della valuta per qualsiasi simbolo come coppie esotiche, materie prime, indici o futures. È il primo nel suo genere, qualsiasi simbolo può essere aggiunto alla nona riga per mostrare la vera forza della valuta di Oro, Argento, Petrolio, DAX, US30, MXN, TRY, CNH ecc. Si tratta di uno strumento di trading unico, di alta qualità e conveniente pe
Easy Breakout
Mohamed Hassan
5 (9)
After your purchase, feel free to contact me for more details on how to receive a bonus indicator called VFI, which pairs perfectly with Easy Breakout for enhanced confluence!   Easy Breakout is a powerful price action trading system built on one of the most popular and widely trusted strategies among traders: the Breakout strategy ! This indicator delivers crystal-clear Buy and Sell signals based on breakouts from key support and resistance zones. Unlike typical breakout indicators, it levera
Gold Venamax MT4
Sergei Linskii
5 (1)
Gold Venamax : questo è il miglior indicatore tecnico azionario. L'algoritmo dell'indicatore analizza il movimento dei prezzi di un asset e riflette la volatilità e le potenziali zone di ingresso. Caratteristiche dell'indicatore: Questo è un super indicatore con Magic e due blocchi di frecce di tendenza per un trading comodo e redditizio. Sul grafico viene visualizzato il pulsante rosso per cambiare blocco. Magic è impostato nelle impostazioni dell'indicatore, in modo da poter installare l'in
Golden Trend Indicator
Noha Mohamed Fathy Younes Badr
4.9 (10)
Golden Trend indicator  is The best indicator for predicting trend movement this indicator never lags and never repaints and never back paints    and give  arrow buy and sell    before the candle appear  and it will help you and  will make your trading decisions clearer its work on all currencies and  gold and crypto and all time frame This unique  indicator uses very secret algorithms to catch the  trends, so you can trade using this indicator and see the trend clear on charts  manual guide and
Trend Screener
STE S.S.COMPANY
4.78 (93)
Indicatore di tendenza, soluzione unica rivoluzionaria per il trading di tendenze e il filtraggio con tutte le importanti funzionalità di tendenza integrate in un unico strumento! È un indicatore multi-timeframe e multi-valuta al 100% non ridipingibile che può essere utilizzato su tutti i simboli/strumenti: forex, materie prime, criptovalute, indici e azioni. OFFERTA A TEMPO LIMITATO: l'indicatore di screening di supporto e resistenza è disponibile a soli 50$ e a vita. (Prezzo originale 250$) (o
Innanzitutto, vale la pena sottolineare che questo Strumento di Trading è un Indicatore Non-Ridipingente, Non-Ridisegnante e Non-Laggante, il che lo rende ideale per il trading professionale. Corso online, manuale utente e demo. L'Indicatore Smart Price Action Concepts è uno strumento molto potente sia per i nuovi che per i trader esperti. Racchiude più di 20 utili indicatori in uno solo, combinando idee di trading avanzate come l'Analisi del Trader del Circolo Interno e le Strategie di Trading
Gold Stuff
Vasiliy Strukov
4.86 (249)
Gold Stuff è un indicatore di tendenza progettato specificamente per l'oro e può essere utilizzato anche su qualsiasi strumento finanziario. L'indicatore non ridisegna e non è in ritardo. Periodo consigliato H1. Su di esso l'indicatore funziona in modo completamente automatico Expert Advisor EA Gold Stuff. Lo trovi nel mio profilo. I risultati in tempo reale possono essere visualizzati qui.  Puoi ottenere una copia gratuita del nostro indicatore Strong Support e Trend Scanner, per favore scriv
TPSpro RFI Levels
Roman Podpora
4.85 (27)
ISTRUZIONI       RUS   -   INGLESE       Si   consiglia di utilizzare con un indicatore       -       TPSpro   TENDENZA PRO -   Versione MT4         Un elemento chiave nel trading sono le zone o i livelli da cui vengono prese le decisioni di acquisto o vendita di uno strumento di trading. Nonostante i tentativi dei principali attori di nascondere la loro presenza sul mercato, lasciano inevitabilmente delle tracce. Il nostro compito era imparare a identificare queste tracce e interpretarle corre
Bull versus Bear
Mohamed Hassan
4.5 (18)
Send us a message after your purchase to receive more information on how to get your  BONUS  for FREE  that works in great combination with Bull vs Bear ! Bull versus Bear is an easy-to-use Forex indicator that gives traders clear and accurate signals based on clear trend retests . Forget about lagging indicators or staring at charts for hours because  Bull vs Bear provides real-time entries with no lag and no repaint, so you can trade with confidence. Bull vs Bear  helps you enter trades durin
Beast Super Signal
Dustin Vlok
4.73 (89)
Alla ricerca di un potente indicatore di trading forex che possa aiutarti a identificare facilmente opportunità di trading redditizie? Non guardare oltre il Super Segnale Bestia. Questo indicatore basato sulle tendenze di facile utilizzo monitora continuamente le condizioni del mercato, cercando nuove tendenze in via di sviluppo o saltando su quelle esistenti. Il Beast Super Signal fornisce un segnale di acquisto o di vendita quando tutte le strategie interne sono allineate e sono al 100% in con
ATTUALMENTE SCONTATO DEL 31%! La soluzione migliore per ogni principiante o trader esperto! Questo indicatore è uno strumento di trading unico, di alta qualità e conveniente perché abbiamo incorporato una serie di caratteristiche proprietarie e una formula segreta. Con un solo grafico fornisce avvisi per tutte le 28 coppie di valute. Immaginate come migliorerà il vostro trading perché sarete in grado di individuare l'esatto punto di innesco di una nuova tendenza o opportunità di scalping! Co
Special offer : ALL TOOLS , just $35 each! New tools   will be   $30   for the   first week   or the   first 3 purchases !  Trading Tools Channel on MQL5 : Join my MQL5 channel to update the latest news from me Scopri la potenza del concetto di Inversion Fair Value Gap (IFVG) di ICT con l’ Indicatore Inversion Fair Value Gaps ! Questo strumento all’avanguardia porta i Fair Value Gaps (FVG) a un livello successivo, identificando e visualizzando le zone di FVG invertite – aree chiave di supporto
PZ Harmonacci Patterns
PZ TRADING SLU
3.17 (6)
Trade smarter, not harder: Empower your trading with Harmonacci Patterns Special Offer: Purchase now to receive free bonuses worth $165! (Read more for details) This is arguably the most complete harmonic price formation auto-recognition indicator you can find for the MetaTrader Platform. It detects 19 different patterns, takes fibonacci projections as seriously as you do, displays the Potential Reversal Zone (PRZ) and finds suitable stop-loss and take-profit levels. [ Installation Guide | Upda
Special offer : ALL TOOLS , just $35 each! New tools   will be   $30   for the   first week   or the   first 3 purchases !  Trading Tools Channel on MQL5 : Join my MQL5 channel to update the latest news from me Presentiamo il rivoluzionario RSI Kernel Optimized with Scanner, uno strumento all'avanguardia che ridefinisce l'analisi RSI tradizionale integrando il potente algoritmo di stima della densità del nucleo (KDE). Questo indicatore avanzato non solo fornisce informazioni in tempo reale sull
System Trend Pro
Aleksandr Makarov
5 (2)
System Trend Pro - This is the best trend trading indicator!!! You can get this indicator for free -  Quantum Entry PRO The indicator no repaint!!!   The indicator has   MTF   mode, which adds confidence to trading on the trend (   no repaint   ). How to trade? Everything is very simple, we wait for the first signal (big arrow), then wait for the second signal (small arrow) and enter the market in the direction of the arrow. (See screens 1 and 2.) Exit on the opposite signal or take 20-30 pips
Legacy of Gann
Pavel Zamoshnikov
4.83 (12)
The indicator very accurately determines the levels of the possible end of the trend and profit fixing. The method of determining levels is based on the ideas of W.D.Gann, using an algorithm developed by his follower Kirill Borovsky. Extremely high reliability of reaching levels (according to K. Borovsky  - 80-90%) Indispensable for any trading strategy – every trader needs to determine the exit point from the market! Precisely determines targets on any timeframes and any instruments (forex, met
Automated Trendlines
Georgios Kalomoiropoulos
5 (16)
Le linee di tendenza sono lo strumento più essenziale di analisi tecnica nel forex trading. Sfortunatamente, la maggior parte dei trader non li disegna correttamente. L'indicatore automatizzato delle linee di tendenza è uno strumento professionale per i trader seri che ti aiuta a visualizzare il movimento di tendenza dei mercati. Esistono due tipi di linee di tendenza, linee di tendenza rialziste e linee di tendenza ribassiste. Nella tendenza rialzista, la linea di tendenza Forex viene tracci
ATTUALMENTE SCONTATO DEL 26% La soluzione migliore per ogni principiante o trader esperto! Questo indicatore è uno strumento di trading unico, di alta qualità e conveniente perché abbiamo incorporato una serie di caratteristiche proprietarie e una nuova formula. Con un solo grafico è possibile leggere la forza delle valute per 28 coppie Forex! Immaginate come migliorerà il vostro trading perché sarete in grado di individuare l'esatto punto di innesco di una nuova tendenza o di un'opportunità
TPSproTREND PrO
Roman Podpora
4.71 (28)
TPSpro TREND PRO   è un indicatore di tendenza che analizza automaticamente il mercato, fornisce informazioni sulla tendenza e sui rispettivi cambiamenti e fornisce segnali per entrare nelle operazioni senza ridisegnare. L'indicatore utilizza ciascuna candela e la analizza separatamente. Si riferisce a vari shock al rialzo o al ribasso. Punto di ingresso preciso per il trading di valute, criptovalute, metalli, azioni e indici! Versione MT5                   Descrizione completa dell'indicatore  
TW Trend Scalper Indicator: The TW Scalper Shoot ti offre un'esperienza di trading unica utilizzando le ultime strategie di trading e la tecnologia dell'intelligenza artificiale. Questo prodotto soddisfa le diverse esigenze dei trader scalper fornendo due categorie distinte di segnali: Testa questo prodotto eccezionale oggi e inizia la tua esperienza unica per diventare un scalper di tendenze. Inoltre, ricevi un prodotto del valore di 37 $ come regalo. Categorie di segnali: 1. Segnali a lu
Altri dall’autore
Overview This is the DELUXE version in the Pivot Point Plotter Series. It is a robust indicator that dynamically calculates and plots any of the 4 major pivot points on your chart irrespective of intra day timeframe on which the indicator is placed. This indicator is capable of plotting STANDARD, CAMARILLA, FIBONNACI or WOODIE daily pivot points. Whichever you use in your trading, this indicator is your one-stop shop. Kindly note that it is a DAILY Pivot Point Plotter for DAY TRADERS who trade o
Verdure OCO EA
Olawale Adenagbe
5 (1)
Overview A One-Cancels-the-Other Order (OCO) is a pair of orders stipulating that if one order is executed, then the other order is automatically cancelled. Verdure OCO EA brings this functionality to MT4. This EA is a robust implementation of the popular One-Cancels-the-Other Order (OCO) but with added benefits, features and options. It is an EA that helps with trade management and especially useful for traders who use stop and reverse trading systems, traders who look for opportunities around
Verdure Lot Calculator
Olawale Adenagbe
5 (1)
Overview Money management is an all-important aspect of trading that many traders often overlook. It is very possible that even with a winning strategy, bad money management can often result in huge loses. Verdure Lot Calculator aims to help traders minimize risk and exposure in the Forex market. Verdure Forex Calculators implements Lot (Trade or Contract Size) Calculator as an indicator on MT4 platform. Lot Calculator (trade or contract size) A lot refers to a bundle of units in trade. In Fore
Verdure Forex Calculators
Olawale Adenagbe
1 (1)
Overview Money management is an all-important aspect of trading that many traders often overlook. It is very possible that even with a winning strategy, bad money management can often result in huge loses. Verdure Forex Calculators aims to help traders minimize risk and exposure in the Forex market. Verdure Forex Calculators implements 4 calculators in one single indicator. It is the first of it's kind on MT4 platform. Calculators implemented are: Lot (Trade or Contract Size) Calculator. Margin
This is a purely Price Action indicator that tracks the open and close prices of all 28 major Forex currency pairs and calculates a volatility value based on every tick in real time. It only tracks raw price data and not data from another indicator and it does not use any complicated formula or algorithm in calculating volatility. This version shows volatility for all 28 major currency pairs Benefits Accurate and real time update of volatility Volatility across all 28 major Forex currency pairs
This is a purely Price Action indicator that tracks the open and close prices of all 28 major Forex currency pairs and calculates a volatility value based on every tick in real time. It only tracks raw price data and not data from another indicator and it does not use any complicated formula or algorithm in calculating volatility. This version only shows volatility for a single currency pair Benefits Accurate and real time update of volatility Volatility across all 28 major Forex currency pairs
Filtro:
Nessuna recensione
Rispondi alla recensione
Versione 2.0 2020.03.24
General improvements