Tough Cookie Multi Asset
- Indicatori
- Florian Leonhard Schaal
- Versione: 1.1
- Aggiornato: 2 marzo 2025
- Attivazioni: 5
Overview
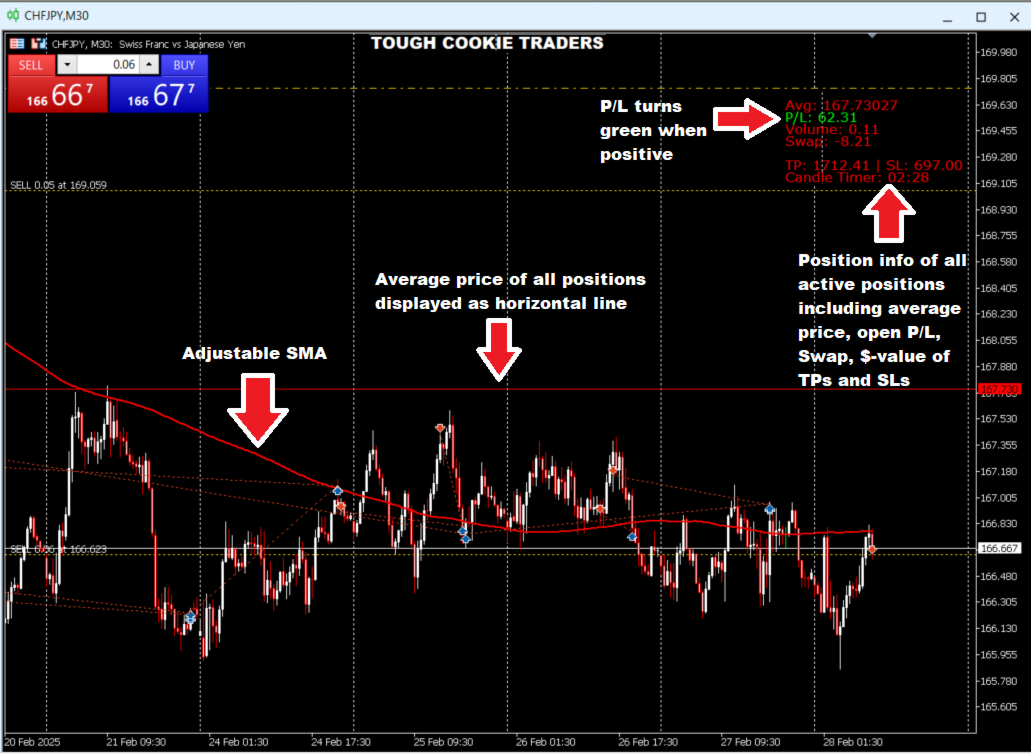
The ToughCookie Indicator is a powerful and versatile tool designed specifically for traders employing Dollar-Cost Averaging (DCA) strategies. This indicator enhances your trading experience by providing detailed position information, visualizing the average entry price as a horizontal line, and integrating a customizable Simple Moving Average (SMA) for trend and entry identification. Ideal for both novice and experienced traders, ToughCookie streamlines decision-making and offers real-time insights into your trades.
- Average Price Visualization: Displays the weighted average price of all open positions on the chart as a red horizontal line, helping you track your break-even point effortlessly.
- 200-Period SMA: Includes a configurable 200-period SMA (default) to identify trends and potential entry/exit points, with customizable color, thickness, and style.
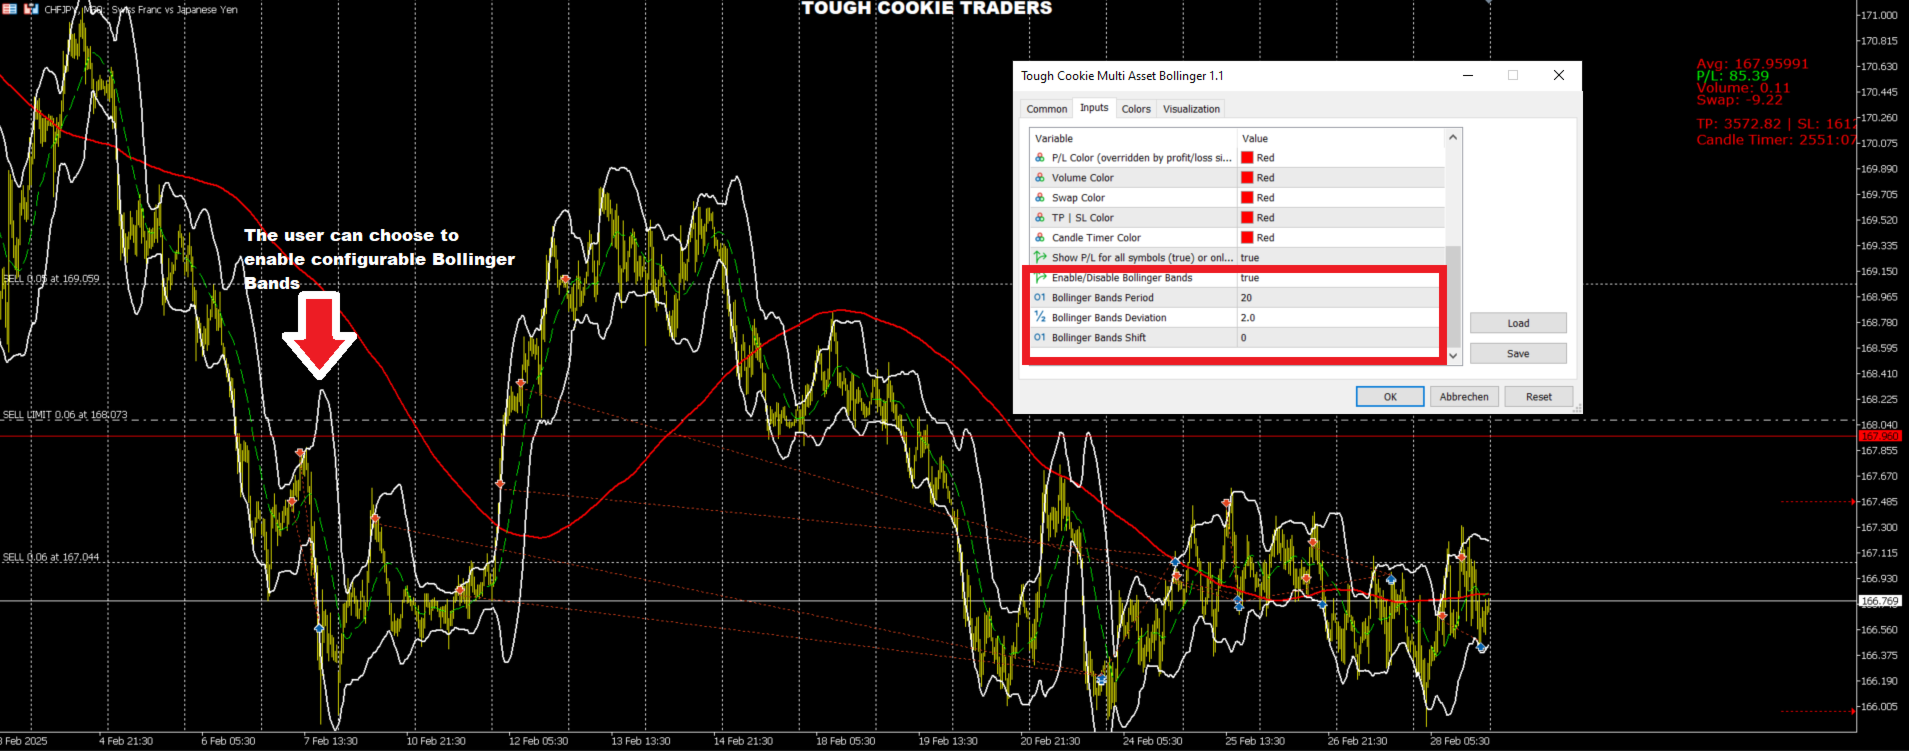
- Bollinger Bands: The user can choose to enable configurable Bollinger Bands for better entry- and exit- identification.
- Detailed Position Info: Shows critical metrics including:
- Average Entry Price
- Total Profit/Loss (P/L) with dynamic color (Lime for positive, Red for negative)
- Total Volume
- Total Swap
- Take Profit (TP) and Stop Loss (SL) values
- Candle Timer: Displays a real-time countdown to the next candle close, aiding in timing your trades.
- Alert System: Provides popup and push notifications when the SMA crosses the average price, configurable via inputs.
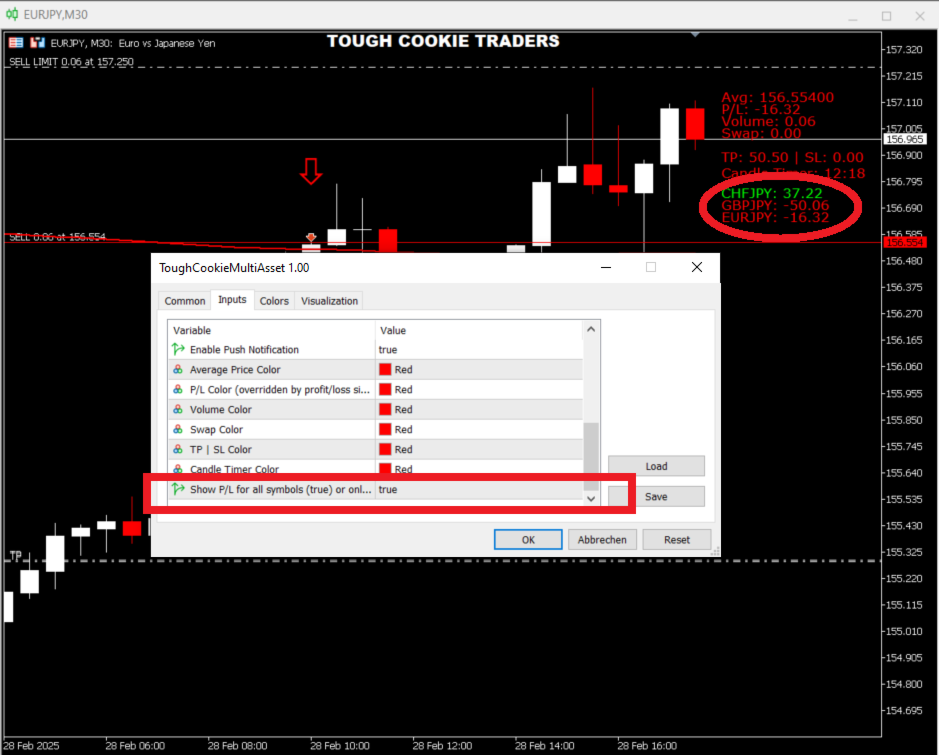
- Symbol P/L Flexibility:
- Option to display P/L for the current chart symbol only (default).
- Option to show P/L for all traded symbols, with each symbol listed below position info, color-coded (Lime for profit, Red for loss).
- User Customization: Extensive input parameters to tailor colors, fonts, sizes, and display preferences to your trading style.
ToughCookie calculates the average price of your open positions and plots it as a horizontal line, offering a clear visual cue for your DCA strategy’s performance. The integrated SMA helps you align your entries with market trends, while the detailed position info panel provides a snapshot of your trade health. The candle timer keeps you synchronized with market movements, and the optional multi-symbol P/L display allows you to monitor all your active trades across different instruments. Alerts enhance reactivity to market shifts, making this indicator a comprehensive tool for DCA traders.
- Enhanced Decision-Making: Real-time data and trend indicators empower you to make informed trading decisions.
- Time-Saving: Consolidates essential information in one place, reducing the need to switch between charts or tools.
- Flexibility: Customizable settings cater to individual preferences and trading strategies.
- Multi-Asset Support: Monitor performance across multiple symbols with a single indicator instance.
- User-Friendly: Intuitive design with clear visuals and optional alerts for busy traders.
- Set ShowAllSymbolsPL = true to monitor all your open positions across different symbols.
- Adjust SMA_Period, SMA_Color, and other SMA settings to match your trend analysis preferences.
- Use the candle timer to time your entries or exits with precision.
- Enable alerts to stay notified of SMA crossovers, especially for DCA re-entry points.
For questions, support, or feature requests, contact the author via X. Link is the description of the indicator when its applied to a chart.
Disclaimers
Trading the financial markets involves the risk of losing more than your initial deposit. You take full responsibility of your actions. Past performance, does not indicate future results, and the author makes no warranties, expressed or implied, or representation as to the accuracy or profitability of the indicator. Please seek professional advice if needed.