No Repaint Bext
- Indicatori
- Andrey Kozak
- Versione: 1.0
- Attivazioni: 20
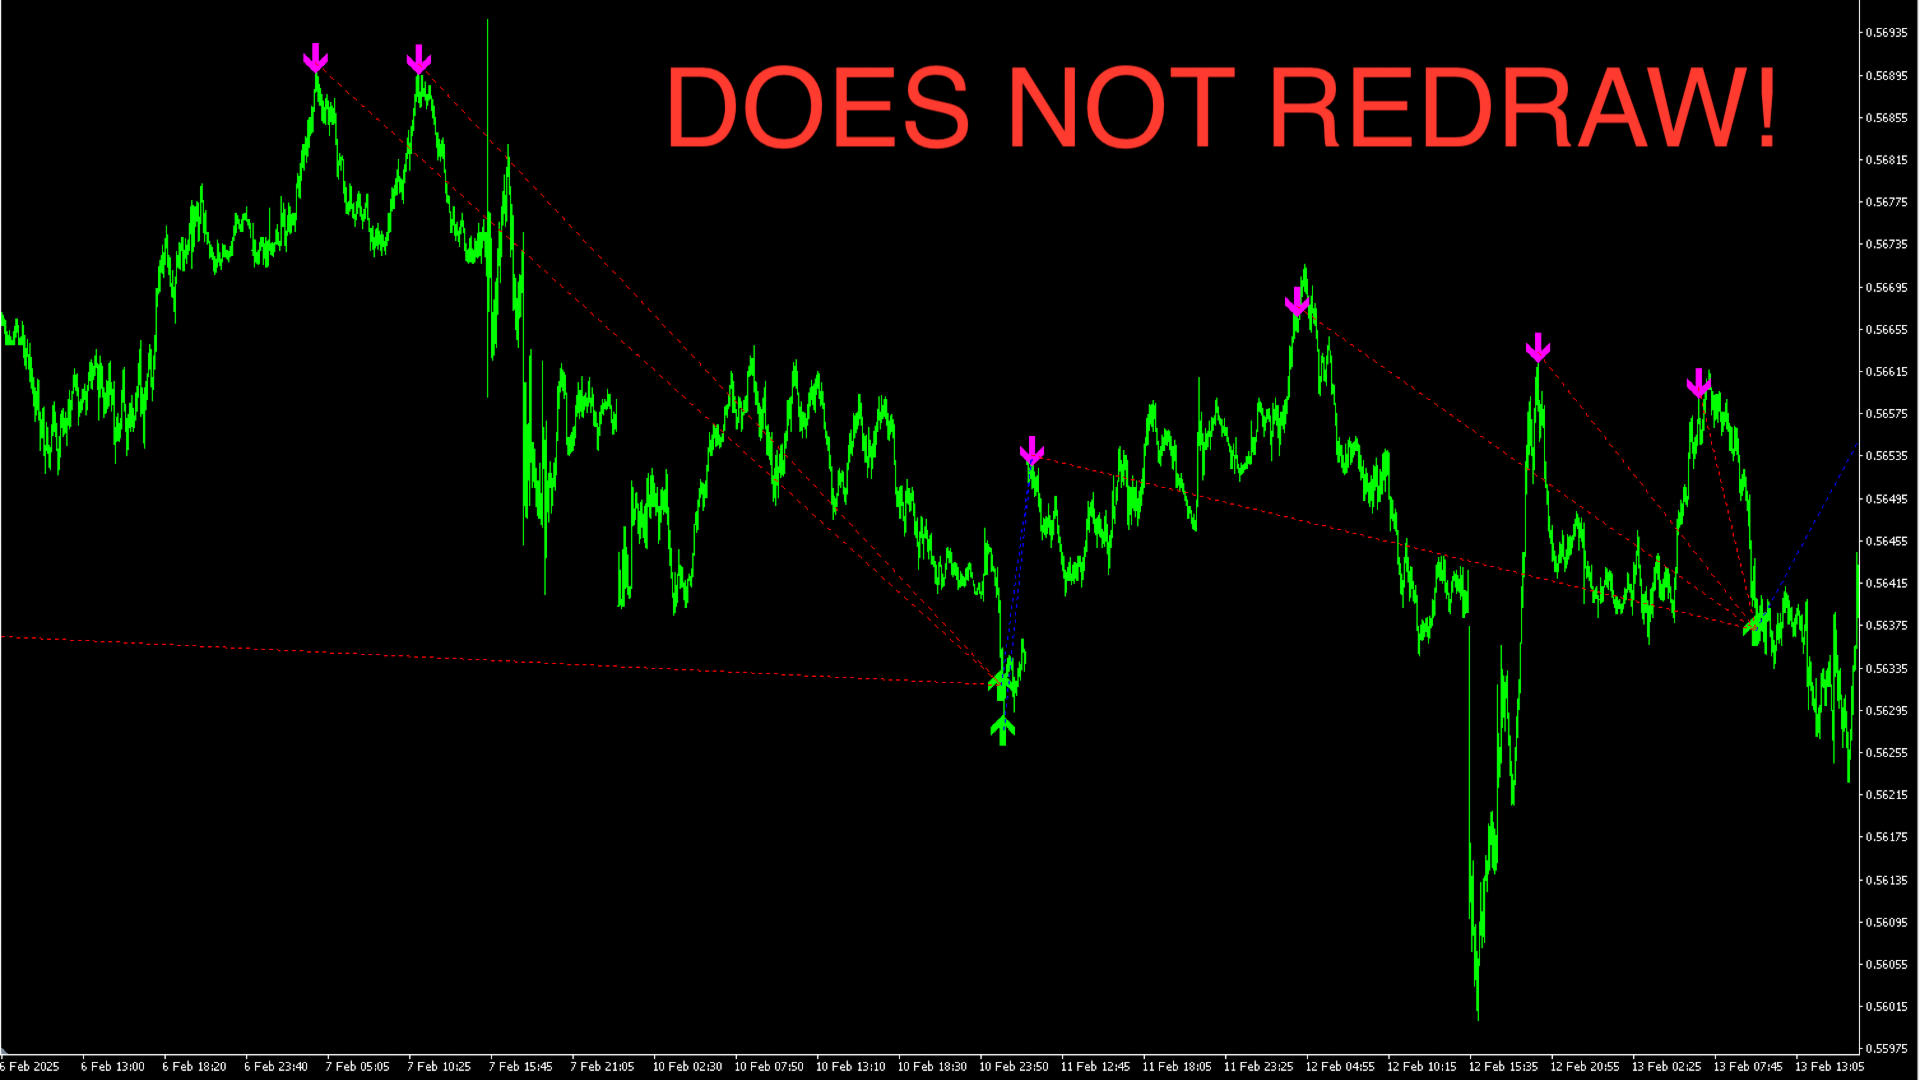
No Repaint Bext is a ready-made trading system. Shows when to open and when to close trades, as well as in which direction. Every time a green arrow appears, you need to open a buy trade. Close all buy trades when a red arrow appears. The same goes for the opposite direction, every time a red arrow appears, open sell trades and close them all when a green arrow appears. We use the M5 timeframe for trading. You can trade on any cozy pair.
This indicator does not repaint and practically does not lag, except for the natural condition (wait until the bar is completed). It uses the RSI filter and two classic reversal patterns (absorption, pin bar) - this allows you to see the reversal almost at the moment of its occurrence.
How to use the indicator for effective trading?
- We trade on any currency pair (we tested on GBPUSD and EURUSD)
- Timeframe M5
- Initial balance from $500
- Trading lot is 0.01
- Every time a green arrow appears, we open a buy trade. We close all open buy trades when a red arrow appears.
- Every time a red arrow appears, we open a sell trade. We close all open sell trades when a green arrow appears.
Indicator settings:
RSI_Period - Default value: 14
Description: RSI (Relative Strength Index) period used for the filter. For example, with a value of 14, RSI calculates averaging on 14 bars. The longer the period, the “smoother” the RSI will be (fewer false positives), but the signals may come a little later.
RSI_BuyLevel - Default value: 30.0
Description: The RSI level below which the market is considered to be "oversold" and a bullish (buy) signal is allowed in the presence of a corresponding candlestick pattern. If RSI falls below 30 and a bullish pattern (engulfing or pin bar) appears, the indicator gives a buy signal (green arrow). By increasing RSI_BuyLevel (for example, to 35 or 40), you will receive more (and earlier) buy signals, but risk increasing the number of false ones. By decreasing the level (say, to 20), you will receive signals less often, but they will be "more reliable".
RSI_SellLevel - Default value: 70.0
Description: The RSI level above which the market is considered to be "overbought" and in the presence of a bearish (sell) pattern, a sell signal is formed (crimson arrow). Similar to RSI_BuyLevel, if you decrease the value (e.g. 65 or 60), there will be more sell signals (and possibly earlier entries), but the risk of false positives will increase.
PinBarRatio - Default value: 3.0
Description: The ratio that determines how many times the "long shadow" of the pin bar should be larger than the body of the candle. For example, if PinBarRatio = 3.0, then the lower shadow (for a bullish pin bar) should be at least three times larger than the body. If you decrease PinBarRatio, then the criterion for the pin bar will become softer, and the indicator will find more "pin bars", but they may not be as obvious on the chart (more false ones). If you increase PinBarRatio, the signals will be less frequent, but the patterns will be clearer.
UseEngulfing - Default value: true
Description: Enables/disables checking for the Engulfing pattern. If true, the indicator will look for bullish/bearish engulfing and generate corresponding signals subject to the RSI filter. If false, the indicator ignores engulfing patterns and does not generate signals from them.
UsePinBar - Default value: true
Description: Enables/disables checking for the Pin Bar pattern. If true, the indicator looks for bullish/bearish pin bars. If false, pin bar signals are not taken into account.
EnablePushNotifications - Default value: false
Description: Enables/disables sending push notifications (to the MetaTrader mobile application) when a new signal (buy or sell) appears. To do this, you need to have the correct push notification data set in the terminal settings.
EnableEmailNotifications - Default value: false
Description: Enables/disables sending e-mail when a signal appears. Similarly, you need to configure the mail client in MetaTrader to work.