Similar Price Action
- Indicatori
- Lorentzos Roussos
- Versione: 1.1
- Aggiornato: 3 marzo 2025
- Attivazioni: 5
Indicatore di azione dei prezzi simili
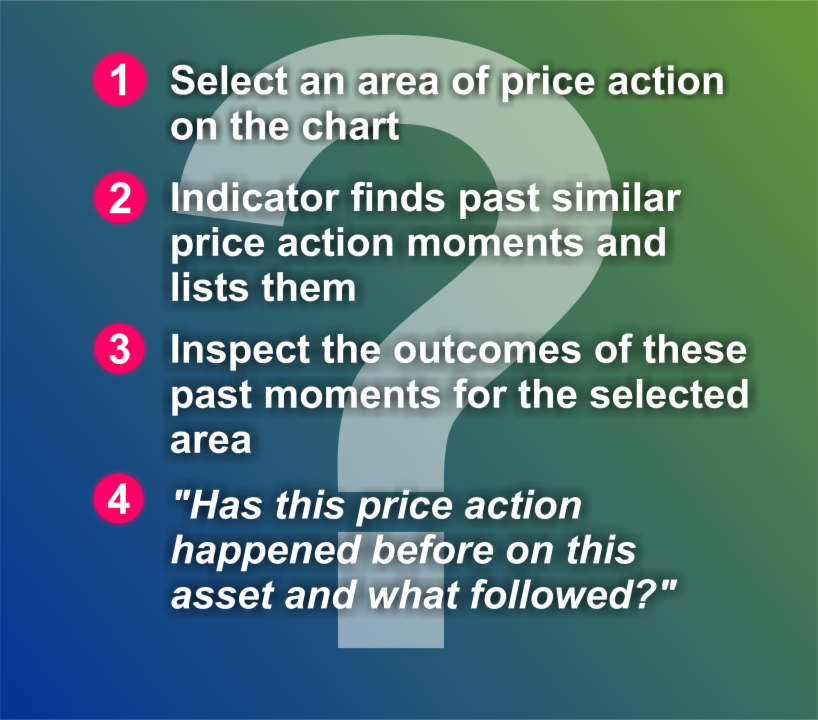
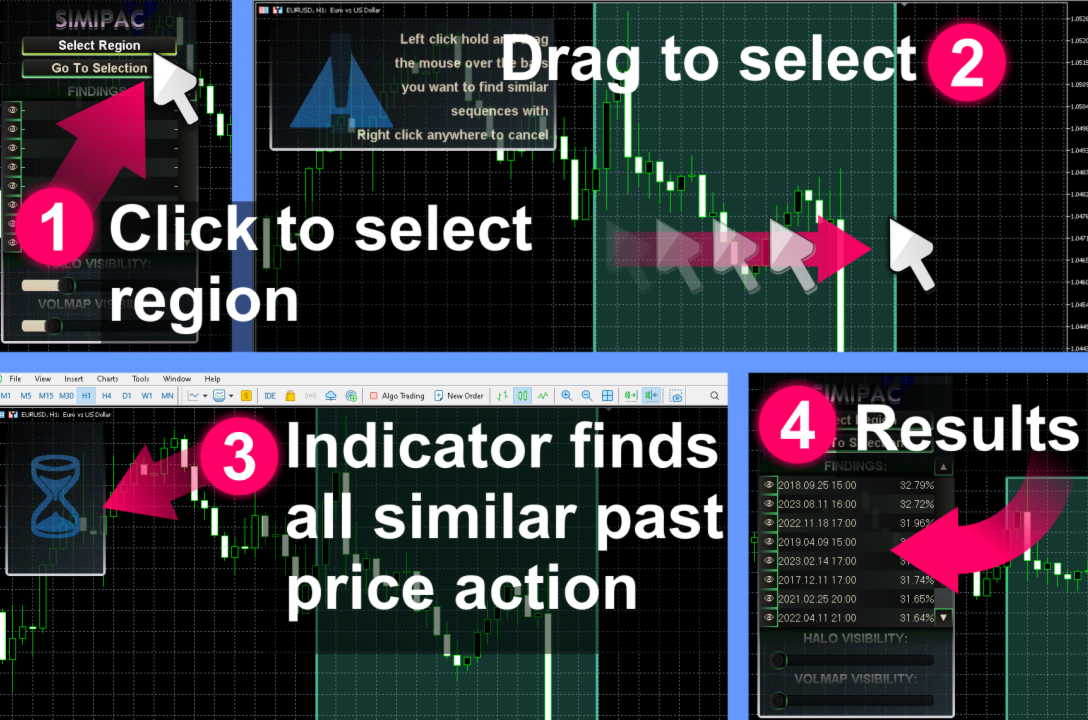
L'azione dei prezzi simile troverà sequenze passate di modelli di candele il più possibile simili a un'area del grafico che hai selezionato.
L'indicatore eseguirà una ricerca a partire da subito prima della prima candela della regione di azione dei prezzi che hai selezionato fino alla prima barra più vecchia del grafico.
Ci sono diversi criteri per valutare la somiglianza tra 2 sequenze:
- Le sequenze devono essere identiche in lunghezza, se la regione selezionata è larga 20 candele, anche tutti i risultati corrispondenti dovranno essere larghi 20 candele. Puoi selezionare tutte le candele che desideri.
- Le sequenze saranno confrontate visivamente in base alla loro dimensione da Alta a Bassa
- Le sequenze saranno confrontate visivamente in base alla loro dimensione e direzione da Apertura a Chiusura. Se una barra candlestick è rialzista per una sequenza e ribassista per l'altra, il punteggio è impostato su 0,0
- Le sequenze hanno un set di medie mobili veloci e lente che vengono confrontate sul loro delta. Il delta può essere confrontato relativamente all'interno di quella regione o in modo assoluto sull'intero asset (modalità relative e assolute)
- Le sequenze hanno un set di ATR veloci e lenti da confrontare per la loro volatilità. Allo stesso modo, il confronto può essere relativo o assoluto.
- Le sequenze hanno un set di RSI veloci e lenti da confrontare per la loro forza locale.
- Tutti i precedenti sono mescolati per una valutazione finale in cui ogni componente è ponderata da un coefficiente. I coefficienti e i metodi di confronto sono disponibili negli input dell'indicatore.
Il motore di ricerca dell'indicatore, simipac, analizzerà ogni possibile sequenza candlestick nel passato senza interrompere l'ordine delle candele.
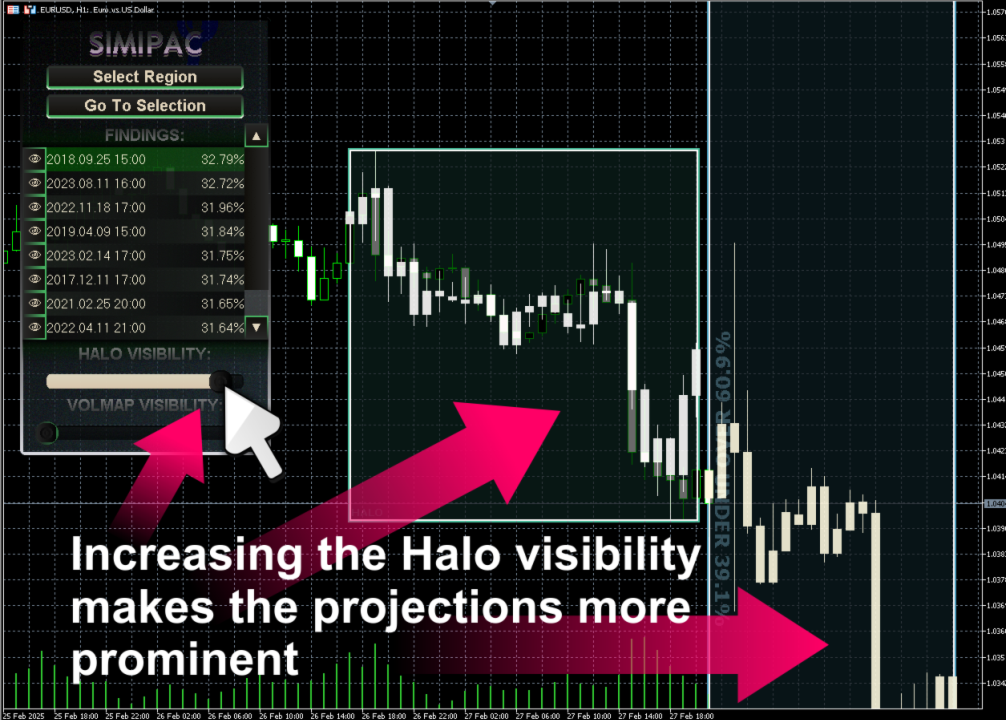
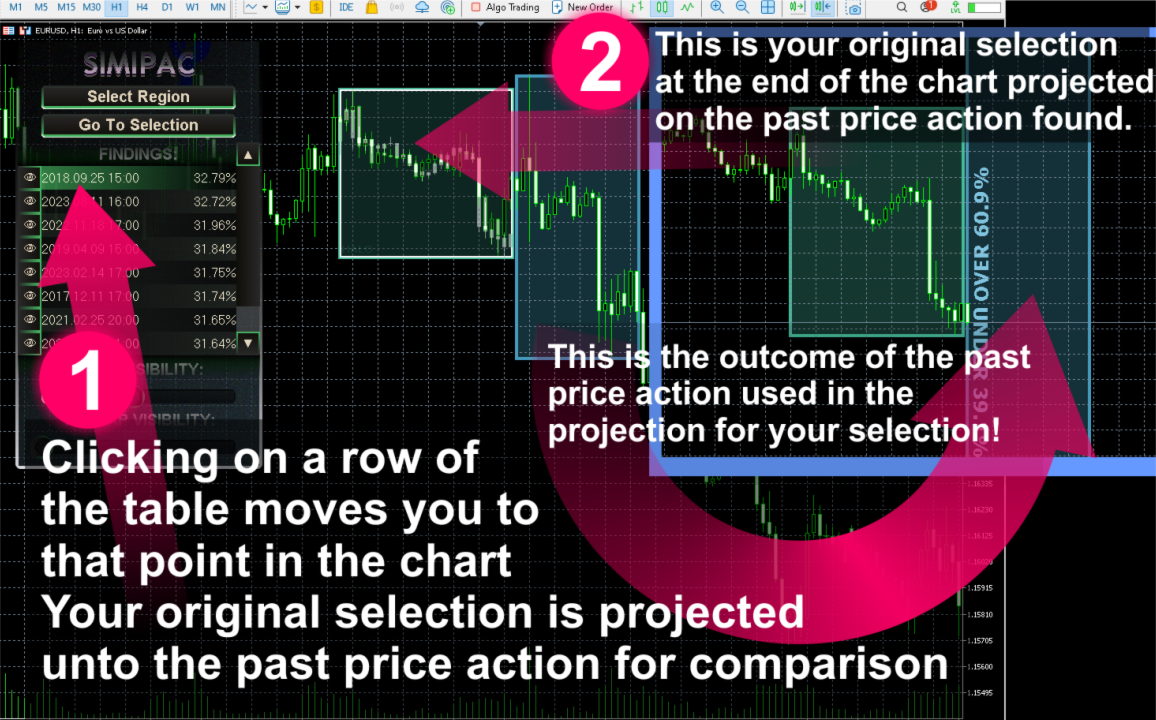
La migliore di queste sequenze verrà conservata per consentirti di ispezionarla. Puoi regolare quante sequenze vengono conservate nella tabella dei risultati dalla schermata di input.
Noterai che l'indicatore memorizza anche un certo numero di barre di candele che iniziano dopo ogni sequenza, puoi anche modificare la quantità di barre che vengono mantenute come "risultato" di ogni sequenza.
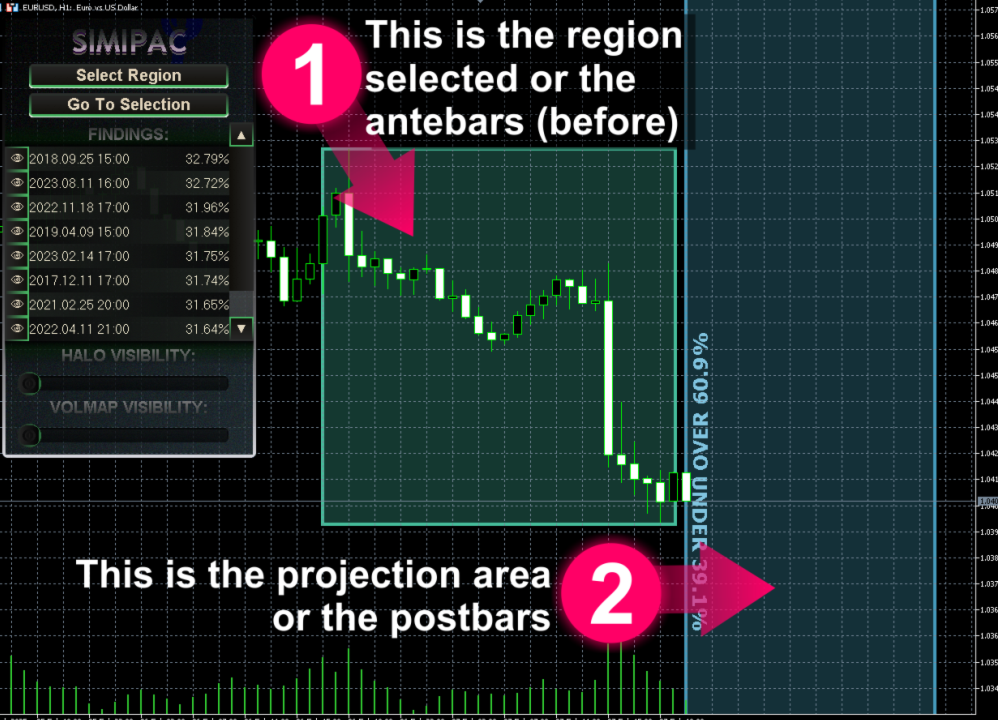
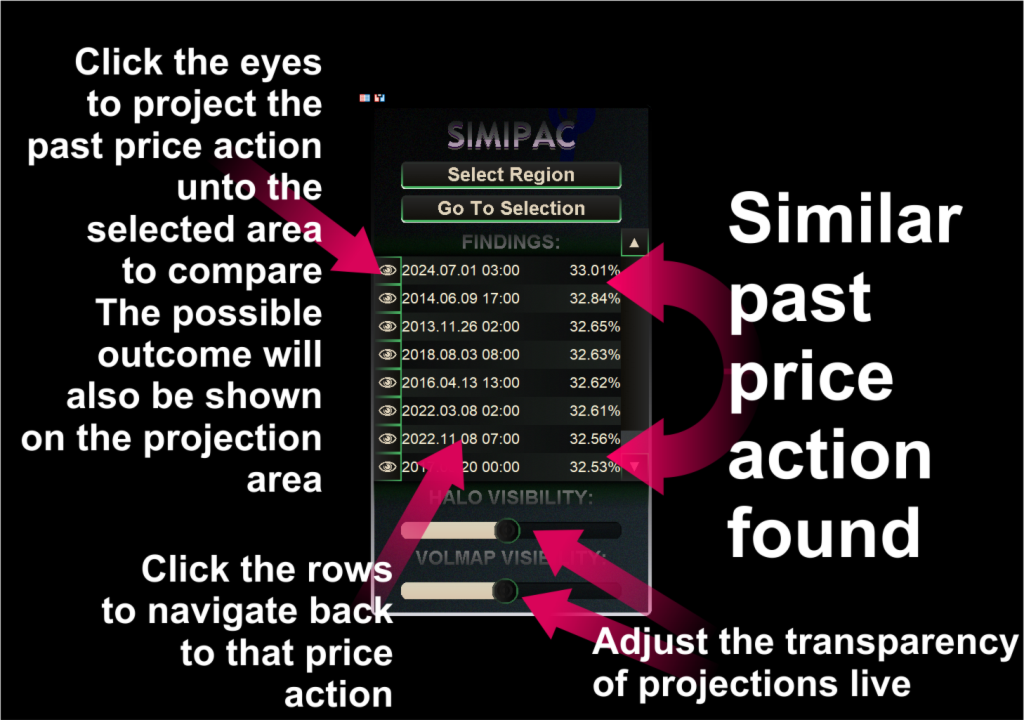
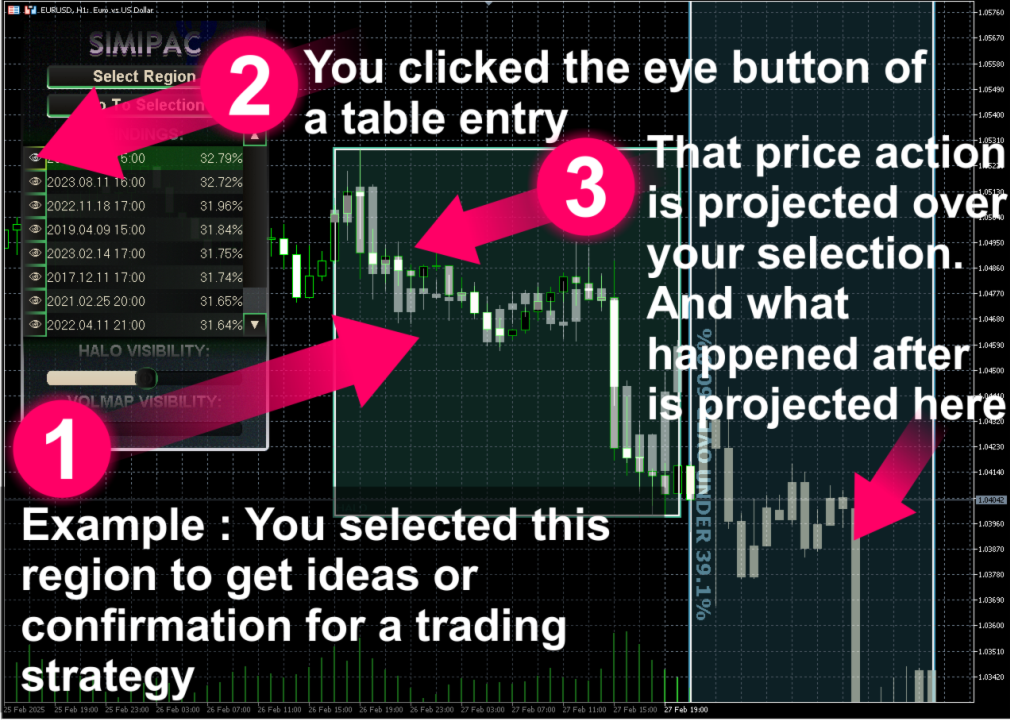
I risultati vengono mantenuti in modo che possano essere proiettati direttamente dopo la tua selezione, consentendoti di vedere come apparirebbe se si verificasse quello scenario.
Durante la proiezione, il grafico non verrà interrotto e la regolazione è relativa alla dimensione dell'intervallo. Quindi tutte le candele dei risultati verranno divise per la rispettiva dimensione delle loro sequenze di azione dei prezzi (alla loro sinistra). Quindi vengono adattate di nuovo alla tua selezione con la sua dimensione dell'intervallo.
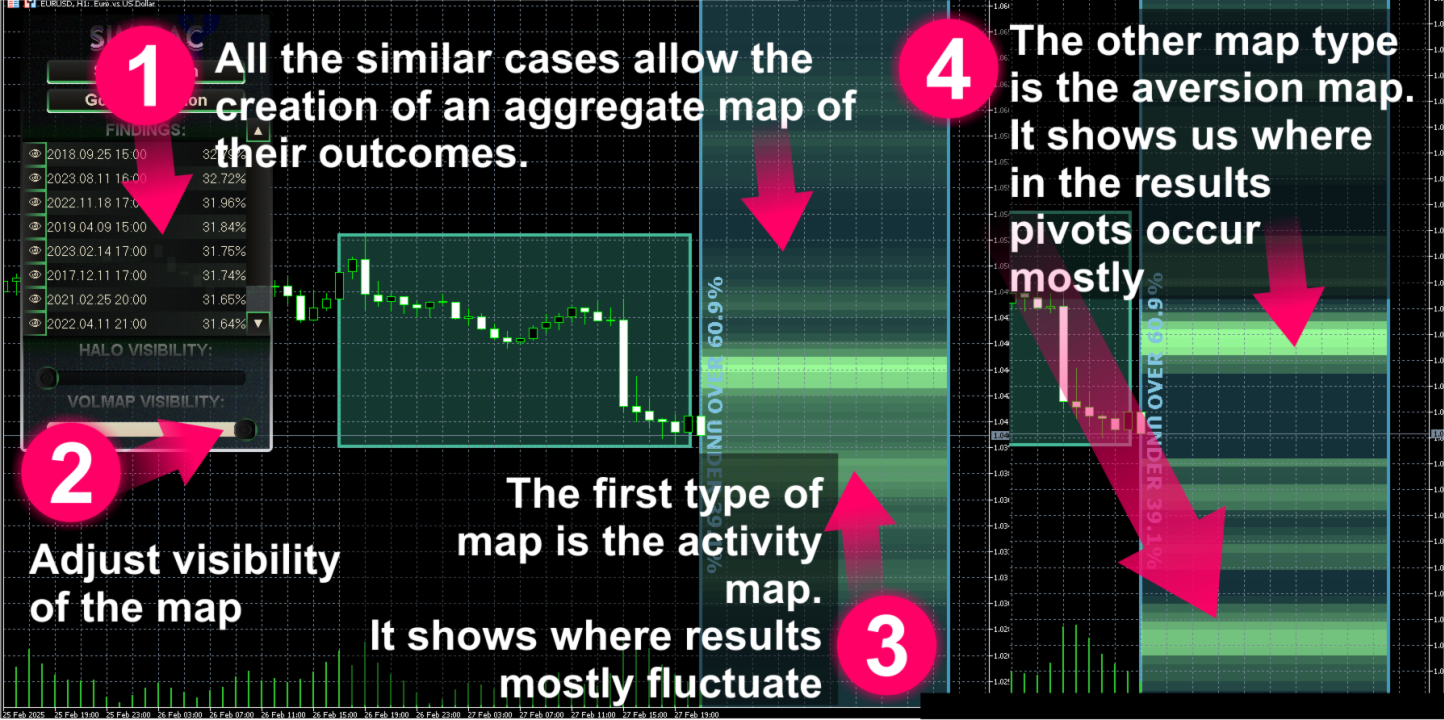
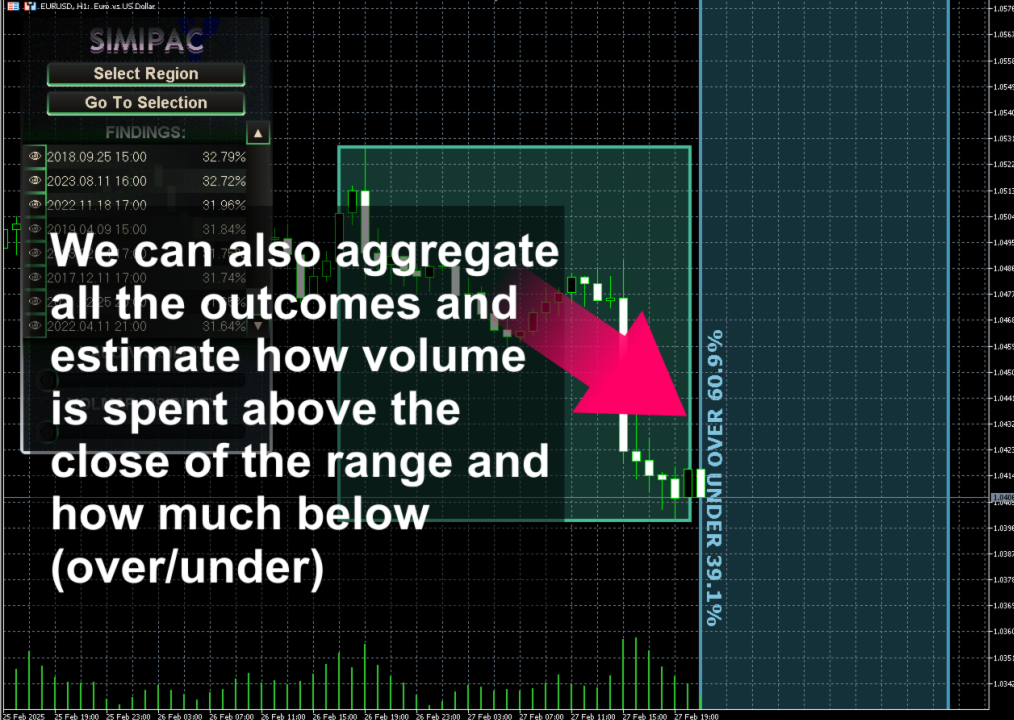
La raccolta di tutti i modelli di barre dei risultati consente un paio di metriche in più.
L'indicazione sopra e sotto ti informa se la maggior parte delle sequenze simili erano sopra il prezzo di chiusura del loro lato sinistro (la parte confrontata) o sotto.
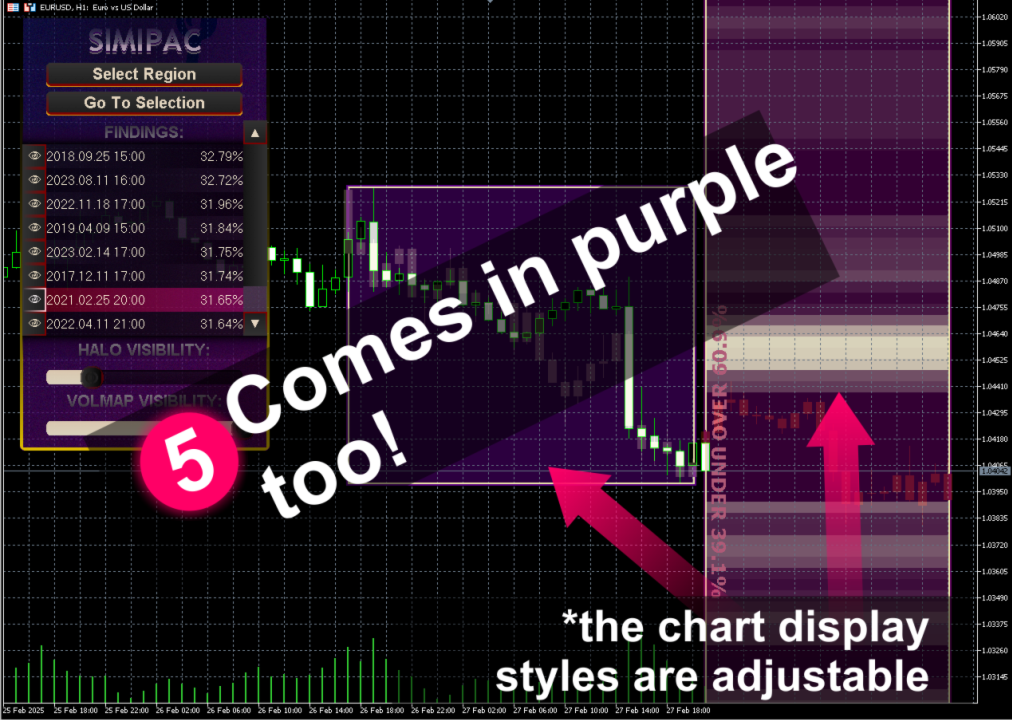
Inoltre abbiamo un tipo di calcolo del profilo di mercato che può indicare dove viene spesa la maggior parte dell'attività nelle sequenze simili raccolte e, al contrario, dove il prezzo tende a oscillare di più. Ogni livello che vedi sulla mappa è stato adattato alle dimensioni dell'area di price action che hai selezionato.
Se hai altre idee non esitare.
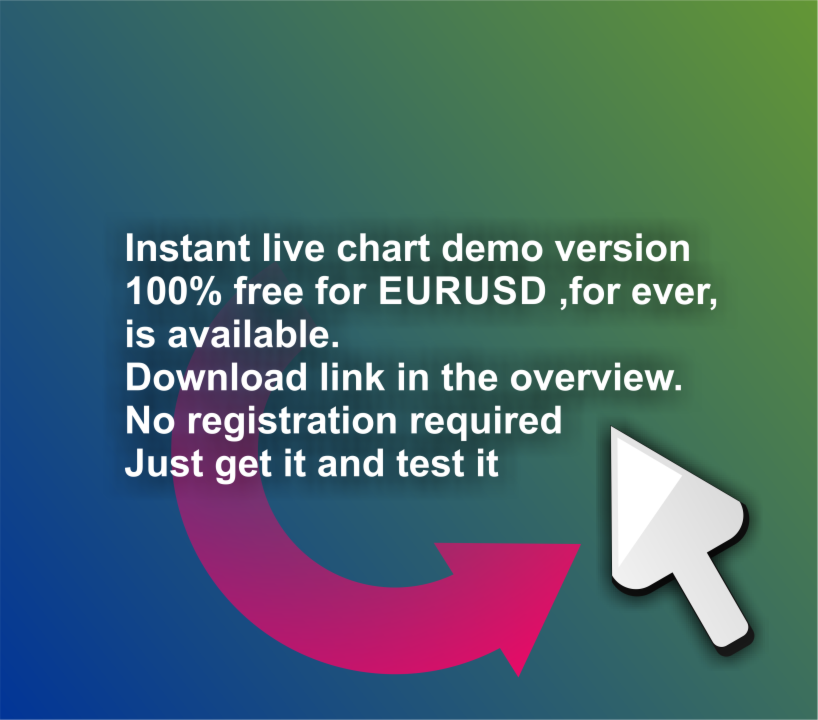
Abbiamo anche una versione gratuita al 100% senza registrazione e senza requisiti che puoi scaricare e testare subito, ma solo per EURUSD.
Quindi se fai trading solo con EURUSD puoi usarla per sempre.
Grazie