MyHistogram
- Indicatori
- Guilherme Emiliao Ferreira
- Versione: 1.0
MYHISTOGRAM MT5
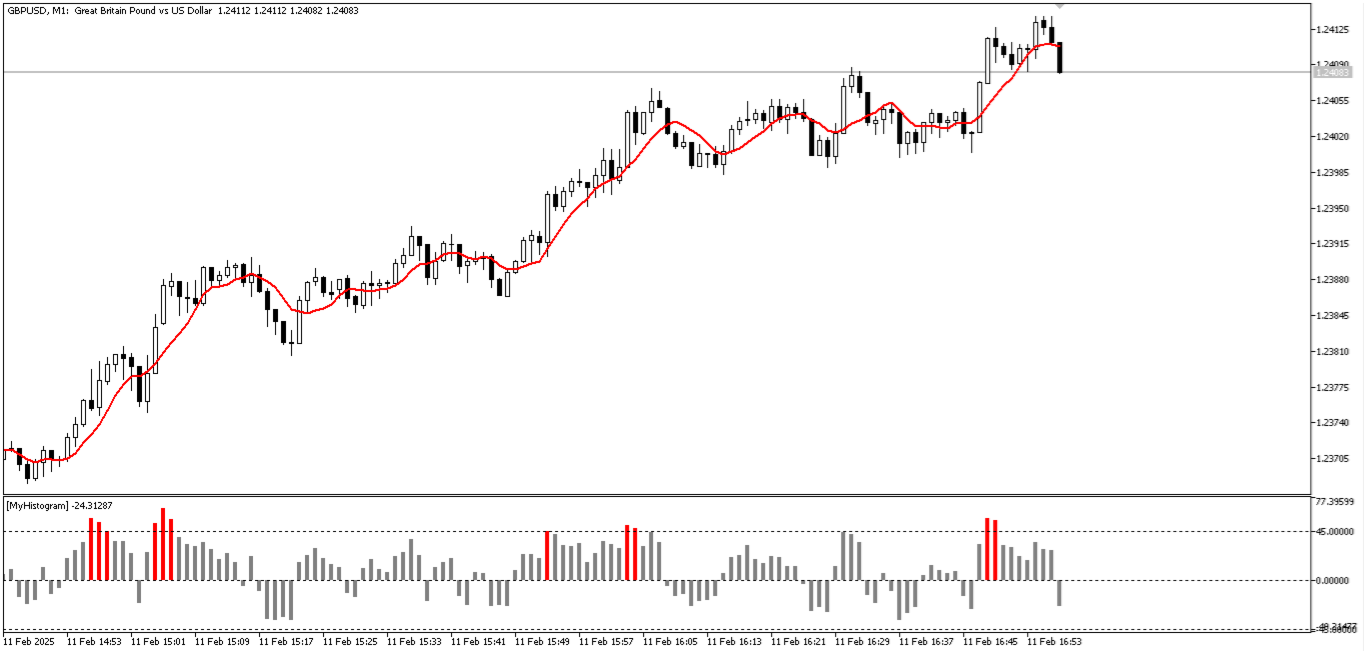
MyHistogram is a powerful technical analysis tool designed to help traders visualize the distance between price extremes and a moving average. By calculating and displaying this distance in a histogram format, it allows traders to quickly assess market trends, spot potential reversals, and make more informed trading decisions. The indicator is highly customizable, enabling users to select different timeframes, moving average types, and applied price settings. Additionally, it features a color-coded system that highlights whether the price distance is within or beyond a specified reference level, providing instant visual cues for better market interpretation.
Key Benefits of MyHistogram
Enhanced Market Analysis :: Helps traders easily visualize the distance between price extremes and a moving average.
Better Decision-Making :: Aids in identifying trends and possible reversal points.
Customizable Visualization :: Color-coded distances improve readability and quick market assessment.
Multi-Timeframe Flexibility :: Can be applied to different timeframes for broader analysis.
Adaptability :: Allows adjustment of parameters to suit various trading strategies.
Improved Accuracy :: Uses moving averages to smooth data, reducing market noise.
Trend Strength Evaluation :: Helps determine if price movement is significant compared to historical averages.
Easy Integration :: Compatible with other indicators and trading systems.
Simplifies Technical Analysis :: Reduces the need for multiple indicators cluttering the chart.
Visual Alerts for Reference Points :: Helps traders react quickly when price moves beyond the set reference level.
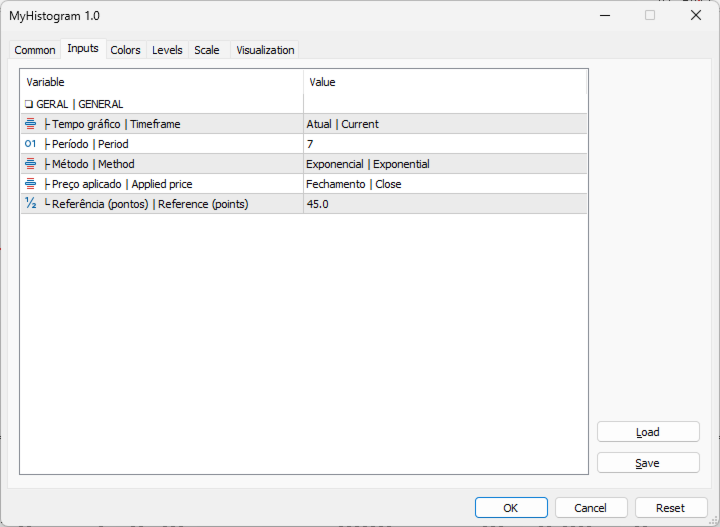
Key Input Parameters and What They Mean for You
Timeframe :: The timeframe to be considered.
Period :: Adjustable period for calculating the moving average.
Method :: Smoothing type. Supports different types (e.g., SMA, EMA, SMMA, LWMA).
Applied price :: Allows selection of price type for the moving average calculation (e.g., Close, Open, High, Low, Median, Typical, Weighted).
Reference (points) :: Defines a threshold distance from the moving average.
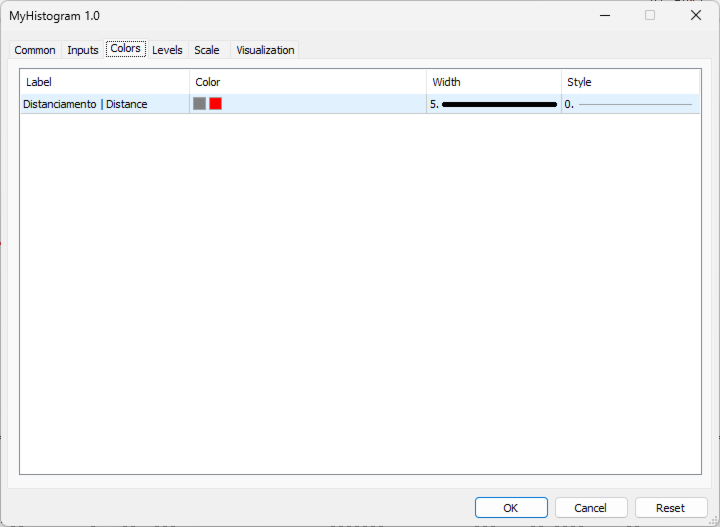
Colors > Distance :: First color is for values within the reference. Second color is for values outside the reference.