• Panoramica
  • Recensioni
  • Commenti

Volume Weighted RSI

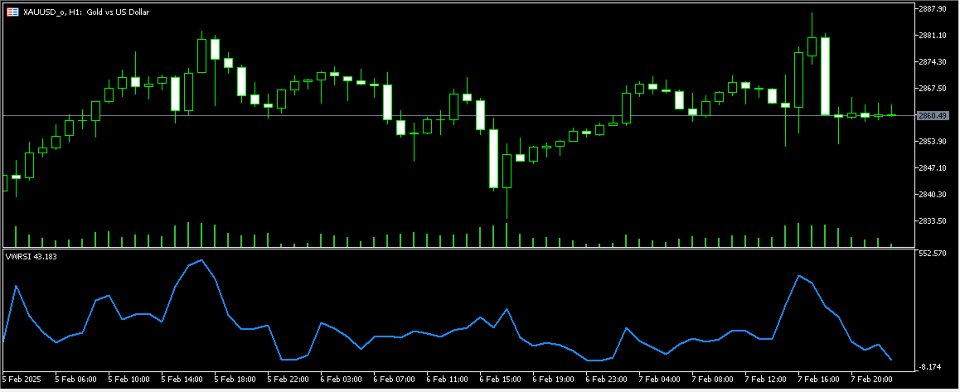
The Volume-Weighted RSI (VW-RSI) is a powerful technical analysis tool that combines the traditional Relative Strength Index (RSI) with volume data to provide a more nuanced view of market conditions. By incorporating volume into the RSI calculation, the VW-RSI offers a unique perspective on price momentum, helping traders identify potential reversals, confirm trends, and filter out false signals.

Below is a detailed explanation of the VW-RSI, its features, and why it stands out as a unique indicator.

1. What is VW-RSI?

The VW-RSI is a modified version of the classic RSI indicator. While the standard RSI measures the magnitude of recent price changes to evaluate overbought or oversold conditions, the VW-RSI adds a volume-weighted component to the calculation. This means that the RSI value is adjusted based on the trading volume during the period, giving more weight to price movements that occur with higher volume.

2. How Does VW-RSI Work?

The VW-RSI calculation involves two main steps:

a. Calculate the Classic RSI

The RSI is calculated using the following formula:

R S I = 100 − ( 100 1 + R S ) RSI=100(1+RS100)

Where:

  • R S RS (Relative Strength) = Average Gain / Average Loss over a specified period (default is 14).

b. Incorporate Volume Weighting

The RSI value is then adjusted by the volume data. The formula for VW-RSI is:

V W - R S I = R S I × ( Current Volume Volume MA ) VW-RSI=RSI×(Volume MACurrent Volume)

Where:

  • Current Volume: The trading volume for the current candle.

  • Volume MA: The moving average of volume over a specified period (default is 14).

This adjustment ensures that price movements accompanied by higher volume have a greater impact on the VW-RSI value.

3. Key Features of VW-RSI

a. Volume Confirmation

One of the most significant advantages of VW-RSI is its ability to confirm price movements using volume. In technical analysis, volume is often considered a leading indicator of market strength. By incorporating volume into the RSI, the VW-RSI helps traders:

  • Confirm the validity of a trend.

  • Identify potential reversals when volume diverges from price.

b. Reduced False Signals

The standard RSI can sometimes generate false signals, especially in choppy or low-volume markets. The VW-RSI filters out these false signals by giving more weight to price movements that occur with significant volume. This makes it particularly useful in volatile markets.

c. Customizable Periods

Like the classic RSI, the VW-RSI allows traders to customize the lookback period for both the RSI and the volume moving average. This flexibility enables traders to adapt the indicator to different timeframes and trading strategies.

d. Overbought/Oversold Levels

The VW-RSI retains the traditional overbought (typically 70) and oversold (typically 30) levels of the RSI. However, these levels are now more reliable because they are adjusted for volume. For example:

  • A VW-RSI reading above 70 with high volume confirms a strong overbought condition.

  • A VW-RSI reading below 30 with high volume confirms a strong oversold condition.

e. Divergence Detection

The VW-RSI is highly effective at detecting divergences between price and momentum. For example:

  • Bullish Divergence: Price makes a lower low, but VW-RSI makes a higher low, indicating weakening selling pressure.

  • Bearish Divergence: Price makes a higher high, but VW-RSI makes a lower high, indicating weakening buying pressure.

4. Why is VW-RSI Unique?

a. Combines Price and Volume

While most momentum indicators focus solely on price, the VW-RSI integrates volume, which is a critical component of market analysis. This combination provides a more holistic view of market conditions.

b. Adaptive to Market Conditions

The VW-RSI dynamically adjusts to changes in volume, making it more responsive to shifts in market sentiment. This adaptability is particularly useful in fast-moving markets.

c. Enhanced Trend Confirmation

By weighting the RSI with volume, the VW-RSI provides stronger confirmation of trends. For example:

  • In an uptrend, rising VW-RSI values with increasing volume confirm bullish momentum.

  • In a downtrend, falling VW-RSI values with increasing volume confirm bearish momentum.

d. Versatility

The VW-RSI can be used across various asset classes (stocks, forex, commodities, etc.) and timeframes (intraday, swing, long-term). It is also compatible with other technical indicators, such as moving averages, Bollinger Bands, and MACD.

5. Practical Applications of VW-RSI

a. Trend Identification

  • Uptrend: VW-RSI remains above 50 with increasing volume.

  • Downtrend: VW-RSI remains below 50 with increasing volume.

b. Overbought/Oversold Conditions

  • Overbought: VW-RSI above 70 with high volume suggests a potential reversal or pullback.

  • Oversold: VW-RSI below 30 with high volume suggests a potential bounce or reversal.

c. Divergence Trading

  • Bullish Divergence: Enter long positions when VW-RSI shows higher lows while price makes lower lows.

  • Bearish Divergence: Enter short positions when VW-RSI shows lower highs while price makes higher highs.

d. Volume Breakouts

  • Use VW-RSI to confirm breakouts. For example, a breakout above a resistance level with a high VW-RSI and increasing volume confirms a strong bullish signal.

6. Comparison with Classic RSI

Feature Classic RSI VW-RSI
Volume Integration No Yes
False Signals More prone to false signals Reduced false signals
Trend Confirmation Relies solely on price Confirms trends with volume
Divergence Detection Effective Enhanced with volume confirmation
Adaptability Less adaptive to market conditions Highly adaptive

7. Limitations of VW-RSI

  • Volume Data Quality: The accuracy of VW-RSI depends on the quality of volume data. In forex markets, where volume is not centralized, this can be a limitation.

  • Lagging Nature: Like all momentum indicators, VW-RSI is lagging and may not predict sudden market moves.

  • Complexity: The additional volume component may make it slightly more complex for beginners compared to the classic RSI.

8. Conclusion

The Volume-Weighted RSI (VW-RSI) is a sophisticated and versatile indicator that enhances the traditional RSI by incorporating volume data. Its unique ability to combine price momentum with volume confirmation makes it a valuable tool for traders seeking to improve their market analysis and decision-making. Whether you're a day trader, swing trader, or long-term investor, the VW-RSI can help you identify trends, confirm signals, and filter out noise in the market.


Trading Strategy Using Volume-Weighted RSI (VW-RSI) for Divergence Trading

One of the most effective ways to use the Volume-Weighted RSI (VW-RSI) is through divergence trading. Divergence occurs when the price of an asset moves in the opposite direction of the VW-RSI, signaling a potential reversal in the current trend. Below is a detailed explanation of how to define and implement a divergence trading strategy using the VW-RSI.

1. What is Divergence?

Divergence is a powerful concept in technical analysis that occurs when the price of an asset moves in one direction, but the indicator (in this case, VW-RSI) moves in the opposite direction. This discrepancy often signals a weakening trend and a potential reversal.

There are two types of divergence:

  • Bullish Divergence: Occurs when the price makes a lower low, but the VW-RSI makes a higher low. This suggests that selling pressure is weakening, and a bullish reversal may be imminent.

  • Bearish Divergence: Occurs when the price makes a higher high, but the VW-RSI makes a lower high. This suggests that buying pressure is weakening, and a bearish reversal may be imminent.

2. Why Use VW-RSI for Divergence?

The VW-RSI adds a volume-weighted component to the classic RSI, making it more reliable for divergence trading. Volume acts as a confirmation tool, ensuring that the divergence signals are backed by significant trading activity. This reduces the likelihood of false signals and increases the accuracy of the strategy.

3. Step-by-Step Divergence Trading Strategy

Step 1: Identify the Trend

Before looking for divergences, determine the overall trend using a trend-following indicator (e.g., moving averages) or price action analysis. This helps you align your trades with the dominant market direction.

  • Uptrend: Higher highs and higher lows in price.

  • Downtrend: Lower highs and lower lows in price.

Step 2: Look for Divergences

On the chart, compare the price action with the VW-RSI to identify divergences.

  • Bullish Divergence:

    • Price makes a lower low.

    • VW-RSI makes a higher low.

    • Volume during the second low should be lower than during the first low (confirming weakening selling pressure).

  • Bearish Divergence:

    • Price makes a higher high.

    • VW-RSI makes a lower high.

    • Volume during the second high should be lower than during the first high (confirming weakening buying pressure).

Step 3: Confirm with Volume

Volume is a critical component of the VW-RSI strategy. Ensure that the divergence is accompanied by declining volume, which confirms the weakening momentum.

  • For bullish divergence, volume should decrease as the price makes a lower low.

  • For bearish divergence, volume should decrease as the price makes a higher high.

Step 4: Enter the Trade

Once the divergence is confirmed, enter the trade in the direction of the expected reversal.

  • Bullish Divergence:

    • Enter a long position when the price breaks above the recent swing high or when the VW-RSI crosses above a key level (e.g., 30).

    • Place a stop-loss below the recent swing low.

  • Bearish Divergence:

    • Enter a short position when the price breaks below the recent swing low or when the VW-RSI crosses below a key level (e.g., 70).

    • Place a stop-loss above the recent swing high.

Step 5: Take Profit

Set a take-profit target based on key support/resistance levels, Fibonacci extensions, or a risk-reward ratio (e.g., 2:1 or 3:1).

4. Advantages of the Strategy

  • High Accuracy: The inclusion of volume in the VW-RSI reduces false signals and increases the reliability of divergence trades.

  • Early Reversal Signals: Divergences often provide early warnings of trend reversals, allowing traders to enter trades before the reversal is fully underway.

  • Versatility: This strategy can be applied to various timeframes (intraday, swing, long-term) and asset classes (stocks, forex, commodities).

5. Limitations of the Strategy

  • Lagging Indicator: Like all momentum indicators, the VW-RSI is lagging and may not predict sudden market moves.

  • Volume Data Quality: In markets with unreliable volume data (e.g., forex), the strategy may be less effective.

  • Requires Confirmation: Divergences should always be confirmed with other technical tools (e.g., trendlines, support/resistance levels) to avoid false signals.

6. Tips for Success

  • Combine with Other Indicators: Use the VW-RSI in conjunction with other indicators (e.g., moving averages, Bollinger Bands) to confirm signals.

  • Practice Risk Management: Always use stop-loss orders and adhere to a risk-reward ratio to protect your capital.

  • Backtest the Strategy: Test the strategy on historical data to evaluate its performance and refine your approach.

7. Conclusion

The Volume-Weighted RSI (VW-RSI) Divergence Strategy is a powerful tool for identifying potential trend reversals. By combining the momentum insights of the RSI with the confirmation power of volume, this strategy provides a robust framework for traders to capitalize on market reversals. Whether you're a beginner or an experienced trader, incorporating the VW-RSI into your trading toolkit can enhance your ability to spot high-probability trading opportunities.
Prodotti consigliati
Donchian Channel DC is the indicator of Donchian Channels, that plots maximum and minimum values of a specific period, besides mean value line. It´s possible to configure simple period for analysis and the indicator will plot all three values. You can trade with this indicator as trend or reversal, according to each strategy. Do not let to test others indicators as soon as others expert advisors.
Follow The Line MT5
Oliver Gideon Amofa Appiah
4.52 (29)
This indicator obeys the popular maxim that: "THE TREND IS YOUR FRIEND" It paints a GREEN line for BUY and also paints a RED line for SELL. (you can change the colors). It gives alarms and alerts of all kinds. IT DOES NOT REPAINT and can be used for all currency pairs and timeframes. Yes, as easy and simple as that. Even a newbie can use it to make great and reliable trades. NB: For best results, get my other premium indicators for more powerful and reliable signals. Get them here: https://www.m
FREE
The indicator detects and displays М. Gartley's Butterfly pattern. The pattern is plotted by the extreme values of the ZigZag indicator (included in the resources, no need to install). After detecting the pattern, the indicator notifies of that by the pop-up window, a mobile notification and an email. The pattern and wave parameters are displayed on the screenshots. The default parameters are used for demonstration purposes only in order to increase the amount of detected patterns. Parameters z
Free automatic Fibonacci is an indicator that automatically plots a Fibonacci retracement based on the number of bars you select on the BarsToScan setting in the indicator. The Fibonacci is automatically updated in real time as new highest and lowest values appears amongst the selected bars. You can select which level values to be displayed in the indicator settings. You can also select the color of the levels thus enabling the trader to be able to attach the indicator several times with differe
FREE
Il Catturatore di Tendenza: La Strategia del Catturatore di Tendenza con Indicatore di Allarme è uno strumento versatile di analisi tecnica che aiuta i trader a identificare le tendenze di mercato e i potenziali punti di ingresso e uscita. Presenta una Strategia dinamica del Catturatore di Tendenza, adattandosi alle condizioni di mercato per una chiara rappresentazione visiva della direzione della tendenza. I trader possono personalizzare i parametri in base alle loro preferenze e tolleranza a
FREE
The Penta-O is a 6-point retracement harmonacci pattern which usually precedes big market movements. Penta-O patterns can expand and repaint quite a bit. To make things easier this indicator implements a twist: it waits for a donchian breakout in the right direction before signaling the trade. The end result is an otherwise repainting indicator with a very reliable trading signal. The donchian breakout period is entered as an input. [ Installation Guide | Update Guide | Troubleshooting | FAQ | A
Mitimom
Danil Poletavkin
The indicator is based on Robert Miner's methodology described in his book "High probability trading strategies" and displays signals along with momentum of 2 timeframes. A Stochastic oscillator is used as a momentum indicator. The settings speak for themselves period_1 is the current timeframe, 'current' period_2 is indicated - the senior timeframe is 4 or 5 times larger than the current one. For example, if the current one is 5 minutes, then the older one will be 20 minutes The rest of the s
FREE
Italiano (Italian) L'indicatore Wormhole per MetaTrader 5 (MT5) non è solo un altro strumento di trading: è il tuo vantaggio competitivo nei mercati finanziari. Progettato sia per trader principianti che professionisti, Wormhole rivoluziona il modo in cui analizzi i dati e prendi decisioni, assicurandoti di essere sempre un passo avanti. Perché hai bisogno dell'indicatore Wormhole Supera la concorrenza: La possibilità di visualizzare due intervalli temporali sullo stesso grafico contemporaneamen
FREE
This indicator is a zero-lag indicator and displays  strength of trend change . True Trend  Oscillator Pro works best in combination with True Trend Moving Average Pro that displays exact trend as is. Oscillator value is exact price change in given direction of the trend. True Trend Moving Average Pro: https://www.mql5.com/en/market/product/103586 If you set PERIOD input parameter to 1 this indicator becomes a sharpshooter for binary options. Developers can use True Trend Oscillator in Exper
FREE
Indicator and Expert Adviser  EA Available in the comments section of this product. Download with Indicator must have indicator installed for EA to work. Mt5 indicator alerts for bollinger band and envelope extremes occurring at the same time. Buy signal alerts occur when A bullish candle has formed below both the lower bollinger band and the lower envelope  Bar must open and close below both these indicators. Sell signal occur when A bear bar is formed above the upper bollinger band and upper
FREE
Are you tired of drawing trendlines every time you're analyzing charts? Or perhaps you would like more consistency in your technical analysis. Then this is for you. This indicator will draw trend lines automatically when dropped on a chart. How it works Works similar to standard deviation channel found on mt4 and mt5. It has 2 parameters: 1. Starting Bar 2. Number of bars for calculation The   starting bar   is the bar which drawing of the trend lines will begin, while the   number of bars for c
FREE
DALA Forecast
Grigorii Matsnev
About the indicator: DALA Forecast is a universal tool for predicting the dynamics of time series of any nature. For prediction, modified methods of nonlinear dynamics analysis are used, on the basis of which a predictive model is built using machine learning methods.  To get the trial version of the indicator, you can contact me in private messages. How to use the indicator: Apply the indicator to your chosen financial instrument or indicator with the settings you need. The prediction will be
FREE
Moving line
Jun Chao Jiang
The one minute chart has a bug, but the one-day chart can still be used after deleting the bug and reloading the indicators, This indicator can be used to determine how far the indicator goes up to place an order to buy, how far it goes down to place an order to sell, and not placing an order until it reaches this distance, which is considered oscillation, open an account gift index
FREE
Cet indicateur innovant de mesure de la force des devises de INFINITY est une aide indispensable pour les scalpers et les commerçants qui négocient à long terme. Le système d'analyse De la force/faiblesse des devises est connu depuis longtemps et utilisé sur le marché par les principaux traders du monde. Tout commerce d'arbitrage n'est pas complet sans cette analyse. Notre indicateur détermine facilement la force des devises sous-jacentes les unes par rapport aux autres. Il affiche des graphiqu
Order Book, known also as Market Book, market depth, Level 2, - is a dynamically updated table with current volumes of orders to buy and to sell specific financial instument at price levels near Bid and Ask. MetaTrader 5 provides the means for receiving market book from your broker, but in real time only, without access to its history. The indicator OrderBook Cumulative Indicator accumulates market book data online and visualizes them on the chart. In addition, the indicator can show the market
RSI On Moving Average Indicator for MT5 The RSI On Moving Average Indicator Merges Moving Average Crossovers with the Relative Strength Index (RSI) to provide a powerful tool for assessing market momentum and trend direction. By integrating these two analytical methods, this indicator enhances trading precision, helping traders identify potential buy and sell opportunities more effectively. This indicator operates with two oscillating lines fluctuating between 0 and 100 , which signal optimal en
FREE
Benvenuti a HiperCube Renko Candles Codice sconto del 25% su Darwinex Zero: DWZ2328770MGM Questo indicatore fornisce informazioni reali sul mercato trasformandolo in Renko Candle Style. Definizione I grafici Renko sono un tipo di grafico finanziario che misura e traccia le variazioni di prezzo, utilizzando mattoni (o barre) per rappresentare i movimenti di prezzo. A differenza dei tradizionali grafici a candela, i grafici Renko non visualizzano informazioni basate sul tempo, concentrandosi esc
FREE
L'indicatore   "Haven Key Levels PDH PDL"   aiuta i trader a visualizzare i livelli chiave sul grafico. Segna automaticamente i seguenti livelli: DO (Daily Open)   — Livello di apertura del giorno. NYM (New York Midnight)   — Livello di mezzanotte di New York. PDH (Previous Day High)   — Massimo del giorno precedente. PDL (Previous Day Low)   — Minimo del giorno precedente. WO (Weekly Open)   — Livello di apertura della settimana. MO (Monthly Open)   — Livello di apertura del mese. PWH (Previou
FREE
Reversal Candles MT5
Nguyen Thanh Cong
5 (4)
Introduction Reversal Candles is a cutting-edge non-repainting   forex indicator designed to predict price reversals with remarkable accuracy through a sophisticated combination of signals. Signal Buy when the last closed candle has a darker color (customizable) and an up arrow is painted below it Sell when the last closed candle has a darker color (customizable) and a down arrow is painted above it
FREE
Half ma
Artem Svistunov
The Half ma arrow indicator for the MetaTrader 5 trading terminal is a simple but effective tool that gives a signal about a change in the current trend. The Half ma indicator looks like a solid dynamic line that changes color at the points where the trend changes. At these points, the indicator draws arrows of the corresponding color and direction.The Half ma arrow indicator for the MT5 terminal is not an independent source of input signals. It will be most effective to use it as a trend filte
L'indicatore   Haven FVG   è uno strumento per l'analisi dei mercati che permette di identificare le aree di inefficienza (Fair Value Gaps, FVG) nel grafico, fornendo ai trader livelli chiave per l'analisi dei prezzi e la presa di decisioni commerciali. Altri prodotti ->  QUI Caratteristiche principali: Impostazioni dei colori individuali: Colore per FVG rialzista   (Bullish FVG Color). Colore per FVG ribassista   (Bearish FVG Color). Visualizzazione flessibile di FVG: Numero massimo di candele
FREE
Important Lines
Terence Gronowski
4.86 (21)
This indicator displays Pivot-Lines, preday high and low, preday close and the minimum and maximum of the previous hour. You just have to put this single indicator to the chart to have all these important lines, no need to setup many single indicators. Why certain lines are important Preday high and low : These are watched by traders who trade in a daily chart. Very often, if price climbs over or falls under a preday low/high there is an acceleration in buying/selling. It is a breakout out of a
FREE
Range Target
Ignacio Agustin Mene Franco
Range Target! indicator that marks the depletion of strength of the candle where it touches the floor and catches a trend, whether it is up or down The indicator has two support lines where it marks the floor and the ceiling. where on the same line marks the entry for rise or fall, the lines have Gold and Blue colors the gold line shows the purchase the blue line shows the sale works for any season works for forex markets works for synthetic index markets! Good Profit, World Investor.
Basic Harmonic Pattern MT5
Mehran Sepah Mansoor
4.77 (75)
Questo indicatore identifica i   pattern armonici   più popolari che predicono i punti di inversione del mercato. Questi modelli armonici sono formazioni di prezzo che si ripetono costantemente nel mercato forex e suggeriscono possibili movimenti di prezzo futuri /   Versione MT4 gratuita Inoltre, questo indicatore è dotato di un segnale di entrata nel mercato e di vari take profit e stop loss. Va notato che, sebbene l'indicatore di pattern armonico possa fornire segnali di acquisto/vendita da
FREE
Indicatore Heiken Ashi MT5 Migliora la tua analisi di mercato con l'indicatore Heiken Ashi MT5. Questo potente strumento trasforma i dati di prezzo standard in candele più fluide e orientate al trend, facilitando l'identificazione delle tendenze di mercato e dei potenziali punti di inversione. Caratteristiche principali: Chiara identificazione dei trend: Distingui visivamente i trend rialzisti e ribassisti attraverso diversi colori delle candele. Riduzione del rumore: Filtra le fluttuazioni di
FREE
The indicator highlights the points that a professional trader sees in ordinary indicators. VisualVol visually displays different volatility indicators on a single scale and a common align. Highlights the excess of volume indicators in color. At the same time, Tick and Real Volume, Actual range, ATR, candle size and return (open-close difference) can be displayed. Thanks to VisualVol, you will see the market periods and the right time for different trading operations. This version is intended f
FREE
Introduction This indicator detects volume spread patterns for buy and sell opportunity. The patterns include demand and supply patterns. You might use each pattern for trading. However, these patterns are best used to detect the demand zone (=accumulation area) and supply zone (=distribution area). Demand pattern indicates generally potential buying opportunity. Supply pattern indicates generally potential selling opportunity. These are the underlying patterns rather than direct price action. T
FREE
Noize Absorption Index - is the manual trading system that measures the difference of pressure between bears forces and bulls forces. Green line - is a noize free index that showing curent situation. Zero value of index shows totally choppy/flat market.Values above zero level shows how powerfull bullish wave is and values below zero measures bearish forces.Up arrow appears on bearish market when it's ready to reverse, dn arrow appears on weak bullish market, as a result of reverse expectation.
Best SAR MT5
Ashkan Hazegh Nikrou
4.33 (3)
Descrizione:  siamo felici di presentare il nostro nuovo indicatore gratuito basato su uno degli indicatori professionali e popolari nel mercato forex (PSAR) questo indicatore è una nuova modifica sull'indicatore SAR parabolico originale, nell'indicatore pro SAR puoi vedere l'incrocio tra i punti e il grafico dei prezzi, questo il crossover non è un segnale ma parla del potenziale di fine movimento, puoi iniziare a comprare con un nuovo punto blu e posizionare lo stop loss un atr prima del pri
FREE
Coral Indi
Dinh Duong Luong
Coral trend is   a trend-following indicator that is widely popular among FOREX traders . It is usually used as a confluence with other indicators. It uses combinations of moving averages with complex smoothing formulas! It has two configurable parameters: Coefficient   - smoothing ratio (*) Applied price Calculation: Coral = (-0.064) * B6 + 0.672 * B5 - 2.352 * B4 + 2.744 * B3
FREE
Gli utenti di questo prodotto hanno anche acquistato
Trend Screener Pro MT5
STE S.S.COMPANY
4.85 (79)
Indicatore di tendenza, soluzione unica rivoluzionaria per il trading di tendenze e il filtraggio con tutte le importanti funzionalità di tendenza integrate in un unico strumento! È un indicatore multi-timeframe e multi-valuta al 100% non ridipingibile che può essere utilizzato su tutti i simboli/strumenti: forex, materie prime, criptovalute, indici e azioni. Trend Screener è un indicatore di tendenza che segue un indicatore efficiente che fornisce segnali di tendenza a freccia con punti nel gra
Moneytron — профессиональный сигнальный индикатор тренда Индикатор Moneytron предназначен для тех, кто хочет зарабатывать стабильно и системно, торгуя по тренду. Он автоматически определяет: • Точки входа (Buy/Sell сигналы) • 3 уровня тейк-профита (TP1, TP2, TP3) • 3 уровня стоп-лосса (SL1, SL2, SL3) • Показывает реальную статистику успешности сделок прямо на графике Особенности: • Работает на всех валютных парах и металлах • Идеален для таймфреймов M30, H1 и выше • Подходит как для начинающи
Golden Trend Indicator MT5
Noha Mohamed Fathy Younes Badr
4.88 (17)
Golden Trend indicator  is The best indicator for predicting trend movement this indicator never lags and never repaints and never back paints    and give  arrow buy and sell    before the candle appear  and it will help you and  will make your trading decisions clearer its work on all currencies and  gold and crypto and all time frame This unique  indicator uses very secret algorithms to catch the  trends, so you can trade using this indicator and see the trend clear on charts  manual guide and
Algo Pumping
Ihor Otkydach
5 (6)
PUMPING STATION – La tua strategia personale "all inclusive" Ti presentiamo PUMPING STATION — un indicatore Forex rivoluzionario che trasformerà il tuo modo di fare trading in un’esperienza efficace ed entusiasmante. Non si tratta solo di un assistente, ma di un vero e proprio sistema di trading completo con potenti algoritmi che ti aiuteranno a operare in modo più stabile. Acquistando questo prodotto, riceverai GRATUITAMENTE: File di configurazione esclusivi: per un'impostazione automatica e pr
Support And Resistance Screener è in un indicatore di livello per MetaTrader che fornisce più strumenti all'interno di un indicatore. Gli strumenti disponibili sono: 1. Screener della struttura del mercato. 2. Zona di ritiro rialzista. 3. Zona di ritiro ribassista. 4. Punti pivot giornalieri 5. Punti pivot settimanali 6. Punti pivot mensili 7. Forte supporto e resistenza basati sul modello e sul volume armonici. 8. Zone a livello di banca. OFFERTA A TEMPO LIMITATO: il supporto HV e l'indicatore
FX Power MT5 NG
Daniel Stein
5 (13)
FX Power: Analizza la Forza delle Valute per Decisioni di Trading Più Intelligenti Panoramica FX Power è lo strumento essenziale per comprendere la reale forza delle principali valute e dell'oro in qualsiasi condizione di mercato. Identificando le valute forti da comprare e quelle deboli da vendere, FX Power semplifica le decisioni di trading e rivela opportunità ad alta probabilità. Che tu segua le tendenze o anticipi inversioni utilizzando valori estremi di Delta, questo strumento si adatta
FX Volume MT5
Daniel Stein
4.82 (17)
FX Volume: Scopri il Vero Sentimento di Mercato dalla Prospettiva di un Broker Panoramica Rapida Vuoi portare la tua strategia di trading a un livello superiore? FX Volume ti offre informazioni in tempo reale su come i trader retail e i broker sono posizionati—molto prima che compaiano report in ritardo come il COT. Che tu miri a guadagni costanti o desideri semplicemente un vantaggio più solido sui mercati, FX Volume ti aiuta a individuare grandi squilibri, confermare i breakout e perfezionar
TPSproTREND PrO MT5
Roman Podpora
4.72 (18)
VERSION MT4        —        ИНСТРУКЦИЯ RUS           —        INSTRUCTIONS  ENG Caratteristiche principali: Segnale di ingresso accurato senza rendering! Una volta che il segnale appare, rimane rilevante. Questa è una differenza importante rispetto agli indicatori di ridisegno, che forniscono un segnale e poi lo modificano, con conseguente potenziale perdita dei fondi depositati. Ora puoi entrare nel mercato con maggiore probabilità e precisione. C'è anche la possibilità di colorare le candele
Grabber System MT5
Ihor Otkydach
5 (5)
Ti presento un eccellente indicatore tecnico: Grabber, che funziona come una strategia di trading "tutto incluso", pronta all’uso. In un solo codice sono integrati strumenti potenti per l’analisi tecnica del mercato, segnali di trading (frecce), funzioni di allerta e notifiche push. Ogni acquirente di questo indicatore riceve anche gratuitamente: L’utility Grabber: per la gestione automatica degli ordini aperti Video tutorial passo dopo passo: per imparare a installare, configurare e utilizzare
TPSpro RFI Levels MT5
Roman Podpora
4.55 (20)
L'indicatore che ha ridefinito il trading, è diventato il punto di riferimento per l'analisi dei grafici e ha stabilito nuovi standard nel trading. Zone di inversione /   Zone di volume di picco   /   Zone attive di un grande giocatore     ISTRUZIONI RUS         ISTRUZIONI   ENG   /   Si consiglia l'utilizzo con l'indicatore -   TPSpro TREND PRO Ogni acquirente di questo indicatore riceve inoltre GRATIS: 6 mesi di accesso ai segnali di trading dal servizio RFI SIGNALS: punti di ingresso
FX Levels MT5
Daniel Stein
5 (4)
FX Levels: Supporti e Resistenze di Precisione Eccezionale per Tutti i Mercati Panoramica Rapida Cercate un modo affidabile per individuare livelli di supporto e resistenza in ogni mercato—coppie di valute, indici, azioni o materie prime? FX Levels fonde il metodo tradizionale “Lighthouse” con un approccio dinamico all’avanguardia, offrendo una precisione quasi universale. Basato sulla nostra esperienza reale con i broker e su aggiornamenti automatici giornalieri più quelli in tempo reale, FX
Gold Stuff mt5
Vasiliy Strukov
4.93 (178)
Gold Stuff mt5 è un indicatore di tendenza progettato specificamente per l'oro e può essere utilizzato anche su qualsiasi strumento finanziario. L'indicatore non ridisegna e non è in ritardo. Periodo consigliato H1. Contattami subito dopo l'acquisto per avere le impostazioni e un bonus personale!   I risultati in tempo reale possono essere visualizzati qui.  Puoi ottenere una copia gratuita del nostro indicatore Strong Support e Trend Scanner, per favore scrivi in ​​privato. M   IMPOSTAZIONI
IX Power MT5
Daniel Stein
4.86 (7)
IX Power: Scopri approfondimenti di mercato per indici, materie prime, criptovalute e forex Panoramica IX Power è uno strumento versatile progettato per analizzare la forza di indici, materie prime, criptovalute e simboli forex. Mentre FX Power offre la massima precisione per le coppie di valute utilizzando i dati di tutte le coppie disponibili, IX Power si concentra esclusivamente sui dati di mercato del simbolo sottostante. Questo rende IX Power una scelta eccellente per mercati non correlat
Trade smarter, not harder: Empower your trading with Harmonacci Patterns This is arguably the most complete harmonic price formation auto-recognition indicator you can find for the MetaTrader Platform. It detects 19 different patterns, takes fibonacci projections as seriously as you do, displays the Potential Reversal Zone (PRZ) and finds suitable stop-loss and take-profit levels. [ Installation Guide | Update Guide | Troubleshooting | FAQ | All Products ] It detects 19 different harmonic pri
Matrix Arrow Indicator MT5
Juvenille Emperor Limited
5 (13)
Matrix Arrow Indicator MT5   è un trend unico 10 in 1 che segue un indicatore multi-timeframe al   100% non ridipinto   che può essere utilizzato su tutti i simboli/strumenti:   forex ,   materie prime ,   criptovalute ,   indici ,   azioni .  Matrix Arrow Indicator MT5  determinerà la tendenza attuale nelle sue fasi iniziali, raccogliendo informazioni e dati da un massimo di 10 indicatori standard, che sono: Indice di movimento direzionale medio (ADX) Indice del canale delle materie prime (CCI
Trend Line Map Pro MT5
STE S.S.COMPANY
4.09 (11)
Trend Line Map indicator is an addons for   Trend Screener Indicator . It's working as a scanner for all signals generated by Trend screener ( Trend Line Signals ) . It's a Trend Line Scanner based on Trend Screener Indicator.  If you don't have Trend Screener Pro Indicator,   the Trend Line Map Pro will not work.     LIMITED TIME OFFER : Trend Line Map Indicator is available for only 50 $ and lifetime. ( Original price 125$ ) By accessing to our MQL5 Blog,  you can find all our premium indicat
Questo cruscotto mostra gli ultimi   pattern armonici   disponibili per i simboli selezionati, in modo da risparmiare tempo ed essere più efficienti /   versione MT4 . Indicatore gratuito:   Basic Harmonic Pattern Colonne dell'indicatore Symbol :   vengono visualizzati i simboli selezionati Trend:   rialzista o ribassista Pattern:   tipo di pattern (gartley, butterfly, bat, crab, shark, cypher o ABCD) Entry:   prezzo di ingresso SL:   prezzo di stop loss TP1:   1 prezzo di take profit TP2:
PZ Mean Reversion MT5
PZ TRADING SLU
3 (2)
Indicatore unico che implementa un approccio professionale e quantitativo al trading di reversione. Sfrutta il fatto che il prezzo devia e ritorna alla media in modo prevedibile e misurabile, il che consente regole di entrata e uscita chiare che superano di gran lunga le strategie di trading non quantitative. [ Installation Guide | Update Guide | Troubleshooting | FAQ | All Products ] Segnali di trading chiari Incredibilmente facile da scambiare Colori e dimensioni personalizzabili Implementa l
FX Dynamic: Monitora volatilità e trend con un’analisi ATR personalizzabile Panoramica FX Dynamic è uno strumento potente che sfrutta i calcoli di Average True Range (ATR) per fornire ai trader informazioni impareggiabili sulla volatilità, sia giornaliera che intraday. Impostando soglie di volatilità chiare—ad esempio 80%, 100%, 130%—puoi individuare rapidamente opportunità di profitto o ricevere avvisi quando il mercato supera i range abituali. FX Dynamic si adatta al fuso orario del tuo brok
Innanzitutto, vale la pena sottolineare che questo Strumento di Trading è un Indicatore Non-Ridipingente, Non-Ridisegnante e Non-Laggante, il che lo rende ideale per il trading professionale. Corso online, manuale utente e demo. L'Indicatore Smart Price Action Concepts è uno strumento molto potente sia per i nuovi che per i trader esperti. Racchiude più di 20 utili indicatori in uno solo, combinando idee di trading avanzate come l'Analisi del Trader del Circolo Interno e le Strategie di Tradin
- Lifetime update free Contact me for instruction, any questions! Related Product:  Gold Trade Expert MT5 - Non-repaint - I just sell my products in Elif Kaya Profile, any other websites are stolen old versions, So no any new updates or support. Introduction The breakout and retest strategy is traded support and resistance levels. it involves price breaking through a previous level.  The break and retest strategy is designed to help traders do two main things, the first is to avoid false breako
PZ Support Resistance MT5
PZ TRADING SLU
4.17 (6)
Unlock key market insights with automated support and resistance lines Tired of plotting support and resistance lines? This is a multi-timeframe indicator that detects and plots supports and resistance lines in the chart with the same precision as a human eye would. As price levels are tested over time and its importance increases, the lines become thicker and darker, making price leves easy to glance and evaluate. [ Installation Guide | Update Guide | Troubleshooting | FAQ | All Products ] Boos
Royal Scalping Indicator M5
Vahidreza Heidar Gholami
5 (6)
Royal Scalping Indicator is an advanced price adaptive indicator designed to generate high-quality trading signals. Built-in multi-timeframe and multi-currency capabilities make it even more powerful to have configurations based on different symbols and timeframes. This indicator is perfect for scalp trades as well as swing trades. Royal Scalping is not just an indicator, but a trading strategy itself. Features Price Adaptive Trend Detector Algorithm Multi-Timeframe and Multi-Currency Trend Low
Legend mt5
Vladyslava Shaviernieva
This is an indicator that includes the best basic forex indicators , without redrawing. Based on this data, a sell or buy signal is generated. It does not disappear anywhere after the signal, which gives us the opportunity to see the results on the history. It can be used on any currency pair, crypto, metals, stocks It is best used on an hourly chart, but other periods are also acceptable. The best results for the period H1,H4,daily If customers have any questions, I will answer them and af
Gold Trend 5
Sergei Linskii
3.5 (2)
Gold Trend - è un buon indicatore tecnico azionario. L'algoritmo dell'indicatore analizza il movimento del prezzo di un asset e riflette la volatilità e le potenziali zone di ingresso. I migliori segnali dell'indicatore: - Per VENDERE = istogramma rosso + puntatore SHORT rosso + freccia di segnale gialla nella stessa direzione. - Per l'ACQUISTO = istogramma blu + puntatore LONG blu + freccia di segnale acquatica nella stessa direzione. Vantaggi dell'indicatore: 1. L'indicatore produce seg
Volumatic VIDyA MT5
Duc Hoan Nguyen
5 (2)
Special offer : ALL TOOLS , just $35 each! New tools   will be   $30   for the   first week   or the   first 3 purchases !  Trading Tools Channel on MQL5 : Join my MQL5 channel to update the latest news from me Volumatic VIDYA (Variable Index Dynamic Average) è un indicatore avanzato progettato per monitorare le tendenze e analizzare la pressione di acquisto e vendita in ogni fase di una tendenza. Utilizzando il Variable Index Dynamic Average come tecnica principale di smorzamento dinamico, que
Innanzitutto è importante sottolineare che questo sistema di trading è un indicatore Non-Repainting, Non-Redrawing e Non-Lagging, il che lo rende ideale sia per il trading manuale che per quello automatico. Corso online, manuale e download di preset. Il "Sistema di Trading Smart Trend MT5" è una soluzione completa pensata sia per i trader principianti che per quelli esperti. Combina oltre 10 indicatori premium e offre più di 7 robuste strategie di trading, rendendolo una scelta versatile per div
Quantum TrendPulse
Bogdan Ion Puscasu
5 (13)
Ecco   Quantum TrendPulse   , lo strumento di trading definitivo che combina la potenza di   SuperTrend   ,   RSI   e   Stocastico   in un unico indicatore completo per massimizzare il tuo potenziale di trading. Progettato per i trader che cercano precisione ed efficienza, questo indicatore ti aiuta a identificare con sicurezza le tendenze di mercato, i cambiamenti di momentum e i punti di entrata e uscita ottimali. Caratteristiche principali: Integrazione SuperTrend:   segui facilmente l'andame
Auto Order Block with break of structure based on ICT and Smart Money Concepts (SMC) Futures Break of Structure ( BoS )             Order block ( OB )            Higher time frame Order block / Point of Interest ( POI )    shown on current chart           Fair value Gap ( FVG ) / Imbalance   -  MTF      ( Multi Time Frame )    HH/LL/HL/LH  -  MTF      ( Multi Time Frame )  Choch  MTF      ( Multi Time Frame )  Volume Imbalance     ,  MTF          vIMB Gap’s Power of 3 Equal High / Low’s  
Atomic Analyst MT5
Issam Kassas
4.32 (19)
Innanzitutto, vale la pena sottolineare che questo indicatore di trading non è repaint, non è ridisegno e non presenta ritardi, il che lo rende ideale sia per il trading manuale che per quello automatico. Manuale utente: impostazioni, input e strategia. L'Analista Atomico è un indicatore di azione del prezzo PA che utilizza la forza e il momentum del prezzo per trovare un miglior vantaggio sul mercato. Dotato di filtri avanzati che aiutano a rimuovere rumori e segnali falsi, e aumentare il pote
Altri dall’autore
This trading robot is based on a candlestick pattern and RSI indicator strategy. It looks for candles that have a small body relative to their shadows, indicating indecision in the market. It also checks if these candles are placed at the pivot point.  If the close of one of the next candles breaks the resistance line from below and the RSI is above the MA of RSI, then the robot opens a buy order. If the close of one of the next candles breaks the support line from above and the RSI is below th
FREE
3 Bulls and 3 Bears EA is an expert advisor that uses candlestick patterns and EMA indicator to trade the forex and crypto market with a grid system. The trading strategy of this expert advisor is based on the following logic: this expert buys or sells when a certain number of bear and bull candles with a specific body are formed. The expert advisor also uses a grid system to increase the profitability and reduce the risk of each trade. The grid system works by placing multiple orders at differ
FREE
Big candle breakout EA
Irvan Trias Putra
5 (1)
Big Candle Break Out is an expert advisor that uses a simple and effective trading strategy based on significant changes in volatility. The EA identifies support and resistance levels on the chart and looks for a candle that breaks through one of these levels with at least x volume. This can signal a shift in the market’s direction and provide a potential trading opportunity. The EA can trade both long and short positions depending on the direction of the break out and this expert has three mon
This indicator automatically identifies and plots key support/resistance (S/R) levels on price charts using a hybrid algorithm combining fractal detection , price touch validation , and dynamic level managemen. Key Features Support and Resistance Levels: Support levels and Resistance levels are drawn in red . Fractal-Based Detection: Levels are identified based on fractal highs and lows. Efficient Memory Handling: The number of levels is limited to 100 to avoid clutter. Cleanup on Deletion: All
Filtro:
Nessuna recensione
Rispondi alla recensione