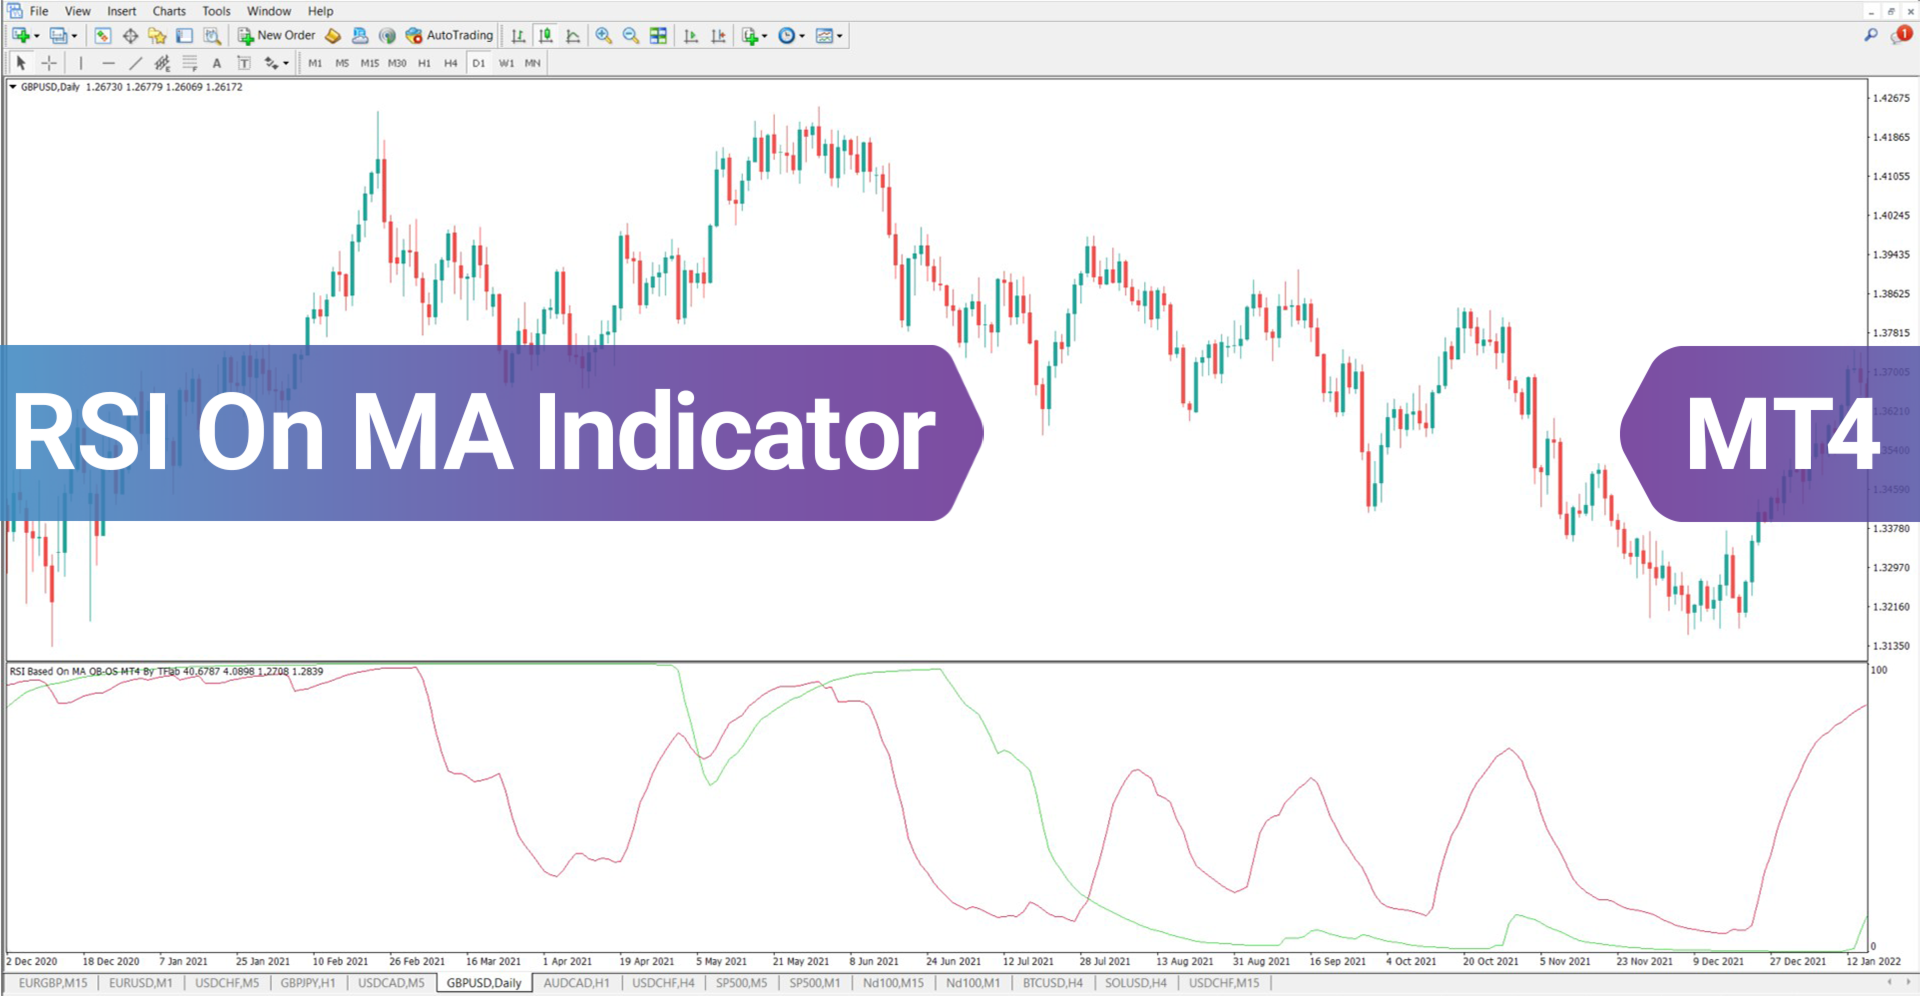
RSI on Moving Average Indicator for MT4
- Indicatori
- Eda Kaya
- Versione: 1.5
RSI-Based Moving Average Indicator for MT4
Introduction
One of the widely used methods for trading in alignment with market trends is leveraging Moving Average Crossovers. The RSI-Based Moving Average Indicator enhances this strategy by integrating the Relative Strength Index (RSI) as an additional confirmation tool.
This indicator generates buy and sell signals by plotting two oscillating lines that move between 0 and 100, helping traders identify potential trade opportunities.
RSI-Based Moving Average Indicator Specifications
The table below provides details about the features and functionality of this indicator:
| Category | Trading Tool - Oscillator - Volatile |
| Platform | MetaTrader 4 |
| Skill Level | Intermediate |
| Indicator Type | Leading - Continuation |
| Timeframe | Multi-timeframe |
| Trading Style | Intraday Trading |
| Trading Market | Cryptocurrency - Forex - Stocks |
Overview of the Indicator
This tool not only helps identify trends but also measures market momentum. The red RSI line represents the slower-moving average, while the green RSI line corresponds to the faster-moving average. A crossover between these two lines serves as a potential trade entry signal.
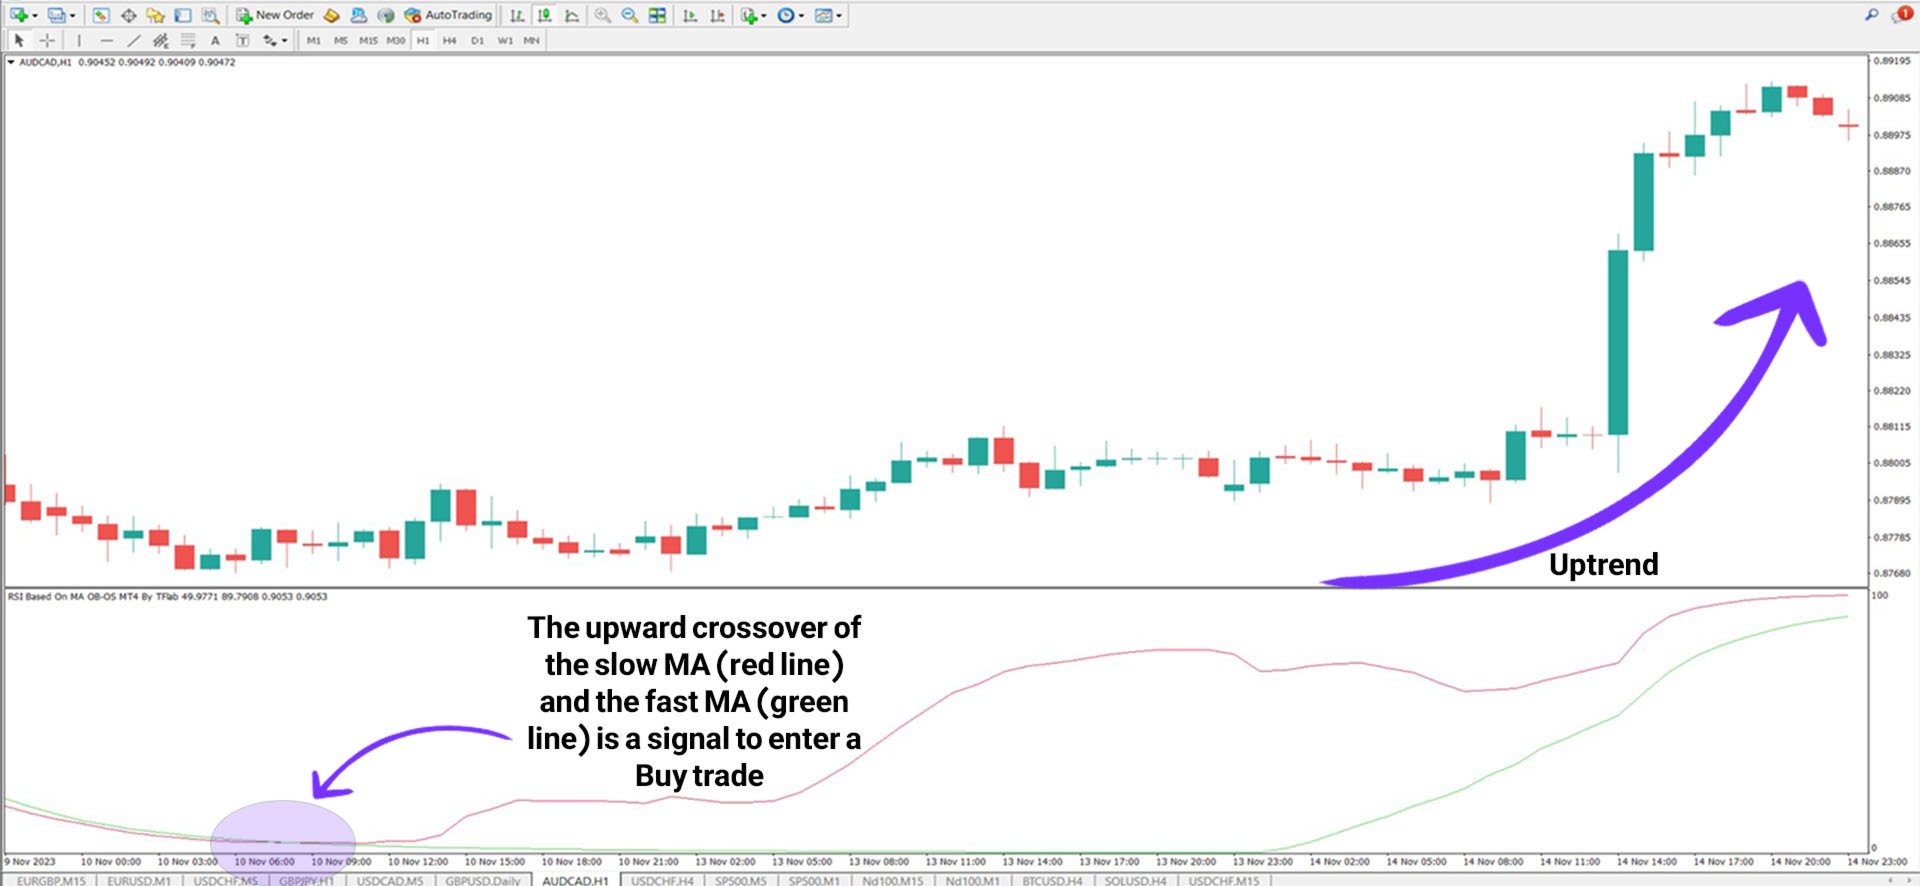
Indicator in an Uptrend
For instance, in the AUD/CAD currency pair chart, when the red moving average (slower) crosses above the green moving average (faster), a buy signal is generated.
Traders often validate this signal by analyzing candlestick formations and other technical factors before executing a trade.
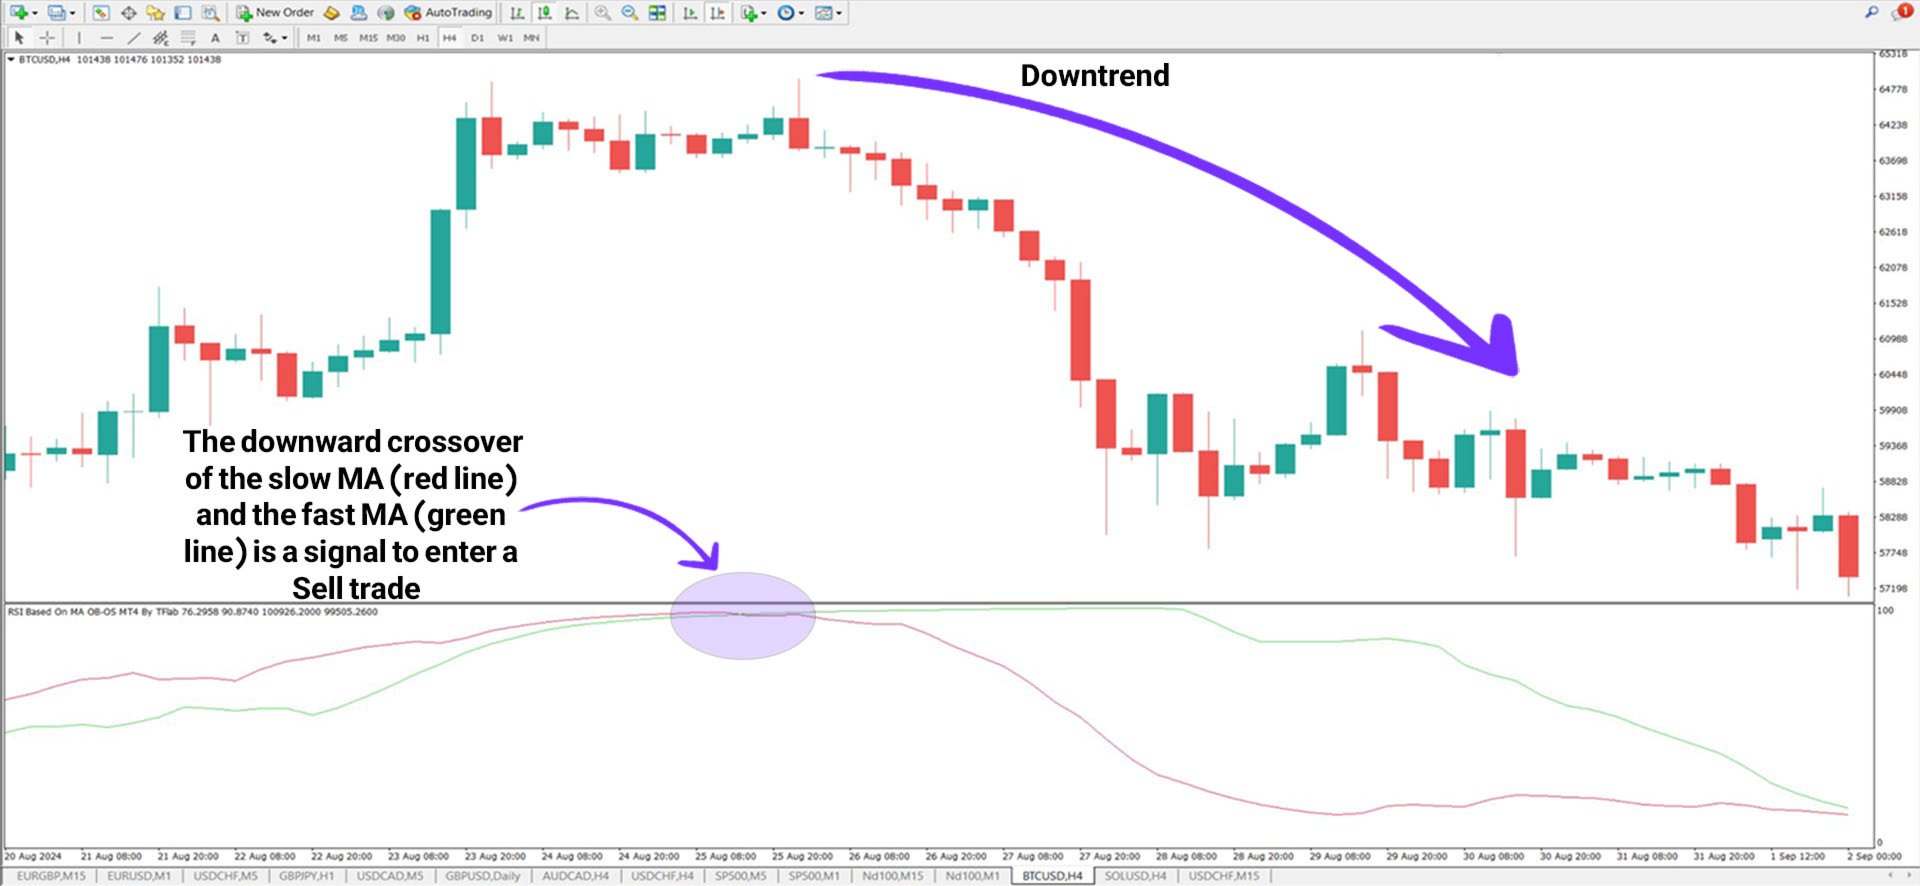
Indicator in a Downtrend
In the 4-hour Bitcoin (BTC) chart below, when the red moving average (slower) moves below the green moving average (faster), it signals a potential selling opportunity.
To strengthen this confirmation, traders may analyze additional price action patterns, such as Doji candles, before placing a sell order.
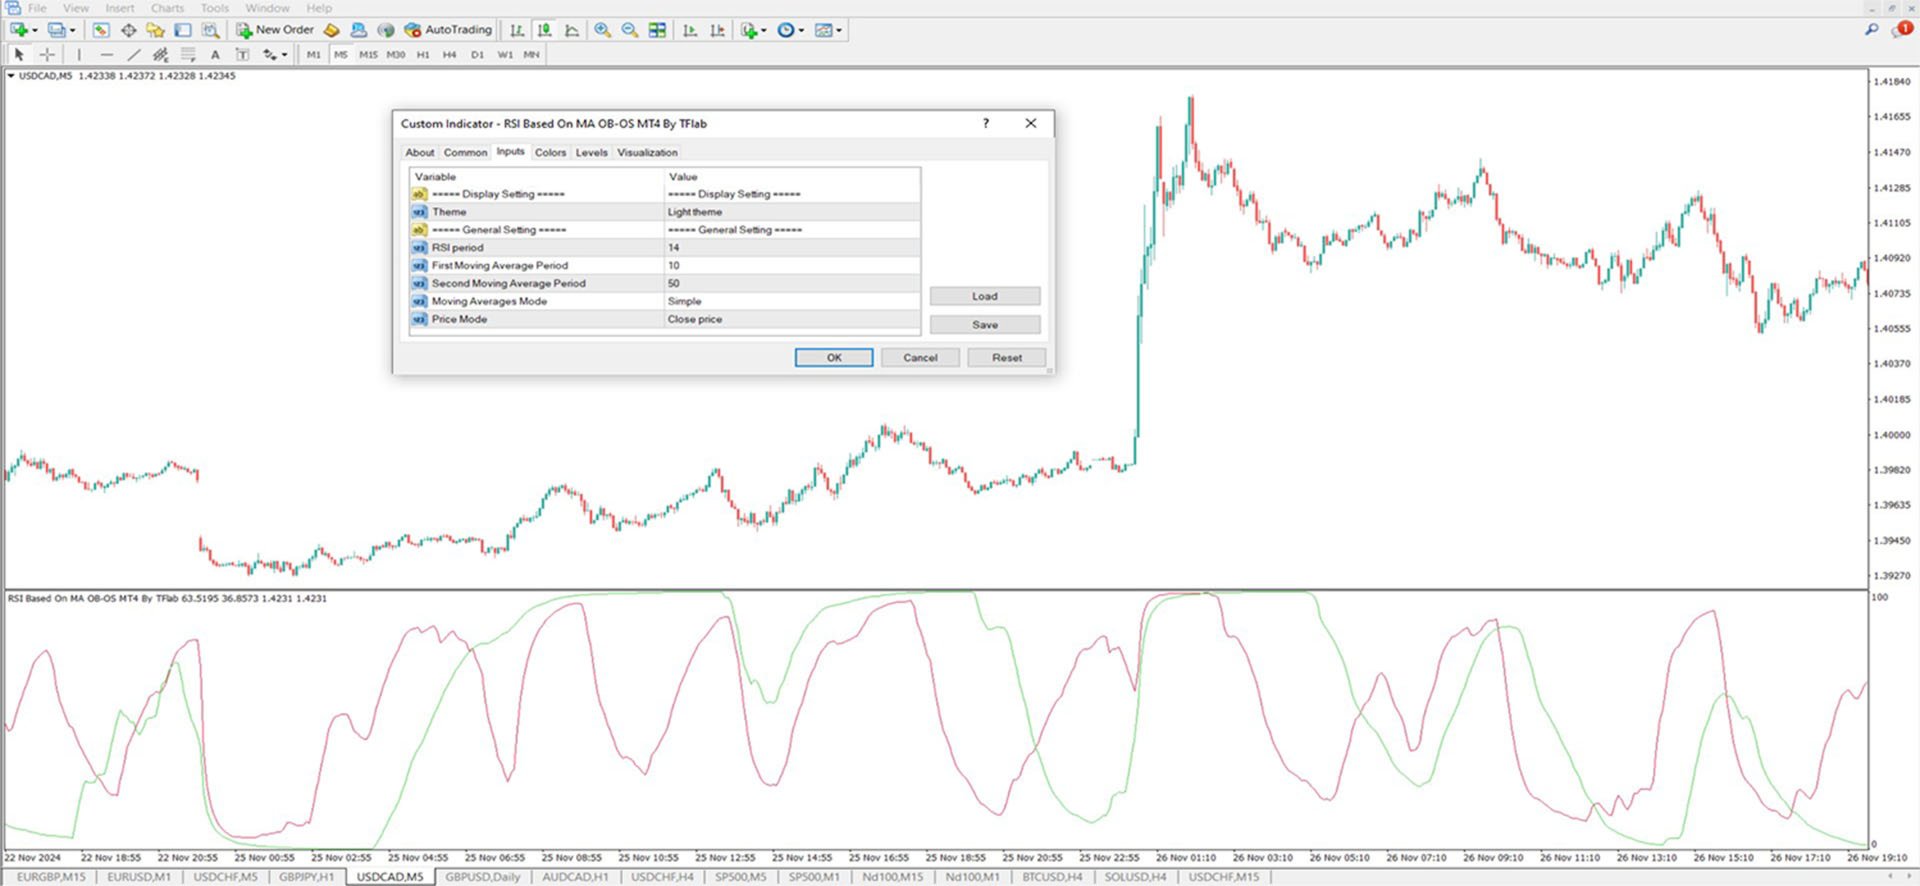
RSI-Based Moving Average Indicator Settings
The indicator offers various customizable settings, as illustrated in the table below:
- Theme: Adjusts the background appearance of the indicator chart.
- RSI Period: Determines the number of candlesticks used for RSI calculation.
- First Moving Average Period: Sets the period for the faster moving average.
- Second Moving Average Period: Defines the period for the slower moving average.
- Moving Average Mode: Selects the type of moving average applied.
- Price Mode: Specifies the price type used in calculations (Open, Close, High, or Low).
Conclusion
The RSI-Based Moving Average Indicator is a valuable technical analysis tool that combines RSI with Moving Averages to enhance trade signals.
It consists of two oscillating lines within the 0-100 range, where the green line reflects RSI from the faster moving average, while the red line represents the slower moving average.