NTL Pivot Lines
- Indicatori
- Northen Trading Labs
- Versione: 1.0
- Attivazioni: 5
Pivot Lines (PL) User Guide
Overview and Features
The Pivot Lines Indicator (PL) provides traders with a powerful tool for identifying potential support and resistance levels based on well-established pivot point calculation methods. By offering insights into possible price turning points, this indicator helps traders make more informed trading decisions and refine their entry and exit strategies. With customizable settings for different timeframes and calculation methods, PL is versatile and adaptable to various trading styles, whether for scalping, day trading, or swing trading.
Key Features
-
Multiple Calculation Methods
Choose from four popular pivot point calculation methods:- Regular (Standard): Calculates pivot points and support/resistance levels based on traditional methods.
- Camarilla: Provides closely clustered support and resistance levels ideal for intraday trading.
- Woodie: Emphasizes the most recent closing prices for more adaptive levels.
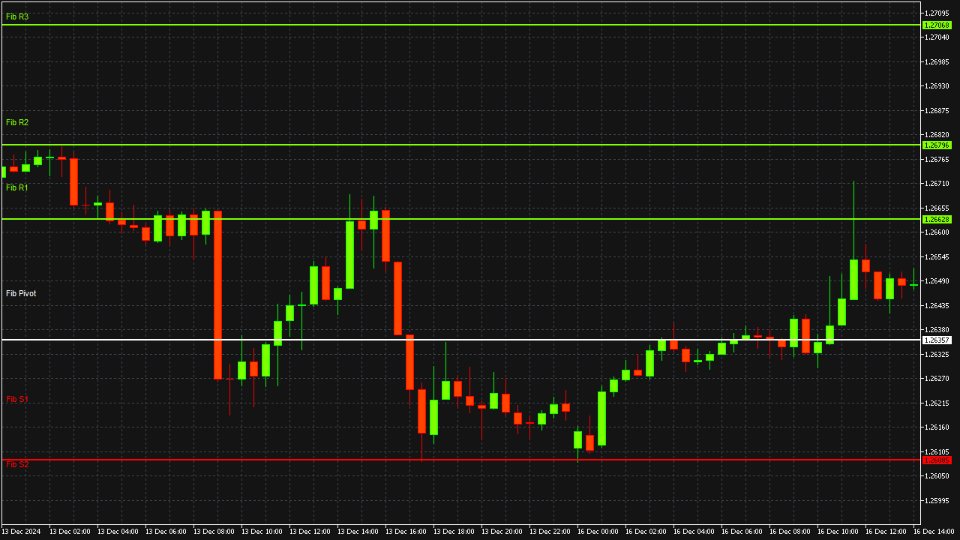
- Fibonacci: Utilises Fibonacci retracement levels for identifying key reversal points.
-
Customisable Timeframes
Set pivot levels on daily, weekly, or monthly timeframes, allowing traders to align the indicator with their specific trading strategy and time horizon. -
Enhanced Decision-Making
Provides visually defined pivot points and levels to aid in spotting potential support, resistance, and reversal areas, giving traders valuable insights for anticipating market movements. -
Compatible with EAsiTrader EA: Provides signals to NTL EAsiTrader EA for automated trading.
PL is an essential tool for traders looking to strengthen their market analysis and gain a competitive edge. Whether you’re focusing on short-term or longer-term setups, this indicator helps you stay aligned with market dynamics.
Installation and Settings
This section provides the installation steps for setting up PL on your MQL5 platform, as well as detailed explanations of customizable settings to configure it for optimal performance.
Installation
-
Install the Indicator:
- Download the Pivot Lines indicator file (PL.ex5) and place it in the Indicators\NTL folder in your MQL5 platform directory. If this folder does not exist, create it manually.
- Typical path: Terminal -> MQL5 -> Indicators -> NTL . Restart the platform to make the indicator appear in the Navigator panel.
-
Apply to a Chart:
- Open your desired chart, select the symbol and timeframe.
- Drag the PL indicator from the Navigator panel onto your chart.
- Configure the Input settings to customize PL, display options, and other parameters.
-
Customize Settings:
- Access the Input settings by double-clicking the indicator on the chart or through the Navigator panel.
-
Save as Template:
- Save your preferred settings as a template by right-clicking on the chart and selecting Template -> Save Template . Give it a descriptive name like PL_Custom for easy access.
Settings
-
EA Flag
Set to true when loading this indicator with an EA. This will prevent the indicator drawing on the chart. -
Period
Defines the timeframe for calculating pivot points. Options include:- Daily: Calculates pivot points based on daily data, suited for intraday traders.
- Weekly: Uses weekly data, providing a broader view for short-term and swing trading.
- Monthly: Calculates from monthly data, ideal for longer-term market perspectives.
-
Method
Selects the calculation method for pivot points, each offering different approaches to identifying support and resistance levels:- Regular: The standard calculation method, widely used across markets.
- Camarilla: Provides closer support and resistance levels, useful in tight, range-bound markets.
- Woodie: Gives more weight to the recent closing price, creating adaptive levels.
- Fibonacci: Uses Fibonacci retracement levels to identify potential reversal points.
-
Font Size
Defines the size of font to be used to display the level names. -
Chart Label Style
Determines the style used to display the level names. Use Label to show the name as a simple label, or use Boxed to show the name inside a rectangle box. -
Chart Edge Alignment
Determines which end of the line the level name is shown on the chart.
Advanced Usage and Strategy Integration
PL offers more than just basic support and resistance identification. By integrating this indicator into a broader trading strategy, traders can enhance the reliability of signals and optimize their setups. Here are some advanced usage tips and strategies for maximizing the indicator’s potential.
Combining with Other Indicators
-
Moving Averages
Use moving averages in conjunction with pivot points to identify trend direction. When price approaches a pivot point in the direction of the prevailing trend (e.g., price moving towards a support level in an uptrend), it may signal a strong continuation opportunity. -
Relative Strength Index (RSI)
The RSI can help confirm pivot levels as potential reversal points. If the price is approaching a resistance level and the RSI indicates overbought conditions, this convergence can increase the probability of a price reversal at that level. -
MACD (Moving Average Convergence Divergence)
MACD crossovers near pivot levels can act as additional confirmation. For example, a bullish MACD crossover near a support level can signal a high-probability buy setup.
Strategy Ideas for Different Market Conditions
-
Range-Bound Markets
In range-bound or consolidating markets, the Camarilla and Woodie pivot methods are particularly useful. These methods provide tighter support and resistance levels, helping to capture smaller price movements within defined boundaries. Using these levels with oscillators like RSI or Stochastic can improve timing for trades within a range. -
Trending Markets
In trending markets, the Fibonacci pivot levels are valuable for identifying retracement points within the trend. For example, in an uptrend, look for price pullbacks to Fibonacci support levels as potential buying opportunities, using the indicator’s R1 and S1 levels to set profit targets or stop-loss levels. -
Intraday Scalping
For scalpers, daily pivot levels (especially using the Regular method) can serve as effective support and resistance levels. Scalping around these levels with additional confirmation from volume indicators or short-term oscillators can enhance entry precision.
Trade Management and Risk Control
Utilize the pivot levels not only for entries but also as a tool for setting stop-loss and take-profit levels. Placing a stop-loss slightly below a support pivot (or above a resistance pivot) provides a logical area where the trade setup is considered invalidated. Similarly, taking profit at the next pivot level helps capture gains while reducing the risk of reversals.
Strategy Integration Tips
- Backtesting: Test the indicator in various market conditions (e.g., trends, ranges) to understand how each pivot method performs.
- Set Alerts: Set alerts on your trading platform for when price approaches a key pivot level to stay prepared for potential trade opportunities.
- Adapt to Timeframes: Adjust the Period setting (daily, weekly, or monthly) based on your trading style. For instance, short-term traders may prefer daily pivots, while swing traders might benefit more from weekly or monthly levels.
PL is a flexible tool that complements various technical strategies, making it an essential addition to a comprehensive trading plan. By combining it with other indicators and adjusting to different market contexts, traders can gain a more nuanced understanding of price action and improve their trading outcomes.
Calculation Methods
PL offers four calculation methods for pivot points: Regular, Camarilla, Woodie, and Fibonacci. Each method provides a unique approach for identifying support and resistance levels based on previous price data.
1. Regular (Standard) Pivot Points
- Pivot Point (PP) = (High + Low + Close) / 3
- Support and Resistance Levels:
- R1 = (2 * PP) - Low
- S1 = (2 * PP) - High
- R2 = PP + (High - Low)
- S2 = PP - (High - Low)
- R3 = High + 2 * (PP - Low)
- S3 = Low - 2 * (High - PP)
2. Camarilla Pivot Points
- Pivot Point (PP) = (High + Low + Close) / 3
- Support and Resistance Levels:
- R1 = Close + ((High - Low) * 1.1 / 12)
- S1 = Close - ((High - Low) * 1.1 / 12)
- R2 = Close + ((High - Low) * 1.1 / 6)
- S2 = Close - ((High - Low) * 1.1 / 6)
- R3 = Close + ((High - Low) * 1.1 / 4)
- S3 = Close - ((High - Low) * 1.1 / 4)
- R4 = Close + ((High - Low) * 1.1 / 2)
- S4 = Close - ((High - Low) * 1.1 / 2)
3. Woodie Pivot Points
- Pivot Point (PP) = (High + Low + 2 * Close) / 4
- Support and Resistance Levels:
- R1 = (2 * PP) - Low
- S1 = (2 * PP) - High
- R2 = PP + (High - Low)
- S2 = PP - (High - Low)
4. Fibonacci Pivot Points
- Pivot Point (PP) = (High + Low + Close) / 3
- Support and Resistance Levels:
- R1 = PP + 0.382 * (High - Low)
- S1 = PP - 0.382 * (High - Low)
- R2 = PP + 0.618 * (High - Low)
- S2 = PP - 0.618 * (High - Low)
- R3 = PP + 1.000 * (High - Low)
- S3 = PP - 1.000 * (High - Low)
Indicator Buffers
PL provides data across nine buffers, one buffer for each pivot level. These buffers can be accessed when integrating PL with other indicators or Expert Advisors (EAs).
- Buffer 0: PP (Pivot Point) Line values
- Buffer 1: R1 Line values
- Buffer 2: R2 Line values
- Buffer 3: R3 Line values
- Buffer 4: R4 Line values
- Buffer 5: S1 Line values
- Buffer 6: S2 Line values
- Buffer 7: S3 Line values
- Buffer 8: S4 Line values
Insights
PL provides a deeper understanding of price action by highlighting areas of high-probability support and resistance. Recognizing patterns in how price interacts with these pivot levels can offer valuable insights into market sentiment and potential reversals.
Identifying and Analyzing Key Patterns
-
Price Reversal at Pivot Levels
When price consistently reverses near a specific pivot level (such as R1, S1, or the central pivot point), it indicates that this level is holding strong as support or resistance. Observing these reversals over several periods suggests a possible trend or range boundary, making it a key area to watch for future setups. -
Breakout Beyond Pivot Levels
When price decisively breaks through a pivot level, particularly R2/S2 or R3/S3, it often signals a stronger momentum move in that direction. This breakout can indicate a shift in sentiment, with buyers or sellers gaining control. Following these moves, consider using the next pivot level as a target or retracement point. -
Testing and Retesting
If price repeatedly tests a pivot level without breaking it, this can signal that the market is accumulating strength for a breakout. Observing the frequency and strength of tests at key levels provides insights into the likelihood of a future breakout versus a potential reversal.
Using Pivot Levels as Trend Confirmation
Pivot points can also help confirm trends when analyzed over consecutive periods:
- Consistent Higher Highs: If the price consistently closes above successive pivot points, this pattern reflects a bullish trend.
- Consistent Lower Lows: Conversely, if the price continues closing below pivot levels, it suggests a bearish trend.
Volatility and Pivot Levels
In periods of high volatility, price often moves quickly between pivot levels, increasing the likelihood of reversals or breakouts. Monitoring how price reacts to pivot levels in such environments helps traders anticipate potential pullbacks and continuation points.
Differentiating Strong vs. Weak Signals
While pivot points offer strong guidance, consider these additional factors to assess the strength of signals:
- Volume Confirmation: Higher trading volume near a pivot level reinforces the validity of a breakout or reversal, indicating strong interest at that price.
- Time of Day: For intraday traders, pivot levels may hold different significance at certain times, such as market open or close, when trading volume typically increases.
- Higher Timeframe Confluence: When daily pivot levels align with weekly or monthly levels, it adds strength to the level, making it more likely to act as a robust support or resistance area.
PL helps traders decode market behavior by providing reliable levels for anticipating price movement. By interpreting these patterns and combining them with other indicators or volume analysis, traders can gain valuable insights into the underlying market sentiment and improve their decision-making.
Rev: 14/11/24
