• Panoramica
  • Recensioni (4)
  • Commenti (3)
  • Novità

RSI Kernel Optimized MT4 with Scanner

5
Special offer: ALL TOOLS, just $35 each!

New tools will be $30 for the first week or the first 3 purchases

Trading Tools Channel on MQL5: Join my MQL5 channel to update the latest news from me

Presentiamo il rivoluzionario RSI Kernel Optimized with Scanner, uno strumento all'avanguardia che ridefinisce l'analisi RSI tradizionale integrando il potente algoritmo di stima della densità del nucleo (KDE). Questo indicatore avanzato non solo fornisce informazioni in tempo reale sulle tendenze di mercato, ma include anche una dashboard per scansionare contemporaneamente più coppie di valute e timeframe. Scopriamo perché questo strumento è un'aggiunta essenziale al tuo arsenale di trading.

See more MT5 version at: RSI Kernel Optimized with Scanner for MT5

See more products at: https://www.mql5.com/en/users/ndhsfy/seller

See more information about the indicator at: Enhancing RSI Analysis with Kernel Optimization

See instructions for using the indicator for EA (iCustom) here (with code available): Create EA with RSI Kernel Optimized indicator (iCustom)

Caratteristiche principali:

  • Rilevamento innovativo dei punti di pivot: Utilizzando l'algoritmo KDE, questo indicatore stima la probabilità che una candela formi un punto di pivot, offrendo ai trader una prospettiva unica sui cambi di tendenza del mercato.
  • Nessun repainting: I segnali forniti da questo indicatore vengono confermati una volta chiusa la candela. Ciò significa che il segnale non cambierà successivamente, permettendoti di iniziare la tua strategia di trading con fiducia all'apertura della prossima candela.
  • Algoritmo KDE personalizzabile: I trader hanno il pieno controllo sui parametri KDE, inclusa la larghezza di banda e le funzioni del kernel, assicurando che l'indicatore si adatti a diverse condizioni di mercato.
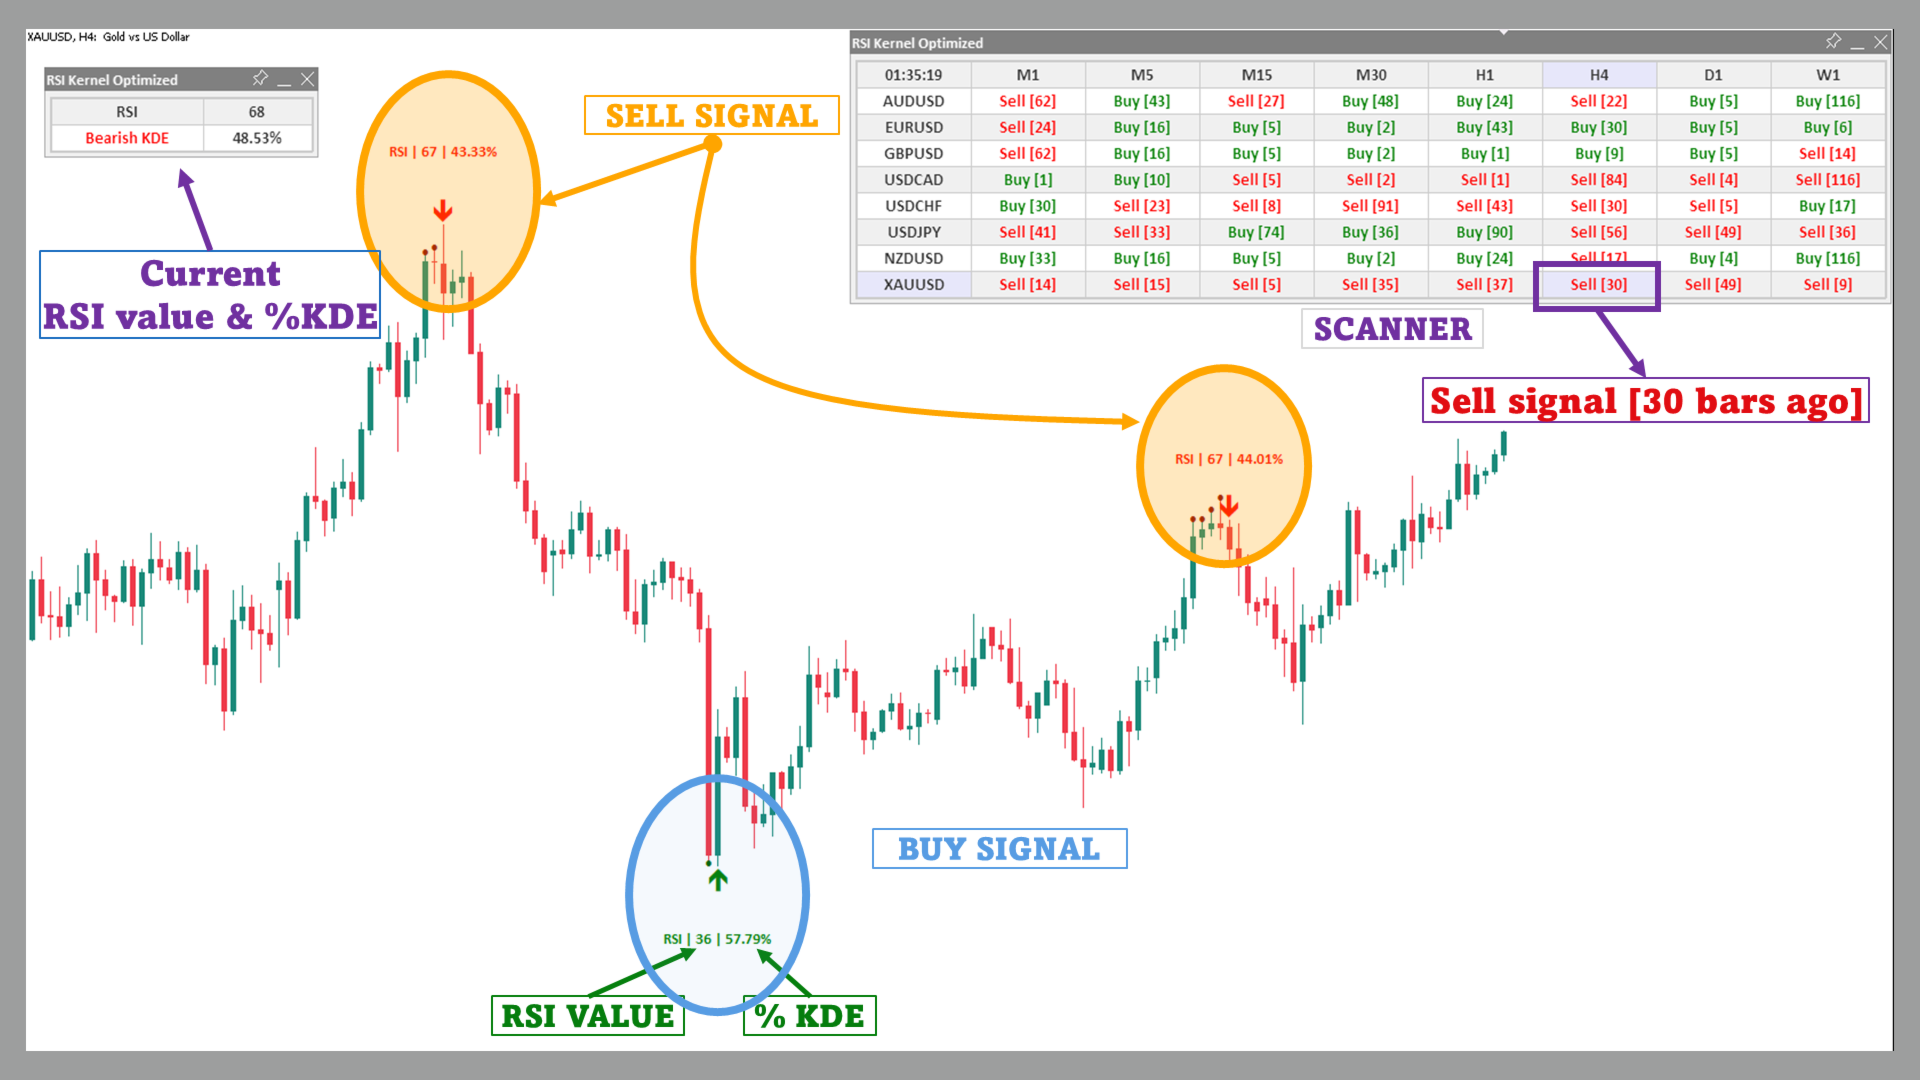
  • Dashboard in tempo reale: Tieni sotto controllo i mercati con una dashboard in tempo reale che mostra i valori RSI e KDE su più coppie di valute e timeframe.
  • Avvisi per potenziali punti di pivot: Non perdere mai un momento chiave nel mercato. L'indicatore ti avverte quando aumenta la probabilità di un punto di pivot, permettendoti di agire rapidamente.
  • Visualizzazione migliorata: L'indicatore offre opzioni visive personalizzabili per garantire che i tuoi grafici rimangano chiari e informativi.

Come interpretare il valore % del KDE:

La percentuale del KDE è una metrica fondamentale che misura quanto l'attuale valore RSI si allinea con la distribuzione KDE. Questa percentuale aiuta i trader a valutare la probabilità di formazione di un punto di pivot:

  • Bassa percentuale di KDE: Indica una bassa probabilità di un pivot, suggerendo che la tendenza attuale potrebbe continuare.
  • Percentuale moderata di KDE: Segnala un aumento della possibilità di un pivot, invitando i trader a cercare conferme aggiuntive.
  • Alta percentuale di KDE: Indica fortemente che un pivot è imminente, allineandosi con condizioni di ipercomprato o ipervenduto nell'analisi tradizionale RSI. Questi sono spesso momenti critici per entrare o uscire da una posizione.

Come funziona:

L'indicatore RSI Kernel Optimized calcola l'RSI per ogni candela e identifica i potenziali punti di pivot. Utilizzando l'algoritmo KDE, crea distribuzioni di probabilità per i punti di pivot RSI alti e bassi, quindi determina la probabilità che una candela formi un punto di pivot. Questo processo innovativo consente ai trader di ricevere avvisi tempestivi per potenziali inversioni o continuazioni di tendenza, rendendolo uno strumento prezioso per decisioni di trading precise.

  • Calcolo dell'RSI: L'indicatore calcola l'RSI per ogni candela e li memorizza in array per i pivot alti e bassi.
  • Calcolo del KDE: Applica l'algoritmo KDE a entrambi gli array di pivot utilizzando funzioni kernel personalizzabili (Uniform, Gaussian o Sigmoid) e impostazioni di larghezza di banda.
  • Rilevamento dei pivot: Quando i valori del KDE superano la soglia impostata, l'indicatore traccia frecce sul grafico, indicando potenziali pivot rialzisti o ribassisti.

Cosa lo rende unico?

A differenza degli indicatori RSI tradizionali, l'RSI Kernel Optimized with Scanner utilizza l'algoritmo KDE per prevedere i punti di pivot in tempo reale. Una volta chiusa la candela, il segnale viene confermato e l'indicatore non viene ridisegnato, il che significa che puoi iniziare la tua strategia di trading all'apertura della prossima candela con fiducia, se appare un segnale. La dashboard integrata migliora ulteriormente questo processo, fornendo una panoramica dei valori RSI e KDE su più coppie di valute e timeframe, permettendo ai trader di monitorare il mercato in modo efficiente.
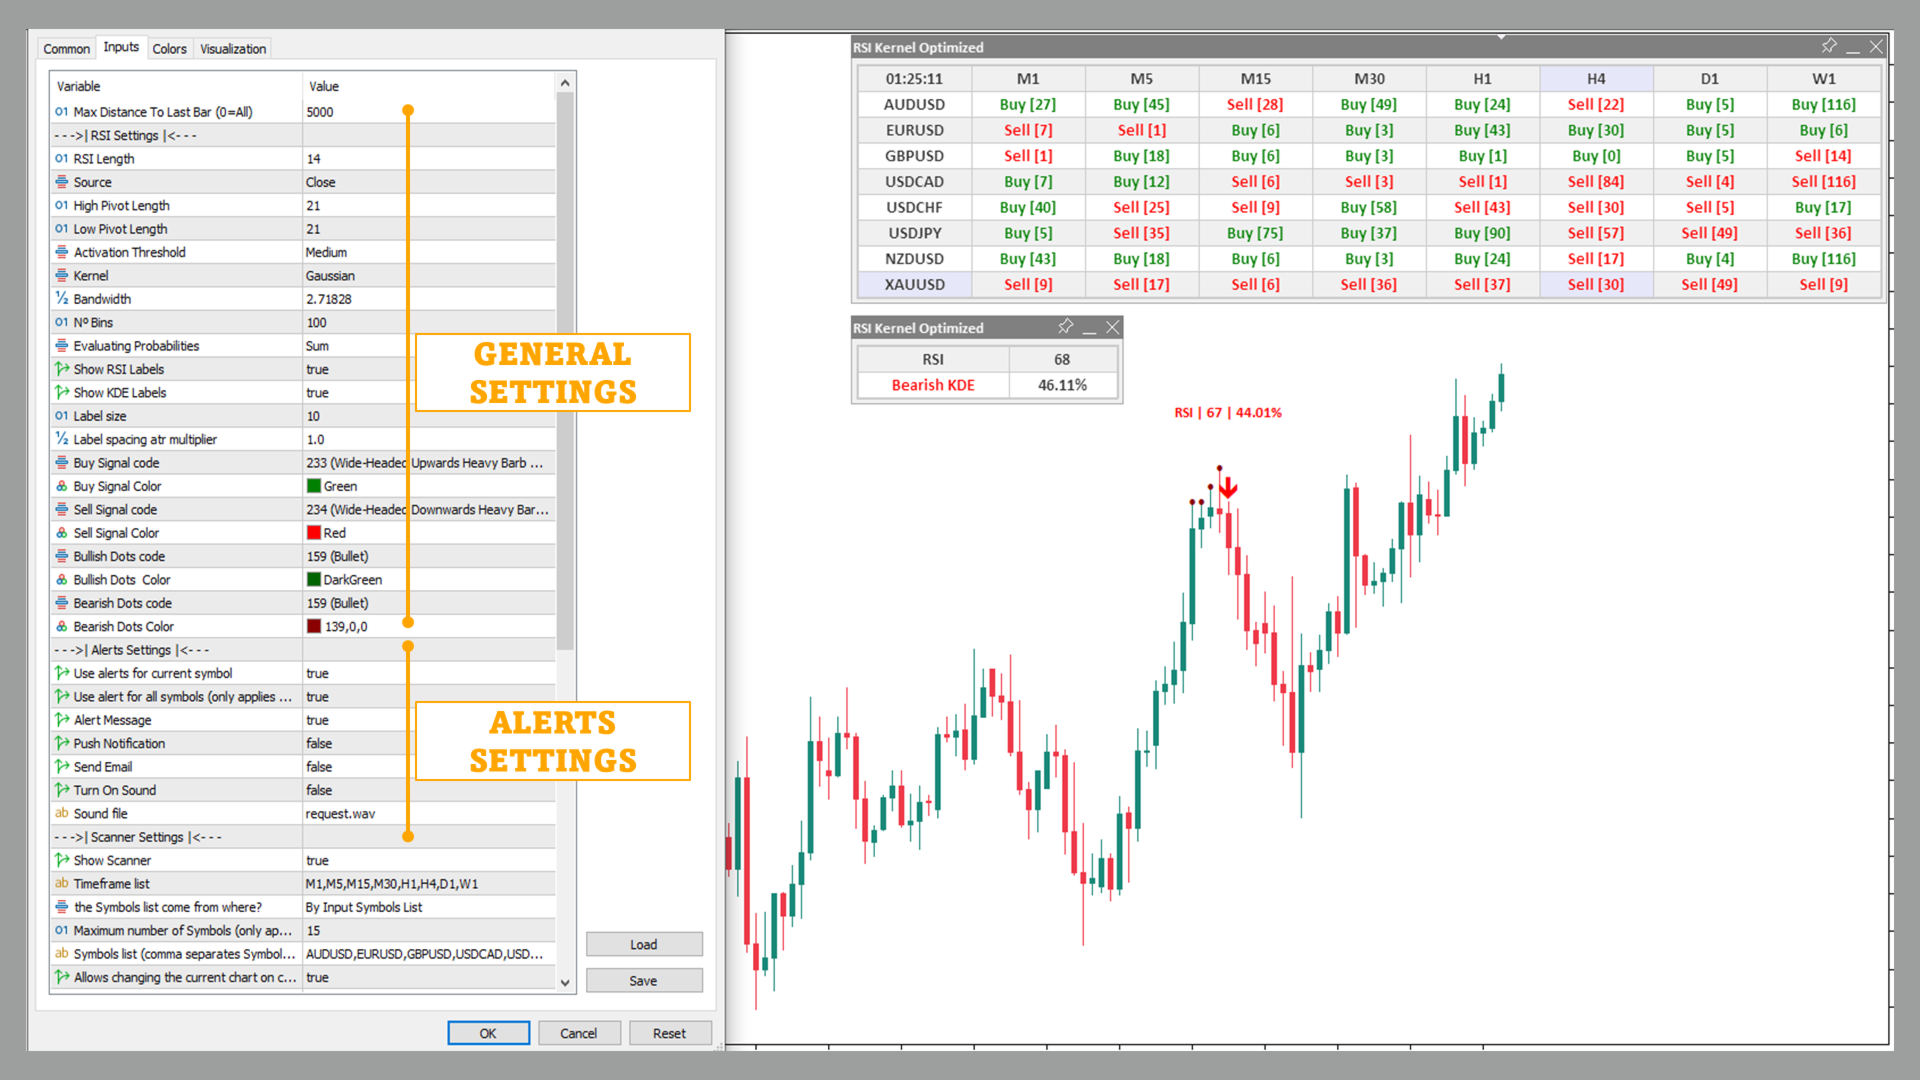
Impostazioni:

  • Impostazioni RSI: Regola la lunghezza e la fonte dell'RSI per adattarlo alla tua strategia di trading.
  • Lunghezza dei pivot: Personalizza la lunghezza dei pivot per rilevare con precisione sia i pivot alti che bassi.
  • Parametri KDE: Regola l'algoritmo KDE con opzioni per la larghezza di banda, la funzione del kernel e il numero di bin per la massima flessibilità.
  • Soglia di attivazione: Determina il numero di frecce mostrate. Impostazioni più alte comporteranno il rendering di più frecce.
  • Funzione kernel: La funzione kernel per il calcolo del KDE. La Gaussiana è una funzione kernel comunemente utilizzata, basata sulla distribuzione normale.
  • Larghezza di banda: Questo parametro imposta la levigatezza dell'uscita della funzione KDE.
  • Numero di bin: Il numero di elementi che conterrà l'array di probabilità del KDE. Impostazioni più alte porteranno a una maggiore precisione.

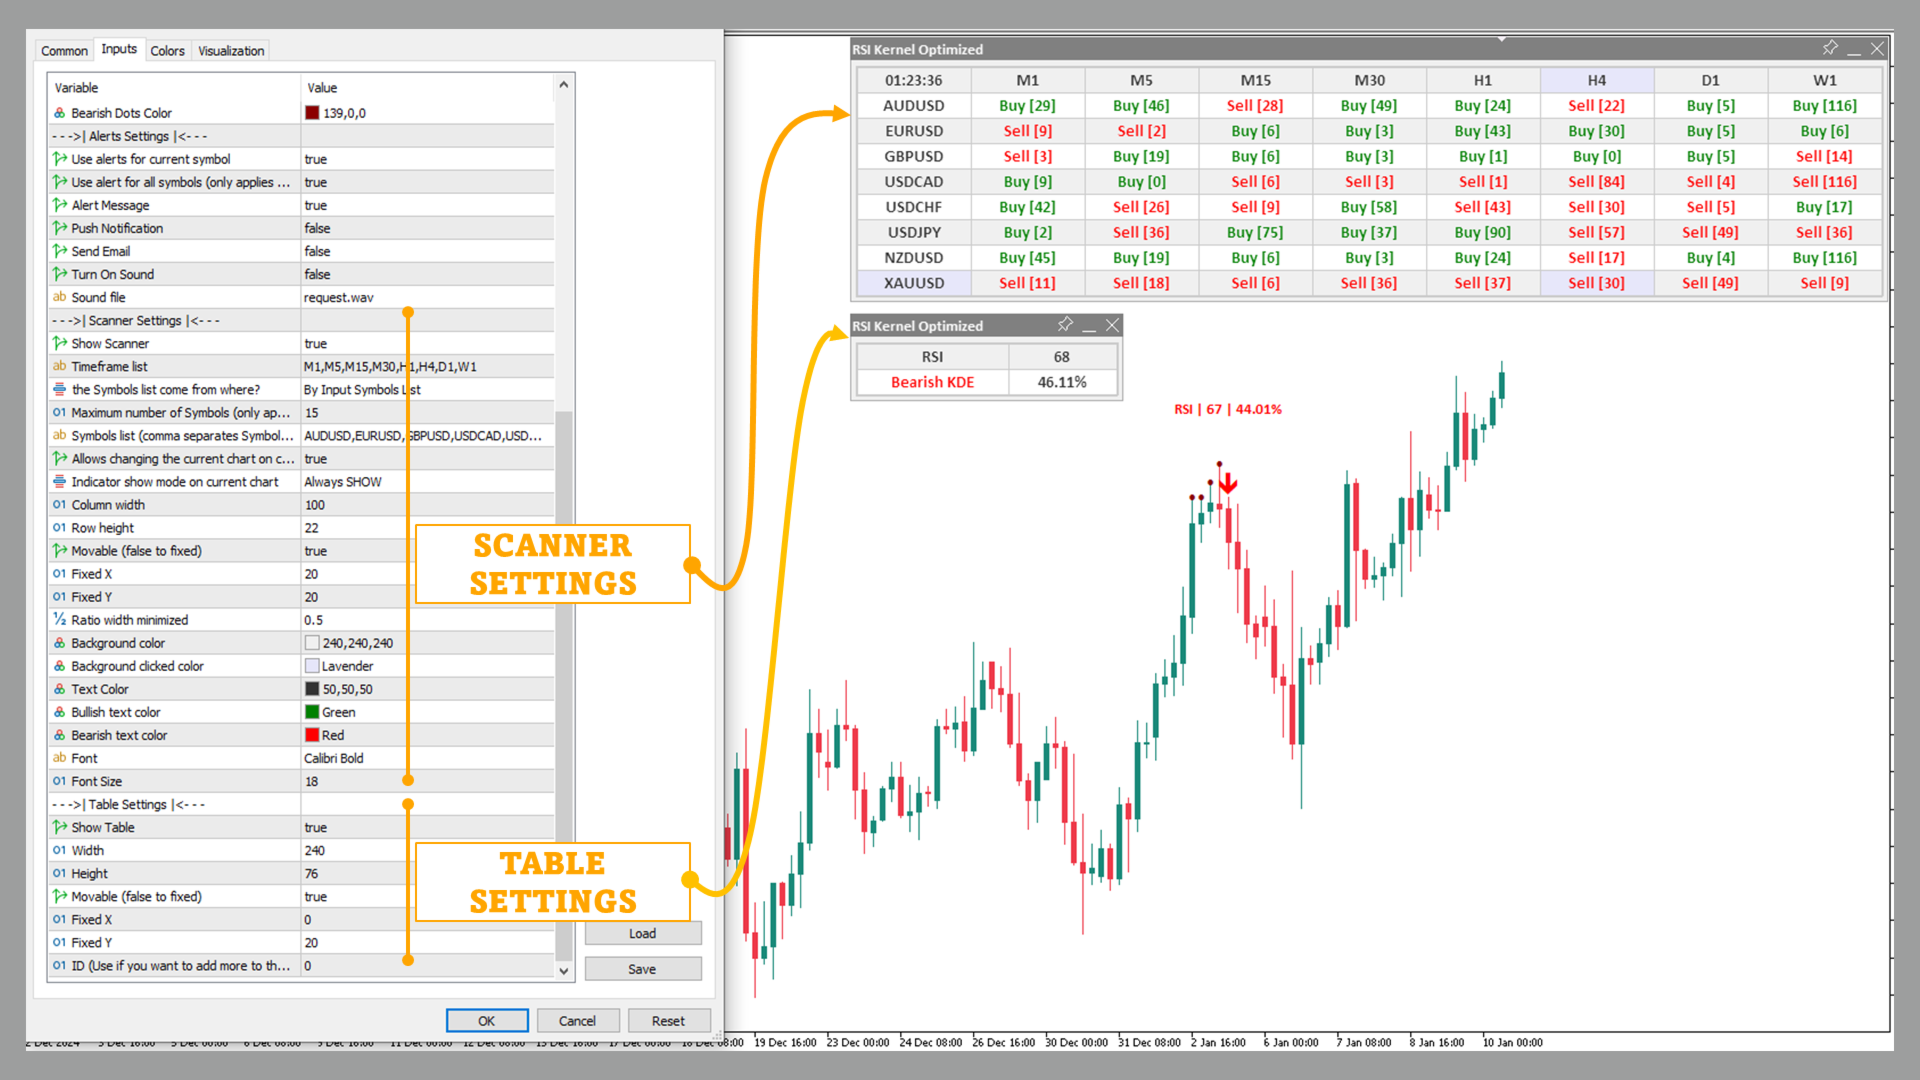
Dashboard Scanner RSI & KDE:

La dashboard integrata consente ai trader di scansionare più coppie di valute e timeframe, fornendo in tempo reale i valori RSI e KDE per ciascuna coppia. Questa funzione rende facile individuare potenziali opportunità nei diversi mercati, tutto in un colpo d'occhio.

RSI Kernel Optimized with Scanner è molto più di un semplice indicatore RSI; è uno strumento potente per il rilevamento dei pivot che integra un'analisi statistica avanzata per offrire una visione più chiara dei movimenti del mercato. Grazie alla funzione "no repainting", puoi essere sicuro che una volta visualizzato un segnale, questo rimarrà invariato, consentendo ingressi tempestivi e affidabili nelle operazioni. Che tu sia un trader giornaliero o un investitore a lungo termine, questo indicatore ti fornisce le intuizioni necessarie per prendere decisioni di trading informate.

    Recensioni 4
    totee toto
    54
    totee toto 2025.02.17 12:07 
     

    Interest indicator. Help for my trading.Well done.

    Yusuf Hamzah
    721
    Yusuf Hamzah 2024.12.17 14:03 
     

    Unique. RSI + KDE. Scientifically sound. The concept provides a good unbiased additional confirmation of a possible reversal. Well done.

    danmar
    1774
    danmar 2024.12.04 06:11 
     

    i buy this one because i read the review of XANKEEZ on the other excellent product that i bought Volumetric Order Blocks MT4 Multi Timeframe and it is also a great one which works very well with volumetric : Well Done and today i upload the new version with new functionalities that i ask yesterday 3 december for future update! so quick and for me he makes my chart clearer and with less space taken for the MTF with use of Y negative to hide upper part of title Then THANK YOU A LOT. few sellers take really the asking of their buyers (even i understand that all asking could not be taken). Here it is a very quick update , user support is excellent, thank you again.

    Prodotti consigliati
    The Penta-O is a 6-point retracement harmonacci pattern which usually precedes big market movements. Penta-O patterns can expand and repaint quite a bit. To make things easier this indicator implements a twist: it waits for a donchian breakout in the right direction before signaling the trade. The end result is an otherwise repainting indicator with a very reliable trading signal. The donchian breakout period is entered as an input. [ Installation Guide | Update Guide | Troubleshooting | FAQ | A
    Monster Harmonic Indicator
    Paul Geirnaerdt
    4.59 (29)
    Monster Harmonics Indicator is a harmonic pattern indicator. It recognizes Gartley, Bat, Crab, Butterfly, Cypher, White Swan, Black Swan, Shark and several other patterns. Projected patterns that are not yet completed are recognized, too. Monster even shows the PRZ (Potential Reversal Zone). Users can add their own user defined patterns to Monster. Besides the current pattern, Monster also shows all patterns in the symbols history. Monster will provide alerts for developing patterns. Introduced
    Noize Absorption Index MT4
    Ekaterina Saltykova
    5 (1)
    Noize Absorption Index - is the manual trading system that measures the difference of pressure between bears forces and bulls forces. Green line - is a noize free index that showing curent situation. Zero value of index shows totally choppy/flat market.Values above zero level shows how powerfull bullish wave is and values below zero measures bearish forces.Up arrow appears on bearish market when it's ready to reverse, dn arrow appears on weak bullish market, as a result of reverse expectation. S
    RTrends
    Nikolay Likhovid
    The RTrends indicator does two things: first, it automatically draws the layout of the price chart by plotting trend lines and, secondly, it produces bearish and bullish signals. The layout reflects the fractal nature of the market. Trends from different time horizons are applied simultaneously on the chart. Thus, from a single chart a trader can see trend lines of higher timeframes. The lines, depending on the horizon, differ in color and width: the older the horizon, the thicker the line is. T
    EZZ Elite Zig Zag is an indicator for the MetaTrader 4 terminal. This indicator traces the peak of the trend based on the market reversal, thus showing various opportunities in the financial market. EZZ Elite Zig Zag is a visual tool, intuitive, and easy to understand and use.  Test it Yourself by Downloading it for Free. Author Paulo Rocha all rights reserved
    Master Scalping M1 è un indicatore innovativo che utilizza un algoritmo per determinare il trend in modo rapido e preciso. L'indicatore calcola il tempo di apertura e chiusura delle posizioni, gli algoritmi dell'indicatore consentono di trovare i momenti ideali per entrare in un trade (acquistare o vendere un asset), il che aumenta il successo delle transazioni per la maggior parte dei trader. Vantaggi dell'indicatore: Facile da usare, non sovraccarica il grafico con informazioni inutili. Può es
    Indicatore Crypto_Forex "3 Black Crows pattern" per MT4. - L'indicatore "3 Black Crows pattern" è molto potente per il trading Price Action: nessuna rielaborazione, nessun ritardo. - L'indicatore rileva i pattern ribassisti "3 Black Crows" sul grafico: segnale freccia rossa sul grafico (vedi immagini). - Con avvisi su PC, dispositivi mobili ed e-mail. - È disponibile anche il suo fratello, l'indicatore rialzista "3 White Soldiers pattern" (segui il link qui sotto). - L'indicatore "3 Black Crow
    Daily Candle Predictor è un indicatore che prevede il prezzo di chiusura di una candela. L'indicatore è destinato principalmente all'uso sui grafici D1. Questo indicatore è adatto sia per il trading forex tradizionale che per il trading di opzioni binarie. L'indicatore può essere utilizzato come sistema di trading autonomo o può fungere da aggiunta al sistema di trading esistente. Questo indicatore analizza la candela corrente, calcolando alcuni fattori di forza all'interno del corpo della cande
    Forex Gump
    Andrey Kozak
    2.4 (5)
    Forex Gump is a fully finished semi-automatic trading system. In the form of arrows, signals are displayed on the screen for opening and closing deals. All you need is to follow the instructions of the indicator. When the indicator shows a blue arrow, you need to open a buy order. When the indicator shows a red arrow, you need to open a sell order. Close orders when the indicator draws a yellow cross. In order to get the most effective result, we recommend using the timeframes H1, H4, D1. There
    Trend Oscillator - è un indicatore Crypto_Forex personalizzato avanzato, uno strumento di trading efficiente! - Viene utilizzato un nuovo metodo di calcolo avanzato - 20 opzioni per il parametro "Prezzo per calcolo". - L'oscillatore più fluido mai sviluppato. - Colore verde per i trend al rialzo, colore rosso per i trend al ribasso. - Valori di ipervenduto: inferiori a 5, valori di ipercomprato: superiori a 95. - Ci sono molte opportunità per aggiornare anche le strategie standard con questo i
    Infinity Trend Pro
    Yaroslav Varankin
    1 (1)
    This is a trend indicator without redrawing Developed instead of the binary options strategy (by the color of the Martingale candlestick) Also works well in forex trading When to open trades (binary options) A signal will appear in the place with a candle signaling the current candle It is recommended to open a deal for one candle of the current timeframe M1 and M5 When a blue dot appears, open a deal up When a red dot appears, open a trade down. How to open trades on Forex. When a signal is rec
    What are Heiken Ashi Candles? Heiken Ashi, derived from the Japanese term 'Heikin Ashi,' translates to average price bars. It's an indicator depicting price bars on a chart. Formula for Heiken Ashi candles: - Heiken Ashi opening price: (previous candle's opening + closing price) / 2 - Closing price Heiken Ashi: (opening + high + low + closing) / 4 - Heiken Ashi peak: Max of high, opening, or closing price - Heiken Ashi bottom price: Min of low, opening, or closing price How to Read Heiken A
    The Th3Eng PipFinite indicator is based on a very excellent analysis of the right trend direction with perfect custom algorithms. It show the true direction and the best point to start trading. With StopLoss point and Three Take Profit points. Also it show the right pivot of the price and small points to order to replace the dynamic support and resistance channel, Which surrounds the price. And Finally it draws a very helpful Box on the left side on the chart includes (take profits and Stop loss
    The CCI Divergence is a reasonably useful indicator in itself, but it is even more effective when used with divergence pattern trading. The CCI Divergence indicator signal is one of the most potent signals among the indicators that exist in the market. Here is new version for Divergence Indicator using CCI method, with more improvements. Divergences indicate a potential investment point because the directional moment does not confirm the price. A bullish divergence occurs when the underlying va
    The indicator detects and displays Shark harmonic pattern (see the screenshot). The pattern is plotted by the extreme values of the ZigZag indicator (included in the resources, no need to install). After detecting the pattern, the indicator notifies of that by a pop-up window, a mobile notification and an email. The indicator highlights the process of the pattern formation and not just the complete pattern. In the former case, it is displayed in the contour triangles. After the pattern is comple
    This indicator presents an alternative approach to identify Market Structure. The logic used is derived from learning material created by   DaveTeaches (on X) Upgrade v1.10: add option to put protected high/low value to buffer (figure 11, 12) When quantifying Market Structure, it is common to use fractal highs and lows to identify "significant" swing pivots. When price closes through these pivots, we may identify a Market Structure Shift (MSS) for reversals or a Break of Structure (BOS) for co
    This is a new strategy for SUPPLY DEMAND areas It is based on a calculation using the tick volume to detect the big price action in market for both bear /bull actions this smart volume action candles are used to determine the supply and demand areas prices in between main supply and demand lines indicate sideway market  up arrows will be shown when prices moves above the main supply and the secondary supply lines Down arrows will be shown when prices moves below the main demand and the secondary
    Trade with Gann on your side!! MASTER CIRCLE 360 CIRCLE CHART, originally created by Gann admitted that this is “The Mother of all charts”. It is one of the last studies that this great trader left for us. The numeric tab le is apparently quite simple like all the tables and is based on square numbers, the SQUARE OF 12 and is by evolution, one of the most important square numbers. Here we can find CYCLE, PRICE AND TIME thanks to angles and grades, to show past and future support and resistance.
    Fibonacci retracement and extension line drawing tool Fibonacci retracement and extended line drawing tool for MT4 platform is suitable for traders who use  golden section trading Advantages: There is no extra line, no too long line, and it is easy to observe and find trading opportunities Trial version: https://www.mql5.com/zh/market/product/35884 Main functions: 1. Multiple groups of Fibonacci turns can be drawn directly, and the relationship between important turning points can be seen
    The   Fibonacci Confluence Toolkit   is a technical analysis tool designed to help traders identify potential price reversal zones by combining key market signals and patterns. It highlights areas of interest where significant price action or reactions are anticipated, automatically applies Fibonacci retracement levels to outline potential pullback zones, and detects engulfing candle patterns. Its unique strength lies in its reliance solely on price patterns, eliminating the need for user-define
    Chart Patterns Detect 15 patterns (Ascending Triangle, Descending Triangle, Rising Wedge, Falling Wedge, Bullish Flag, Bearish Flag, Bullish Rectangle, Bearish Rectangle Symmetrical triangle, Head and Shoulders, Inverted Head and Shoulders, Triple top, Triple Bottom, Double Top, Double Bottom) Use historical data to calculate the probability of each pattern to succeed (possibility to filter notification according to the chance of success) gives graphic indication about the invalidation level and
    Indicatore Crypto_Forex "Hanging Man pattern" per MT4. - L'indicatore "Hanging Man pattern" è un indicatore molto potente per il trading Price Action: nessuna rielaborazione, nessun ritardo. - L'indicatore rileva i pattern ribassisti Hanging Man sul grafico: segnale freccia rossa sul grafico (vedi immagini). - Con avvisi su PC, dispositivi mobili ed e-mail. - L'indicatore "Hanging Man pattern" è eccellente da combinare con livelli di supporto/resistenza. // Grandi robot e indicatori di tradin
    Key level wedge
    Presley Annais Tatenda Meck
    5 (5)
    The Key level wedge indicator automatically draws rising wedge pattern and falling wedge pattern for you on the chart. This pattern is really good when used as a confirmation entry at key support & resistance, supply & demand and reversal zones. Advantages  The Key level wedge block DOES NOT RE-PAINT, giving you confidence when a signal appears and also helps when looking back.  The Key level wedge includes an on/off button on the chart to easily keep the charts clean after analysis by just o
    Super Reversal Pattern
    Parfait Mujinga Ndalika
    Super Reversal Pattern Indicator Unlock the power of advanced pattern recognition with our Super Reversal Pattern Indicator. Designed for traders seeking precision and reliability, this indicator identifies one of the most effective reversal patterns in technical analysis, offering a significant edge in your trading strategy. Key Features: Non-Repainting Accuracy: Enjoy the confidence of non-repainting technology. Once a Super Reversal Pattern is detected, it remains static, providing consiste
    TWO PAIRS SQUARE HEDGE METER INDICATOR Try this brilliant 2 pairs square indicator It draws a square wave of the relation between your two inputs symbols when square wave indicates -1 then it is very great opportunity to SELL pair1 and BUY Pair2 when square wave indicates +1 then it is very great opportunity to BUY pair1 and SELL Pair2 the inputs are : 2 pairs of symbols         then index value : i use 20 for M30 charts ( you can try other values : 40/50 for M15 , : 30 for M30 , : 10 for H1 ,
    To get access to MT5 version please click here . - This is the exact conversion from TradingView: "Stochastic Momentum Index" By "UCSgears". - This is a popular version of stochastic oscillator on tradingview. - This is a light-load processing and non-repaint indicator. - Buffers are available for the lines on chart. - You can message in private chat for further changes you need. Thanks for downloading
    Blahtech Market Profile
    Blahtech Limited
    4.53 (15)
    Was: $249  Now: $149   Market Profile defines a number of day types that can help the trader to determine market behaviour. A key feature is the Value Area, representing the range of price action where 70% of trading took place. Understanding the Value Area can give traders valuable insight into market direction and establish the higher odds trade. It is an excellent addition to any system you may be using. Blahtech Limited presents their Market Profile indicator for the MetaTrader community. In
    Trend Bilio - an arrow indicator without redrawing shows potential market entry points in the form of arrows of the corresponding color: upward red arrows suggest opening a buy, green down arrows - selling. The entrance is supposed to be at the next bar after the pointer. The arrow indicator Trend Bilio visually "unloads" the price chart and saves time for analysis: no signal - no deal, if an opposite signal appears, then the current deal should be closed. It is Trend Bilio that is considered
    Advance Currency Meter is a currency meter that detects strong market trends. This indicator is good for scalping, intraday trading and swing trading. The indicator will detect short term to long term market trends. This will give you good insight which currencies are best to trade as of the moment. Note : Kindly contact me before you make any purchases. This won't work on your account without my permission. Note :   Works well with my MACD Currency Strength Meter
    Adaptive RSI
    Rasoul Mojtahedzadeh
    5 (2)
    Relative Strength Index (RSI) is one of the most popular and accurate oscillators widely used by traders to capture overbought and oversold areas of price action. Although the RSI indicator works fine for a period of market, it fails to generate profitable signals when market condition changes, and hence produces wrong signals which results in big losses. Have you ever thought about an adaptive RSI indicator that adapts its period of calculation based on the market conditions? The presented indi
    Gli utenti di questo prodotto hanno anche acquistato
    Gann Made Easy
    Oleg Rodin
    4.79 (111)
    Gann Made Easy è un sistema di trading Forex professionale e facile da usare che si basa sui migliori principi del trading utilizzando la teoria di mr. WD Gann. L'indicatore fornisce segnali ACQUISTA e VENDI accurati, inclusi i livelli di Stop Loss e Take Profit. Puoi fare trading anche in movimento utilizzando le notifiche PUSH. Vi prego di contattarmi dopo l'acquisto! Condividerò i miei consigli di trading con te e fantastici indicatori bonus gratuitamente! Probabilmente hai già sentito parlar
    Dynamic Forex28 Navigator
    Bernhard Schweigert
    5 (4)
    Dynamic Forex28 Navigator - Lo strumento di trading Forex di nuova generazione. ATTUALMENTE SCONTATO DEL 49%. Dynamic Forex28 Navigator è l'evoluzione dei nostri indicatori popolari di lunga data, che combinano la potenza di tre in uno: Advanced Currency Strength28 Indicator (695 recensioni) + Advanced Currency IMPULSE con ALERT (520 recensioni) + CS28 Combo Signals (Bonus). Dettagli sull'indicatore https://www.mql5.com/en/blogs/post/758844 Cosa offre l'indicatore di forza di nuova generazione?
    Gold Stuff
    Vasiliy Strukov
    4.86 (247)
    Gold Stuff è un indicatore di tendenza progettato specificamente per l'oro e può essere utilizzato anche su qualsiasi strumento finanziario. L'indicatore non ridisegna e non è in ritardo. Periodo consigliato H1. Su di esso l'indicatore funziona in modo completamente automatico Expert Advisor EA Gold Stuff. Lo trovi nel mio profilo. I risultati in tempo reale possono essere visualizzati qui.  Puoi ottenere una copia gratuita del nostro indicatore Strong Support e Trend Scanner, per favore scriv
    Gold Venamax MT4
    Sergei Linskii
    5 (1)
    Gold Venamax : questo è il miglior indicatore tecnico azionario. L'algoritmo dell'indicatore analizza il movimento dei prezzi di un asset e riflette la volatilità e le potenziali zone di ingresso. Caratteristiche dell'indicatore: Questo è un super indicatore con Magic e due blocchi di frecce di tendenza per un trading comodo e redditizio. Sul grafico viene visualizzato il pulsante rosso per cambiare blocco. Magic è impostato nelle impostazioni dell'indicatore, in modo da poter installare l'in
    -   Real price is 80$   - 40% Discount ( It is 49$ now ) - Lifetime update free Contact me for instruction, add group and any questions! Related Products:  Bitcoin Expert , Gold Expert - Non-repaint - I just sell my products in Elif Kaya profile, any other websites are stolen old versions, So no any new updates or support. Introduction The breakout and retest strategy is traded support and resistance levels. it involves price breaking through a previous level.  The break and retest strategy is
    Golden Trend Indicator
    Noha Mohamed Fathy Younes Badr
    4.9 (10)
    Golden Trend indicator  is The best indicator for predicting trend movement this indicator never lags and never repaints and never back paints    and give  arrow buy and sell    before the candle appear  and it will help you and  will make your trading decisions clearer its work on all currencies and  gold and crypto and all time frame This unique  indicator uses very secret algorithms to catch the  trends, so you can trade using this indicator and see the trend clear on charts  manual guide and
    Scalper Inside PRO
    Alexey Minkov
    4.76 (63)
    !SPECIAL SALE! An exclusive indicator that utilizes an innovative algorithm to swiftly and accurately determine the market trend. The indicator automatically calculates opening, closing, and profit levels, providing detailed trading statistics. With these features, you can choose the most appropriate trading instrument for the current market conditions. Additionally, you can easily integrate your own arrow indicators into Scalper Inside Pro to quickly evaluate their statistics and profitability
    Smart Set up Levels
    Mohit Dhariwal
    5 (1)
    Smart Set up leve l is a very powerful indicator based on the concept of order blocks and set up entries with proper fvg and breakouts to make a very nice level to enter like a pro trader. Very easy to use interface and friendly to enter on buy and sell signals. Works Best on M15 Time frame on Gold, Bitcoin and Fx pairs. Daily 4-5 trades on each pair  Works great on gold like a pro on M15 It is non repainting nor lagging It is very powerful indicator giving precise entries and prop acts can be c
    Currency Strength Wizard è un indicatore molto potente che ti fornisce una soluzione all-in-one per un trading di successo. L'indicatore calcola la potenza di questa o quella coppia forex utilizzando i dati di tutte le valute su più intervalli di tempo. Questi dati sono rappresentati in una forma di indice di valuta facile da usare e linee elettriche di valuta che puoi utilizzare per vedere il potere di questa o quella valuta. Tutto ciò di cui hai bisogno è collegare l'indicatore al grafico che
    Scalper Vault
    Oleg Rodin
    5 (28)
    Scalper Vault è un sistema di scalping professionale che ti fornisce tutto il necessario per scalping di successo. Questo indicatore è un sistema di trading completo che può essere utilizzato dai trader di forex e opzioni binarie. L'intervallo di tempo consigliato è M5. Il sistema fornisce segnali di freccia accurati nella direzione della tendenza. Ti fornisce anche i segnali più alti e più bassi e i livelli di mercato di Gann. Gli indicatori forniscono tutti i tipi di avvisi, comprese le notifi
    Lux Trend
    Mohamed Hassan
    5 (1)
    After your purchase, enjoy a 1-month free trial of our EA Forex Proton robot and automate alerts from Lux Trend without manual intervention! The starting price is $75. It will increase to $120 after 30 sales. 18 copies left. After purchase, please contact me to get your trading tips + more information for a great bonus!   Lux Trend is a professional strategy based on using Higher Highs and Lower Highs to identify and draw Trendline Breakouts! Lux Trend  utilizes two Moving Averages to con
    IX Power MT4
    Daniel Stein
    4.71 (7)
    IX Power: Scopri approfondimenti di mercato per indici, materie prime, criptovalute e forex Panoramica IX Power è uno strumento versatile progettato per analizzare la forza di indici, materie prime, criptovalute e simboli forex. Mentre FX Power offre la massima precisione per le coppie di valute utilizzando i dati di tutte le coppie disponibili, IX Power si concentra esclusivamente sui dati di mercato del simbolo sottostante. Questo rende IX Power una scelta eccellente per mercati non correlat
    Easy Breakout
    Mohamed Hassan
    5 (9)
    After your purchase, feel free to contact me for more details on how to receive a bonus indicator called VFI, which pairs perfectly with Easy Breakout for enhanced confluence!   Easy Breakout is a powerful price action trading system built on one of the most popular and widely trusted strategies among traders: the Breakout strategy ! This indicator delivers crystal-clear Buy and Sell signals based on breakouts from key support and resistance zones. Unlike typical breakout indicators, it levera
    MTF Supply Demand Zones
    Georgios Kalomoiropoulos
    4.83 (23)
    Nuova generazione di zone di domanda e offerta automatizzate. Algoritmo nuovo e innovativo che funziona su qualsiasi grafico. Tutte le zone vengono create dinamicamente in base all'azione dei prezzi del mercato. DUE TIPI DI AVVISI --> 1) QUANDO IL PREZZO RAGGIUNGE UNA ZONA 2) QUANDO SI FORMA UNA NUOVA ZONA Non ottieni un altro indicatore inutile. Ottieni una strategia di trading completa con risultati comprovati.     Nuove caratteristiche:     Avvisi quando il prezzo raggiunge la zona di
    FX Levels MT4
    Daniel Stein
    5 (2)
    FX Levels: Supporti e Resistenze di Precisione Eccezionale per Tutti i Mercati Panoramica Rapida Cercate un modo affidabile per individuare livelli di supporto e resistenza in ogni mercato—coppie di valute, indici, azioni o materie prime? FX Levels fonde il metodo tradizionale “Lighthouse” con un approccio dinamico all’avanguardia, offrendo una precisione quasi universale. Basato sulla nostra esperienza reale con i broker e su aggiornamenti automatici giornalieri più quelli in tempo reale, FX
    FX Power MT4 NG
    Daniel Stein
    4.94 (18)
    FX Power: Analizza la Forza delle Valute per Decisioni di Trading Più Intelligenti Panoramica FX Power è lo strumento essenziale per comprendere la reale forza delle principali valute e dell'oro in qualsiasi condizione di mercato. Identificando le valute forti da comprare e quelle deboli da vendere, FX Power semplifica le decisioni di trading e rivela opportunità ad alta probabilità. Che tu segua le tendenze o anticipi inversioni utilizzando valori estremi di Delta, questo strumento si adatta
    PRO Renko System
    Oleg Rodin
    5 (26)
    PRO Renko System è un sistema di trading altamente accurato appositamente progettato per il trading di grafici RENKO. Questo è un sistema universale che può essere applicato a vari strumenti di trading. Il sistema neutralizza efficacemente il cosiddetto rumore di mercato che consente di accedere a segnali di inversione accurati. L'indicatore è molto facile da usare e ha un solo parametro responsabile della generazione del segnale. Puoi facilmente adattare lo strumento a qualsiasi strumento di
    Trend Screener
    STE S.S.COMPANY
    4.78 (93)
    Indicatore di tendenza, soluzione unica rivoluzionaria per il trading di tendenze e il filtraggio con tutte le importanti funzionalità di tendenza integrate in un unico strumento! È un indicatore multi-timeframe e multi-valuta al 100% non ridipingibile che può essere utilizzato su tutti i simboli/strumenti: forex, materie prime, criptovalute, indici e azioni. OFFERTA A TEMPO LIMITATO: l'indicatore di screening di supporto e resistenza è disponibile a soli 50$ e a vita. (Prezzo originale 250$) (o
    Enigmera
    Ivan Stefanov
    5 (7)
    ENIGMERA: Il cuore del mercato Importante: La demo di MQL5.com funziona nel Strategy Tester e potrebbe non riflettere completamente le funzionalità di Enigmera. Consulta la descrizione, gli screenshot e il video per maggiori dettagli. Non esitare a inviarmi un messaggio se hai domande! Il codice dell'indicatore è stato completamente riscritto. La versione 3.0 aggiunge nuove funzionalità e corregge i bug accumulati dall'inizio dell'indicatore. Introduzione Questo indicatore e sistema di trading
    Gold Trend 4
    Sergei Linskii
    Gold Trend   - è un buon indicatore tecnico azionario. L'algoritmo dell'indicatore analizza il movimento del prezzo di un asset e riflette la volatilità e le potenziali zone di ingresso. I migliori segnali dell'indicatore: - Per VENDERE = istogramma rosso + puntatore SHORT rosso + freccia di segnale gialla nella stessa direzione. - Per l'ACQUISTO = istogramma blu + puntatore LONG blu + freccia di segnale acquatica nella stessa direzione. Vantaggi dell'indicatore: 1. L'indicatore produce s
    TPSproTREND PrO
    Roman Podpora
    4.68 (25)
    TPSpro TREND PRO   è un indicatore di tendenza che analizza automaticamente il mercato, fornisce informazioni sulla tendenza e sui rispettivi cambiamenti e fornisce segnali per entrare nelle operazioni senza ridisegnare. L'indicatore utilizza ciascuna candela e la analizza separatamente. Si riferisce a vari shock al rialzo o al ribasso. Punto di ingresso preciso per il trading di valute, criptovalute, metalli, azioni e indici! Versione MT5                   Descrizione completa dell'indicatore  
    Scopri il segreto per il trading Forex di successo con il nostro indicatore MT4 personalizzato! Ti sei mai chiesto come raggiungere il successo nel mercato Forex, guadagnando costantemente profitti minimizzando il rischio? Ecco la risposta che hai cercato! Permettici di presentare il nostro indicatore MT4 proprietario che rivoluzionerà il tuo approccio al trading. Versatilità unica Il nostro indicatore è appositamente progettato per gli utenti che preferiscono le formazioni di candele Renko e
    Key Level Analyzer
    Suvashish Halder
    5 (1)
    Key Level Analyzer – Know Better, Trade Smarter Key Level Analyzer is a powerful trading tool designed to provide precise market insights by identifying high-probability price zones , market turning points , and key decision areas . Unlike traditional indicators, it uses a smart algorithm to dynamically calculate support, resistance, and balance zones, helping traders make informed, data-driven decisions . MT5 Version -  https://www.mql5.com/en/market/product/132810/ With real-time updates, mul
    Chart Patterns All in One
    Davit Beridze
    4.68 (19)
    Prova "Chart Patterns All in One" in modalità demo e ricevi un bonus. Inviami un messaggio dopo averlo testato in modalità demo per ricevere il tuo bonus. Lascia un commento dopo l'acquisto per ricevere 8 indicatori di alta qualità come bonus. L'indicatore Chart Patterns All-in-One aiuta i trader a visualizzare vari modelli di grafici comunemente utilizzati nell'analisi tecnica. Questo indicatore supporta l'identificazione dei possibili comportamenti del mercato, ma non garantisce la redditivit
    MetaBands M4
    Vahidreza Heidar Gholami
    5 (3)
    MetaBands uses powerful and unique algorithms to draw channels and detect trends so that it can provide traders with potential points for entering and exiting trades. It’s a channel indicator plus a powerful trend indicator. It includes different types of channels which can be merged to create new channels simply by using the input parameters. MetaBands uses all types of alerts to notify users about market events. Features Supports most of the channel algorithms Powerful trend detection algorith
    FX Volume
    Daniel Stein
    4.59 (34)
    FX Volume: Scopri il Vero Sentimento di Mercato dalla Prospettiva di un Broker Panoramica Rapida Vuoi portare la tua strategia di trading a un livello superiore? FX Volume ti offre informazioni in tempo reale su come i trader retail e i broker sono posizionati—molto prima che compaiano report in ritardo come il COT. Che tu miri a guadagni costanti o desideri semplicemente un vantaggio più solido sui mercati, FX Volume ti aiuta a individuare grandi squilibri, confermare i breakout e perfezionar
    System Trend Pro
    Aleksandr Makarov
    5 (2)
    System Trend Pro - This is the best trend trading indicator!!! You can get this indicator for free -  Quantum Entry PRO The indicator no repaint!!!  The indicator has   MTF   mode, which adds confidence to trading on the trend (   no repaint   ). How to trade? Everything is very simple, we wait for the first signal (big arrow), then wait for the second signal (small arrow) and enter the market in the direction of the arrow. (See screens 1 and 2.) Exit on the opposite signal or take 20-30 pips
    Advanced Supply Demand
    Bernhard Schweigert
    4.91 (294)
    CURRENTLY 26% OFF !! Best Solution for any Newbie or Expert Trader! This indicator is a unique, high quality and affordable trading tool because we have incorporated a number of proprietary features and a new formula. With this update, you will be able to show double timeframe zones. You will not only be able to show a higher TF but to show both, the chart TF, PLUS the higher TF: SHOWING NESTED ZONES. All Supply Demand traders will love it. :) Important Information Revealed Maximize the potentia
    TPSpro RFI Levels
    Roman Podpora
    4.85 (26)
    ISTRUZIONI       RUS   -   INGLESE       Si   consiglia di utilizzare con un indicatore       -       TPSpro   TENDENZA PRO -   Versione MT4         Un elemento chiave nel trading sono le zone o i livelli da cui vengono prese le decisioni di acquisto o vendita di uno strumento di trading. Nonostante i tentativi dei principali attori di nascondere la loro presenza sul mercato, lasciano inevitabilmente delle tracce. Il nostro compito era imparare a identificare queste tracce e interpretarle corre
    FX Dynamic: Monitora volatilità e trend con un’analisi ATR personalizzabile Panoramica FX Dynamic è uno strumento potente che sfrutta i calcoli di Average True Range (ATR) per fornire ai trader informazioni impareggiabili sulla volatilità, sia giornaliera che intraday. Impostando soglie di volatilità chiare—ad esempio 80%, 100%, 130%—puoi individuare rapidamente opportunità di profitto o ricevere avvisi quando il mercato supera i range abituali. FX Dynamic si adatta al fuso orario del tuo brok
    Altri dall’autore
    Special offer : ALL TOOLS , just $35 each! New tools   will be   $30   for the   first week   or the   first 3 purchases !  Trading Tools Channel on MQL5 : Join my MQL5 channel to update the latest news from me Cominciamo con le caratteristiche eccezionali: L'EA è dotato di un FILTRO NOTIZIE e di un FILTRO RSI. Basso rischio (alcune coppie di valute hanno un DrawDown <10%, persino del 5%). Questo EA non utilizza alcuna funzione di martingala o griglia. L'EA può visualizzare zone visive per il t
    Special offer : ALL TOOLS , just $35 each! New tools   will be   $30   for the   first week   or the   first 3 purchases !  Trading Tools Channel on MQL5 : Join my MQL5 channel to update the latest news from me Scopri la potenza del concetto di Inversion Fair Value Gap (IFVG) di ICT con l’ Indicatore Inversion Fair Value Gaps ! Questo strumento all’avanguardia porta i Fair Value Gaps (FVG) a un livello successivo, identificando e visualizzando le zone di FVG invertite – aree chiave di supporto
    Special offer : ALL TOOLS , just $35 each! New tools   will be   $30   for the   first week   or the   first 3 purchases !  Trading Tools Channel on MQL5 : Join my MQL5 channel to update the latest news from me L'indicatore del modello di inversione a tre barre offre uno strumento potente per i trader, identificando e evidenziando automaticamente i modelli di inversione a tre barre direttamente sul grafico dei prezzi. Questo indicatore è una risorsa preziosa per individuare potenziali inversion
    Supertrend Fakeout MT5
    Duc Hoan Nguyen
    5 (2)
    Special offer : ALL TOOLS , just $35 each! New tools   will be   $30   for the   first week   or the   first 3 purchases !  Trading Tools Channel on MQL5 : Join my MQL5 channel to update the latest news from me L'indicatore Supertrend Fakeout è una versione migliorata del classico indicatore Supertrend , progettata per fornire segnali di tendenza più affidabili. Integrando funzionalità avanzate come Fakeout Index Limit e Fakeout ATR Mult , questo indicatore aiuta a filtrare i falsi segnali di i
    FREE
    Special offer : ALL TOOLS , just $35 each! New tools   will be   $30   for the   first week   or the   first 3 purchases !  Trading Tools Channel on MQL5 : Join my MQL5 channel to update the latest news from me Scopri la potenza del concetto di Inversion Fair Value Gap (IFVG) di ICT con l’ Indicatore Inversion Fair Value Gaps ! Questo strumento all’avanguardia porta i Fair Value Gaps (FVG) a un livello successivo, identificando e visualizzando le zone di FVG invertite – aree chiave di supporto
    Volumatic VIDyA MT5
    Duc Hoan Nguyen
    5 (1)
    Special offer : ALL TOOLS , just $35 each! New tools   will be   $30   for the   first week   or the   first 3 purchases !  Trading Tools Channel on MQL5 : Join my MQL5 channel to update the latest news from me Volumatic VIDYA (Variable Index Dynamic Average) è un indicatore avanzato progettato per monitorare le tendenze e analizzare la pressione di acquisto e vendita in ogni fase di una tendenza. Utilizzando il Variable Index Dynamic Average come tecnica principale di smorzamento dinamico, que
    Special offer : ALL TOOLS , just $35 each! New tools   will be   $30   for the   first week   or the   first 3 purchases !  Trading Tools Channel on MQL5 : Join my MQL5 channel to update the latest news from me L'indicatore Volumetric Order Blocks Multi Timeframe è uno strumento potente progettato per i trader che cercano approfondimenti sul comportamento del mercato identificando le aree di prezzo chiave dove i partecipanti significativi accumulano ordini. Queste aree, note come blocchi d'ordi
    Special offer : ALL TOOLS , just $35 each! New tools   will be   $30   for the   first week   or the   first 3 purchases !  Trading Tools Channel on MQL5 : Join my MQL5 channel to update the latest news from me Massimizza il tuo vantaggio nel trading con Follow Line MT5 con Scanner, un indicatore avanzato basato sulla volatilità progettato per trader seri. Questo strumento combina la potenza delle Bande di Bollinger con impostazioni personalizzabili, offrendo intuizioni precise sui movimenti de
    FREE
    Special offer : ALL TOOLS , just $35 each! New tools   will be   $30   for the   first week   or the   first 3 purchases !  Trading Tools Channel on MQL5 : Join my MQL5 channel to update the latest news from me Presentiamo il SuperTrend ATR Multiplier with Scanner for MT5 – uno strumento versatile e potente progettato per aiutarti a essere sempre un passo avanti alle tendenze di mercato, con funzionalità personalizzabili e avvisi in tempo reale. Basato sulla logica comprovata del SuperTrend di
    FREE
    Special offer : ALL TOOLS , just $35 each! New tools   will be   $30   for the   first week   or the   first 3 purchases !  Trading Tools Channel on MQL5 : Join my MQL5 channel to update the latest news from me L'indicatore Volumetric Order Blocks Multi Timeframe è uno strumento potente progettato per i trader che cercano approfondimenti sul comportamento del mercato identificando le aree di prezzo chiave dove i partecipanti significativi accumulano ordini. Queste aree, note come blocchi d'ordi
    Special offer : ALL TOOLS , just $35 each! New tools   will be   $30   for the   first week   or the   first 3 purchases !  Trading Tools Channel on MQL5 : Join my MQL5 channel to update the latest news from me Sblocca il potere del machine learning avanzato con il Machine Learning Adaptive SuperTrend , un indicatore all'avanguardia progettato per adattarsi senza problemi alle mutevoli condizioni di mercato. Integrando il clustering k-means con la metodologia SuperTrend, questo indicatore conse
    Special offer : ALL TOOLS , just $35 each! New tools   will be   $30   for the   first week   or the   first 3 purchases !  Trading Tools Channel on MQL5 : Join my MQL5 channel to update the latest news from me I. Introduzione Market Structure Trend Targets Scanner è uno strumento potente per analizzare le tendenze di mercato, identificare i punti di breakout e gestire il rischio tramite uno stop loss dinamico. Tracciando i massimi e i minimi precedenti per individuare i breakout, questo strum
    Special offer : ALL TOOLS , just $35 each! New tools   will be   $30   for the   first week   or the   first 3 purchases !  Trading Tools Channel on MQL5 : Join my MQL5 channel to update the latest news from me Il Fibonacci Confluence Toolkit Multi-Timeframe è uno strumento avanzato di analisi tecnica progettato per trader professionisti, che aiuta a identificare potenziali zone di inversione del prezzo combinando segnali e modelli chiave del mercato. Con capacità di visualizzazione multi-timef
    Special offer : ALL TOOLS , just $35 each! New tools   will be   $30   for the   first week   or the   first 3 purchases !  Trading Tools Channel on MQL5 : Join my MQL5 channel to update the latest news from me L'indicatore Trend Levels è meticolosamente progettato per individuare livelli di trend critici — Alto, Medio e Basso — durante i movimenti di mercato. Con calcoli in tempo reale basati sui valori più alti, più bassi e medi su un periodo di lookback personalizzabile, questo strumento for
    SMC System MT4
    Duc Hoan Nguyen
    5 (1)
    Special offer : ALL TOOLS , just $35 each! New tools   will be   $30   for the   first week   or the   first 3 purchases !  Trading Tools Channel on MQL5 : Join my MQL5 channel to update the latest news from me SMC è un approccio al trading che aiuta i trader a identificare le zone di liquidità, le posizioni istituzionali degli ordini e i principali punti di svolta del mercato. Sfruttando i principi SMC, i trader possono navigare nel mercato in modo più efficace, trovando punti di ingresso e us
    Special offer : ALL TOOLS , just $35 each! New tools   will be   $30   for the   first week   or the   first 3 purchases !  Trading Tools Channel on MQL5 : Join my MQL5 channel to update the latest news from me L'indicatore del modello di inversione a tre barre offre uno strumento potente per i trader, identificando e evidenziando automaticamente i modelli di inversione a tre barre direttamente sul grafico dei prezzi. Questo indicatore è una risorsa preziosa per individuare potenziali inversion
    Special offer : ALL TOOLS , just $35 each! New tools   will be   $30   for the   first week   or the   first 3 purchases !  Trading Tools Channel on MQL5 : Join my MQL5 channel to update the latest news from me Sblocca il potere del machine learning avanzato con il Machine Learning Adaptive SuperTrend , un indicatore all'avanguardia progettato per adattarsi senza problemi alle mutevoli condizioni di mercato. Integrando il clustering k-means con la metodologia SuperTrend, questo indicatore conse
    Offerta speciale : ALL TOOLS , solo $35 ciascuno! New tools   will be   $30   for the   first week   or the   first 3 purchases !  Trading Tools Channel on MQL5 : Join my MQL5 channel to update the latest news from me In un ambiente di trading volatile, uno strumento di analisi potente e intuitivo può aiutarti a cogliere rapidamente le opportunità. Fibonacci Trend Scanner non solo integra le funzioni tradizionali dell’indicatore Fibonacci e SuperTrend, ma amplia anche le funzionalità con la sca
    Special offer : ALL TOOLS , just $35 each! New tools   will be   $30   for the   first week   or the   first 3 purchases !  Trading Tools Channel on MQL5 : Join my MQL5 channel to update the latest news from me Kalman Trend Levels è un indicatore avanzato di follow-up delle tendenze che utilizza la tecnologia all'avanguardia dei filtri di Kalman per fornire ai trader segnali analitici potenti. Progettato per precisione e adattabilità, questo strumento non solo identifica zone critiche di suppor
    Special offer : ALL TOOLS , just $35 each! New tools   will be   $30   for the   first week   or the   first 3 purchases !  Trading Tools Channel on MQL5 : Join my MQL5 channel to update the latest news from me Indicatore di Canale di Regressione Lineare è un potente strumento di analisi tecnica che aiuta i trader a identificare trend di prezzo e potenziali punti di inversione. Calcolando e visualizzando canali di regressione lineare, bande e proiezioni future, questo indicatore offre una prosp
    Volumatic VIDyA MT4
    Duc Hoan Nguyen
    5 (2)
    Special offer : ALL TOOLS , just $35 each! New tools   will be   $30   for the   first week   or the   first 3 purchases !  Trading Tools Channel on MQL5 : Join my MQL5 channel to update the latest news from me Volumatic VIDYA (Variable Index Dynamic Average) è un indicatore avanzato progettato per monitorare le tendenze e analizzare la pressione di acquisto e vendita in ogni fase di una tendenza. Utilizzando il Variable Index Dynamic Average come tecnica principale di smorzamento dinamico, que
    Supertrend Fakeout MT4
    Duc Hoan Nguyen
    5 (1)
    Special offer : ALL TOOLS , just $35 each! New tools   will be   $30   for the   first week   or the   first 3 purchases !  Trading Tools Channel on MQL5 : Join my MQL5 channel to update the latest news from me L'indicatore Supertrend Fakeout è una versione migliorata del classico indicatore Supertrend , progettata per fornire segnali di tendenza più affidabili. Integrando funzionalità avanzate come Fakeout Index Limit e Fakeout ATR Mult , questo indicatore aiuta a filtrare i falsi segnali di i
    FREE
    Special offer : ALL TOOLS , just $35 each! New tools   will be   $30   for the   first week   or the   first 3 purchases !  Trading Tools Channel on MQL5 : Join my MQL5 channel to update the latest news from me Panoramica OA SnR Power è uno strumento potente progettato per aiutare i trader a identificare e valutare la forza dei livelli di supporto e resistenza. Integrando fattori chiave come il volume di trading, la frequenza dei rimbalzi e il numero di test, questo indicatore offre una vision
    FREE
    Special offer : ALL TOOLS , just $35 each! New tools   will be   $30   for the   first week   or the   first 3 purchases !  Trading Tools Channel on MQL5 : Join my MQL5 channel to update the latest news from me SMC è un approccio al trading che aiuta i trader a identificare le zone di liquidità, le posizioni istituzionali degli ordini e i principali punti di svolta del mercato. Sfruttando i principi SMC, i trader possono navigare nel mercato in modo più efficace, trovando punti di ingresso e us
    Special offer : ALL TOOLS , just $35 each! New tools   will be   $30   for the   first week   or the   first 3 purchases !  Trading Tools Channel on MQL5 : Join my MQL5 channel to update the latest news from me Nell’attuale panorama di trading finanziario caratterizzato da elevata volatilità, identificare con precisione i livelli di supporto e resistenza è fondamentale affinché i trader possano prendere decisioni informate. Predictive Ranges Scanner Multi-TF è uno strumento avanzato progettato
    Special offer : ALL TOOLS , just $35 each! New tools   will be   $30   for the   first week   or the   first 3 purchases !  Trading Tools Channel on MQL5 : Join my MQL5 channel to update the latest news from me Il Fibonacci Confluence Toolkit Multi-Timeframe è uno strumento avanzato di analisi tecnica progettato per trader professionisti, che aiuta a identificare potenziali zone di inversione del prezzo combinando segnali e modelli chiave del mercato. Con capacità di visualizzazione multi-timef
    Special offer : ALL TOOLS , just $35 each! New tools   will be   $30   for the   first week   or the   first 3 purchases !  Trading Tools Channel on MQL5 : Join my MQL5 channel to update the latest news from me I. Introduzione Market Structure Trend Targets Scanner è uno strumento potente per analizzare le tendenze di mercato, identificare i punti di breakout e gestire il rischio tramite uno stop loss dinamico. Tracciando i massimi e i minimi precedenti per individuare i breakout, questo strum
    Special offer : ALL TOOLS , just $35 each! New tools   will be   $30   for the   first week   or the   first 3 purchases !  Trading Tools Channel on MQL5 : Join my MQL5 channel to update the latest news from me L'indicatore Zero Lag MA Trend Levels MT5 con Scanner combina la media mobile senza ritardo (ZLMA) con una media mobile esponenziale (EMA) standard, offrendo ai trader una visione completa del momentum di mercato e dei livelli di prezzo chiave. Inoltre, le funzionalità di scanner e aller
    Special offer : ALL TOOLS , just $35 each! New tools   will be   $30   for the   first week   or the   first 3 purchases !  Trading Tools Channel on MQL5 : Join my MQL5 channel to update the latest news from me L'indicatore Liquidity Pools è uno strumento avanzato che identifica e segna potenziali zone di liquidità sul grafico analizzando aree di massimo e minimo con frequenti tocchi di stoppino, insieme al numero di rivisitazioni e al volume scambiato all'interno di ciascuna zona. Questo strum
    Special offer : ALL TOOLS , just $35 each! New tools   will be   $30   for the   first week   or the   first 3 purchases !  Trading Tools Channel on MQL5 : Join my MQL5 channel to update the latest news from me Massimizza il tuo vantaggio nel trading con Follow Line con Scanner, un indicatore avanzato basato sulla volatilità progettato per trader seri. Questo strumento combina la potenza delle Bande di Bollinger con impostazioni personalizzabili, offrendo intuizioni precise sui movimenti dei pr
    FREE
    Filtro:
    totee toto
    54
    totee toto 2025.02.17 12:07 
     

    Interest indicator. Help for my trading.Well done.

    Duc Hoan Nguyen
    21592
    Risposta dello sviluppatore Duc Hoan Nguyen 2025.02.17 12:16
    Thank you for your review!
    I’m glad to hear that the indicator has been helpful for you.
    Wishing you successful trading!
    Yusuf Hamzah
    721
    Yusuf Hamzah 2024.12.17 14:03 
     

    Unique. RSI + KDE. Scientifically sound. The concept provides a good unbiased additional confirmation of a possible reversal. Well done.

    Duc Hoan Nguyen
    21592
    Risposta dello sviluppatore Duc Hoan Nguyen 2024.12.17 14:13
    Thank you for your positive review.
    I'm pleased that product met your expectations.
    Wishing you continued success in your trading!
    danmar
    1774
    danmar 2024.12.04 06:11 
     

    i buy this one because i read the review of XANKEEZ on the other excellent product that i bought Volumetric Order Blocks MT4 Multi Timeframe and it is also a great one which works very well with volumetric : Well Done and today i upload the new version with new functionalities that i ask yesterday 3 december for future update! so quick and for me he makes my chart clearer and with less space taken for the MTF with use of Y negative to hide upper part of title Then THANK YOU A LOT. few sellers take really the asking of their buyers (even i understand that all asking could not be taken). Here it is a very quick update , user support is excellent, thank you again.

    Duc Hoan Nguyen
    21592
    Risposta dello sviluppatore Duc Hoan Nguyen 2024.12.04 10:23
    Thank you for your review!
    I'm glad the indicator meets your needs and makes your trading smoother. Supporting customers is always my top priority.
    Wishing you great success!
    XANKEEZ
    366
    XANKEEZ 2024.11.28 03:54 
     

    one of the indicators i was really interested in but i never thought i would be able to use it on MT4. this is really a great tool. one of MUST HAVE tool for trading. thanks to the author who made it possible.

    Duc Hoan Nguyen
    21592
    Risposta dello sviluppatore Duc Hoan Nguyen 2024.11.28 09:26
    Thank you for your review! Glad to hear the tool is helpful for you.
    Wishing you successful trading!
    Rispondi alla recensione
    Versione 2.10 2025.02.27
    Optimized dashboard algorithm
    Versione 2.0 2024.12.31
    - Optimized the algorithm to make the indicator a little faster.
    - Improved user experience with the dashboard.
    - Added the feature to hide/show indicator on the current chart.
    Versione 1.15 2024.12.03
    - From now on all labels in the indicator will use the font parameter in the scanner section
    - Added label size, label spacing parameter for RSI and KDE Labels
    - Can accept negative numbers for fixed X, Y parameters (be careful when using)
    Versione 1.14 2024.12.02
    Added parameters to fixed the dashboards from the beginning (Movable, fixed X, fixed Y)
    Versione 1.10 2024.11.01
    Fixed a minor bug related to Alerts