Knight
- Indicatori
- Stefan Stoyanov
- Versione: 2.2
- Aggiornato: 23 marzo 2018
- Attivazioni: 10
This indicator shows the market entry and exit points.
It is good for both beginners and professional traders.
The product works on any timeframe and financial instrument.
The indicator is designed for scalping.
It does not redraw.
It is based on the divergence between two moving averages, which have a special smoothing algorithm.
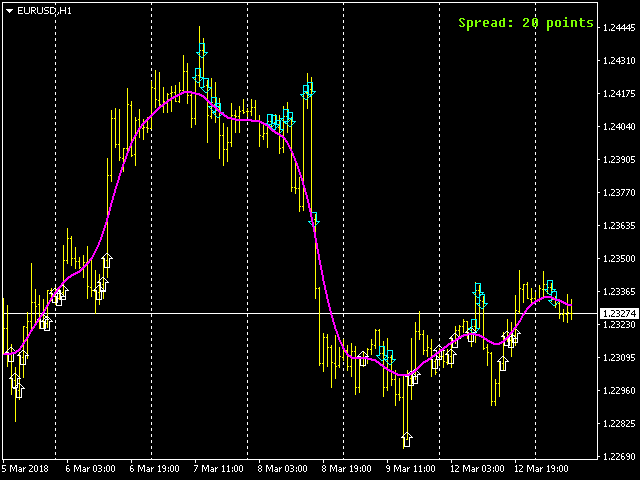
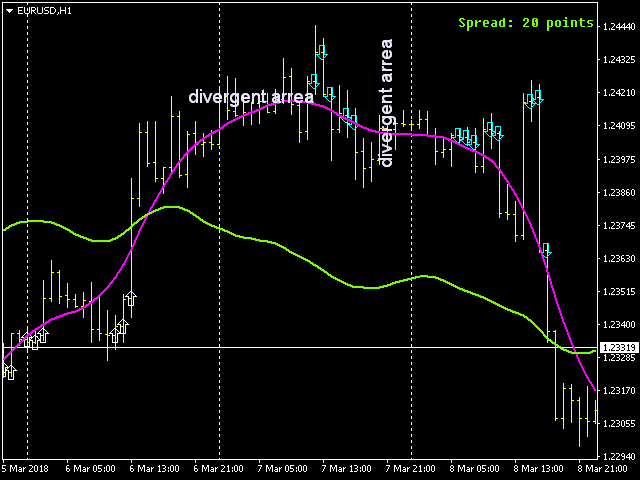
The first moving average is colored in Magenta. It indicates the general movement of the trend.
The second moving average is colored in LawnGreen. It appears on the chart, when mode = true. This line is a combination of the difference between several moving averages, similar to the algorithm of Awesome Oscillator. It is not limited to that, as the differences here consist of movements that have a special smoothing algorithm.
In addition, the combination of moving averages differs from the combination of Awesome Oscillator.
This makes the indicator faster and more efficient than Awesome Oscillator.
- If the first moving average is moving upwards, while the second line moves downwards, it means a divergence that should be avoided.
- If both moving averages move in the same direction, look for market entry opportunities.
White and blue arrows indicate the potential entry points.
Parameters
- Bar - the number of bars for calculating the indicator
- M - period of the moving averages
- mode - mode parameters
- If mode = true, the moving average is visible on the chart
- If mode = false, the moving average is not displayed on the chart
How to set up
To change the parameters, right-click the chart, select Charts => Indicators List => Knight => Edit.
The indicator's window will appear. Set parameters.
Save the template: right-click on the chart, select Charts => Template => Save Template


Repaints