Daily Bias Simplified
- Indicatori
- Obakeng Chiliwa
- Versione: 1.10
- Aggiornato: 19 febbraio 2025
- Attivazioni: 10
Daily Bias Simplified is a user-friendly tool that helps traders quickly identify the daily market direction and potential liquidity levels. It displays the daily bias, allows customization of text position and font, and now generates trading signals based on market conditions. The price level line is fully customizable in terms of color, width, and length, making it a powerful addition to any trading strategy.
Key Features:
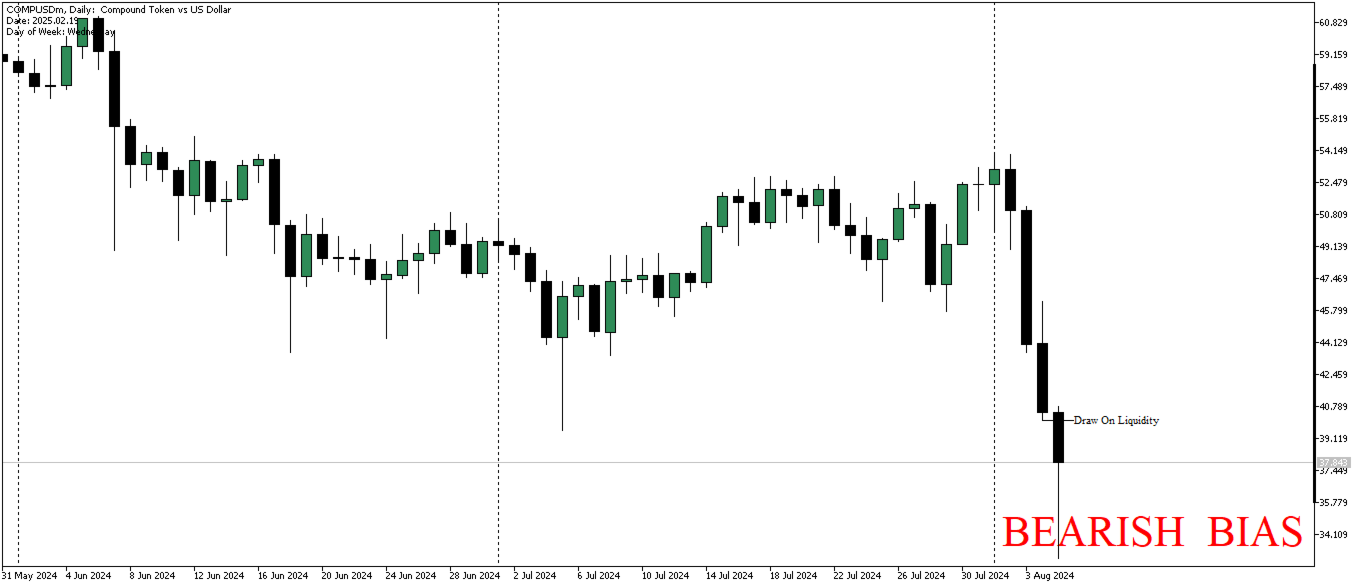
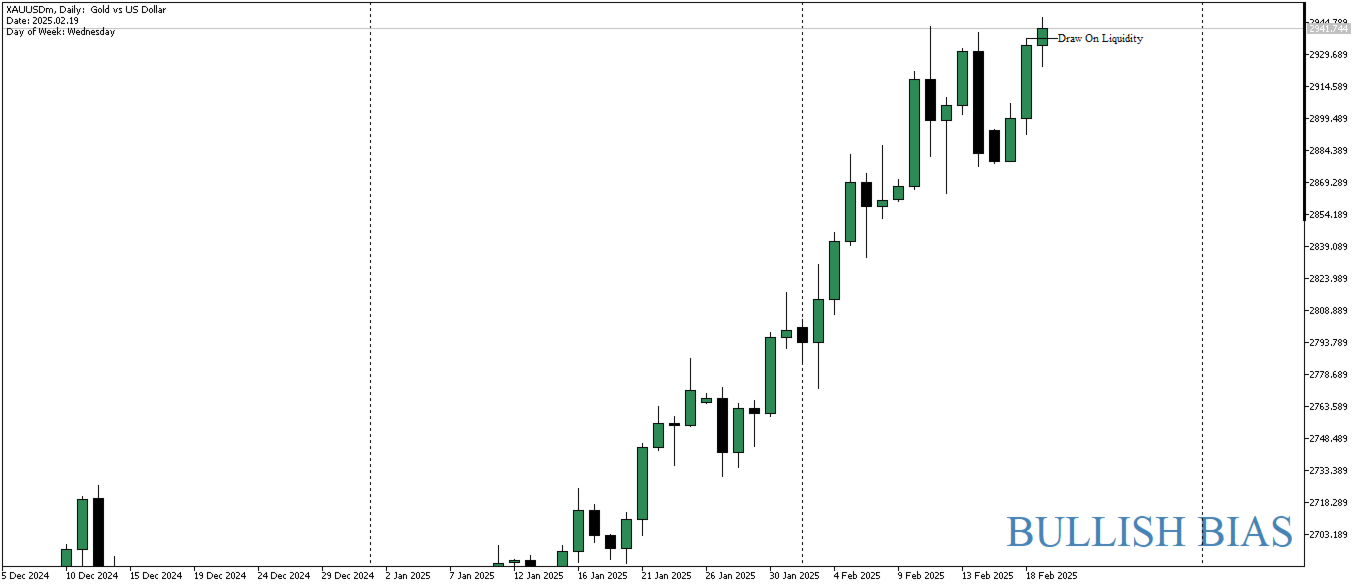
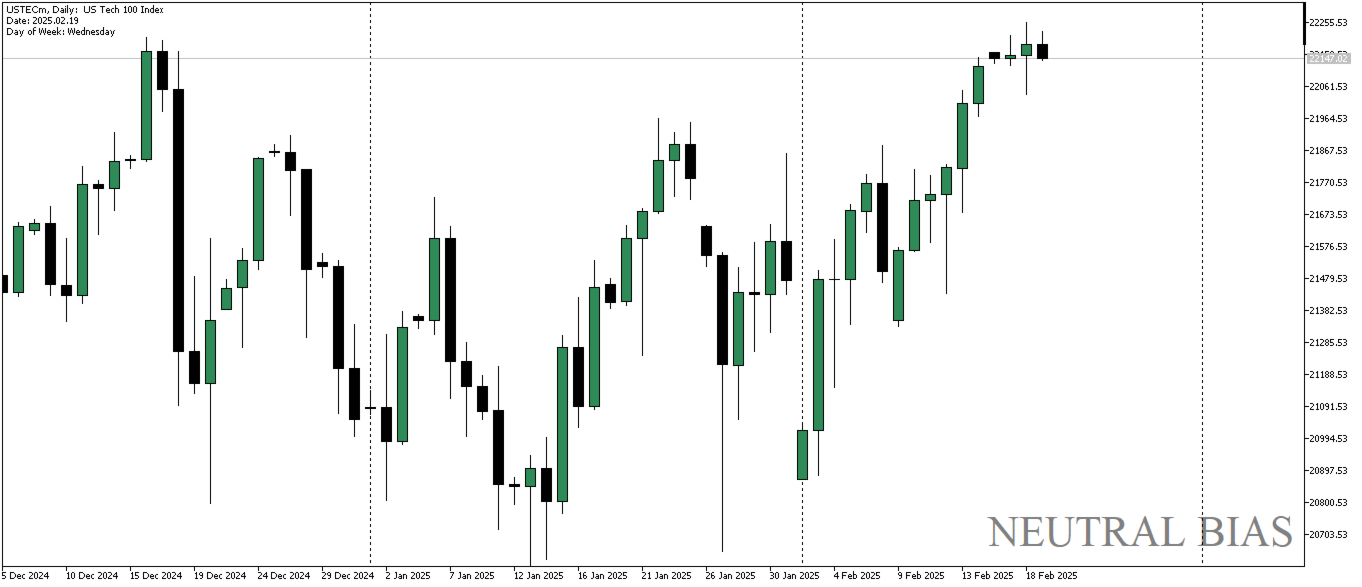
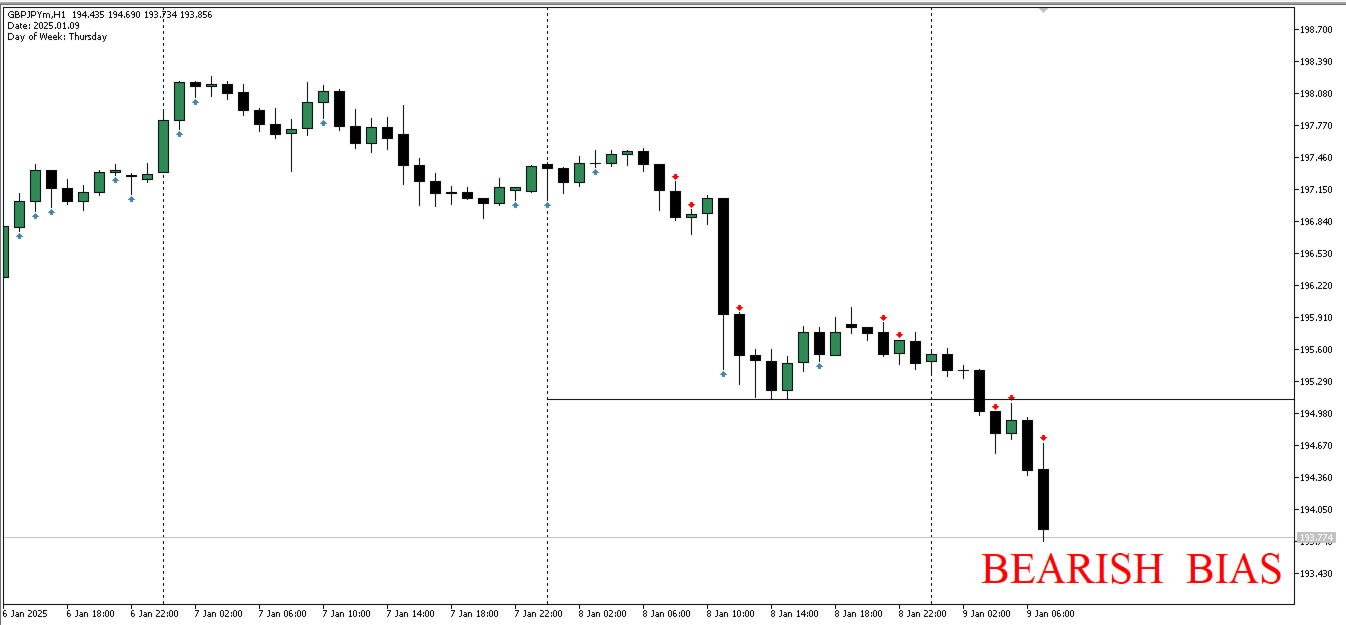
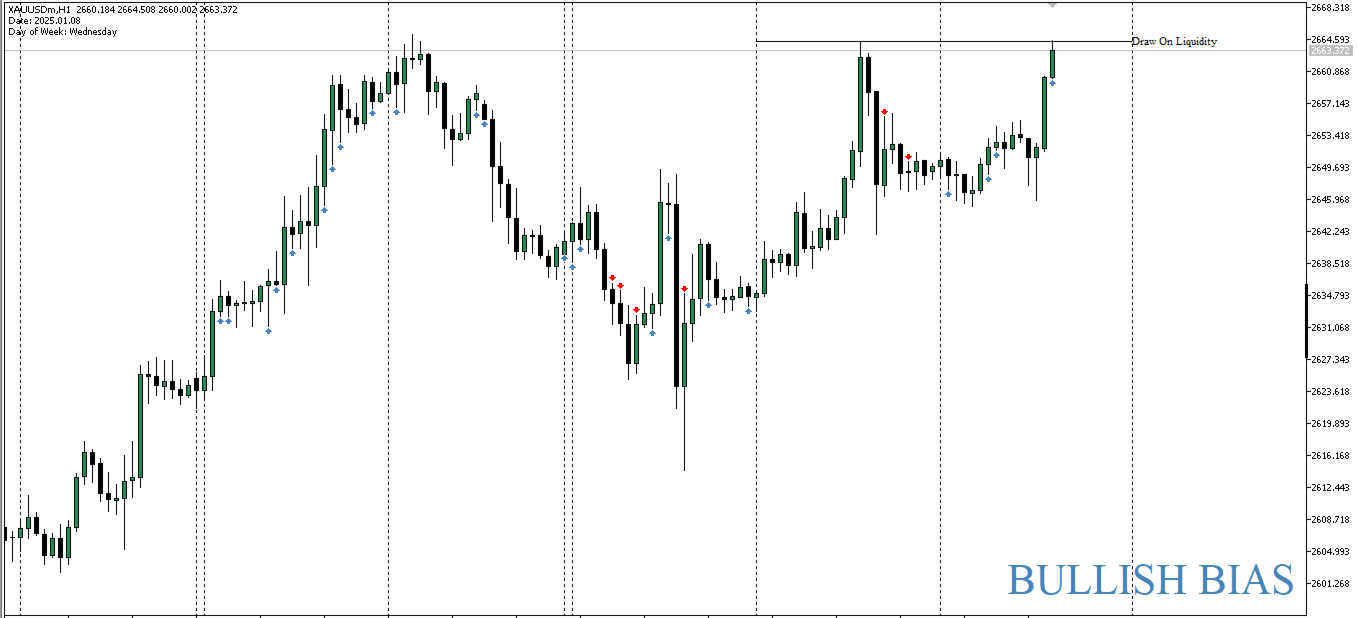
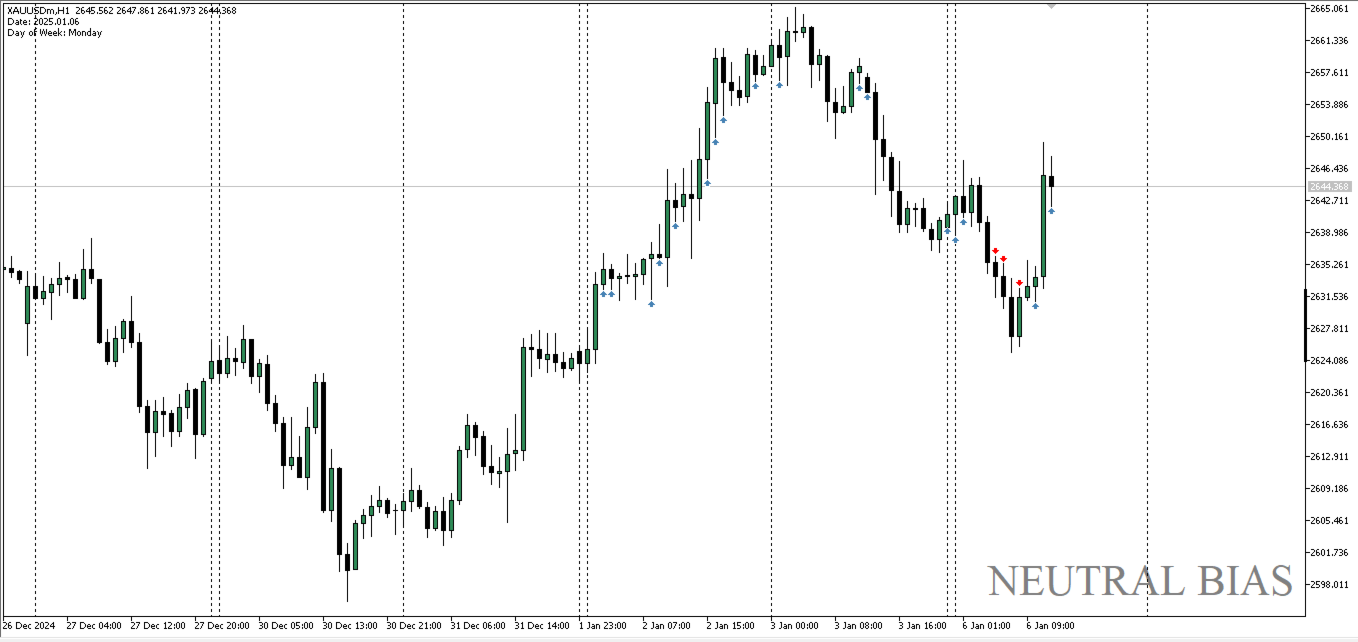
- Daily Market Bias: Automatically displays whether the market is bullish or bearish for the day.
- Finacial Instruments: Indicator was designed for all assets, however user has to choose the asset.
- Liquidity Levels: Draws a horizontal line indicating the possible draw on liquidity, helping you identify critical price zones.
- Trading Signals: Draws arrows based on the bias, Blue arrows for buy and Red arrows for sell signals.
- Customizable Appearance: Users can input the color, width, and length of the liquidity line, tailoring the indicator to fit their charting preferences.
How It Works:
- Daily Bias: The indicator clearly writes the market's daily bias on the chart (bullish/bearish/neutral).
- Custom Liquidity Line: A horizontal line is drawn on the chart to denote the liquidity price level.
- Trading signals: Red for sell, Blue for buy, the signals are non-repaint. When the bias is bullish, the indicator paints only buy signals, bearish bias—only sell signals, when the bias is neutral, both buy and sell signals are shown
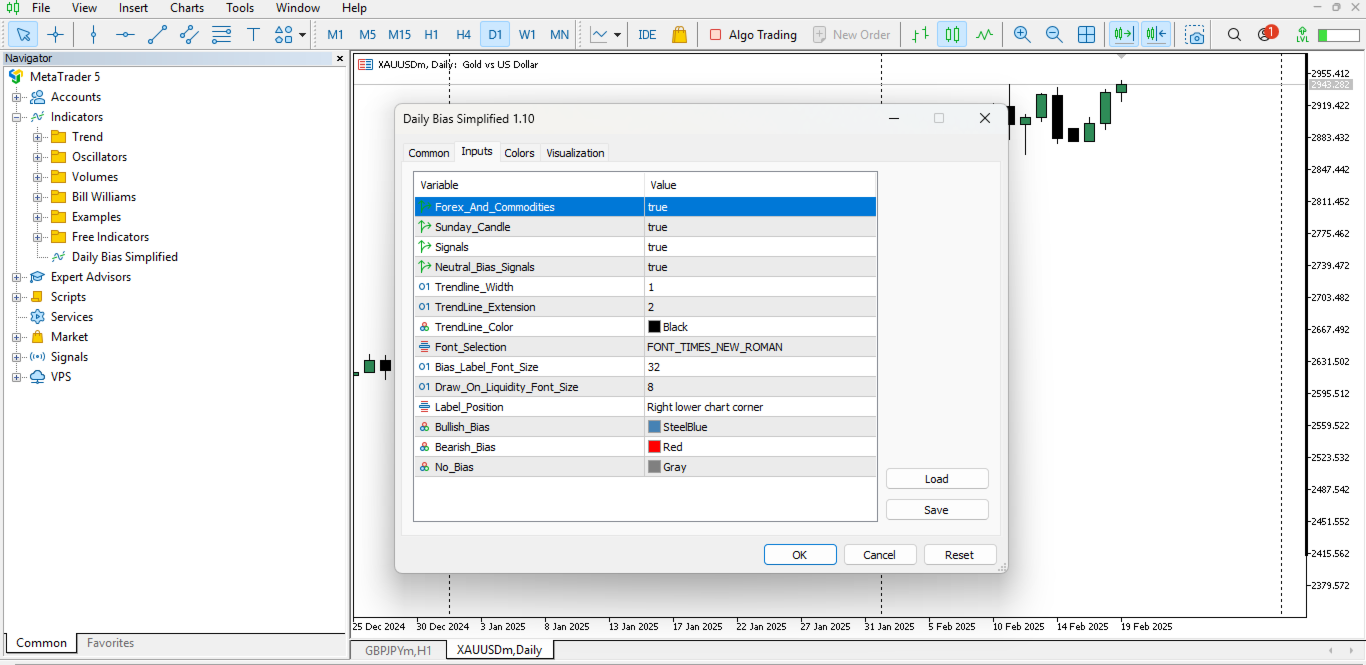
Parameters:
- Forex and Commodities: Set to true when trading Forex, Indices, Stocks, Cryptos, Futures, and Commodities. Set to false when trading Synthetic Indices.
- Sunday Candle: Set to true when Sunday candles are present on the chart.
- Signals: Set to true to show trading signals.
- Neutral Bias Signals: Set to true to show signals when the bias is neutral.
- Trendline Width: Defines the thickness of the liquidity line.
- Trendline Extension: Specifies the distance the line will extend, where a value of 2 indicates that the line will be drawn from the previous day's open to the current day's close.
- Trendline Color: Select the color of the line indicating the potential draw on liquidity.
- Font Selection: Select the font of the bias and draw on liquidity label.
- Bias label font size: Set the font size of the bias label.
- Draw on liquidity font size: Set the font size of the draw on liquidity label.
- Label position: Select the position of the Bias label on the Chart.
- Bullish Bias: Selects the color of the bullish bias text.
- Bearish Bias: Selects the color of the bearish bias text.
- No Bias: Select the color of neutral bias text.