TDSequential Scanner
- Indicatori
- George Njau Ngugi
- Versione: 1.1
- Aggiornato: 24 settembre 2024
- Attivazioni: 5
To access the TD sequential Scanner for MT5, please check https://www.mql5.com/en/market/product/123369?source=Site+Market+My+Products+Page. One of the MT5 versions includes additional timeframes such as M1, M2, M3,H2,H6,H8 and so on.(https://www.mql5.com/en/market/product/123367?source=Site+Market+My+Products+Page)
TD Sequential Scanner: An Overview
The TD Sequential scanner is a powerful technical analysis tool designed to identify potential price exhaustion points and trend reversals in financial markets. Developed by Tom DeMark, this method is widely used by traders to gauge market cycles and potential turning points with precision.
How It Works:
-
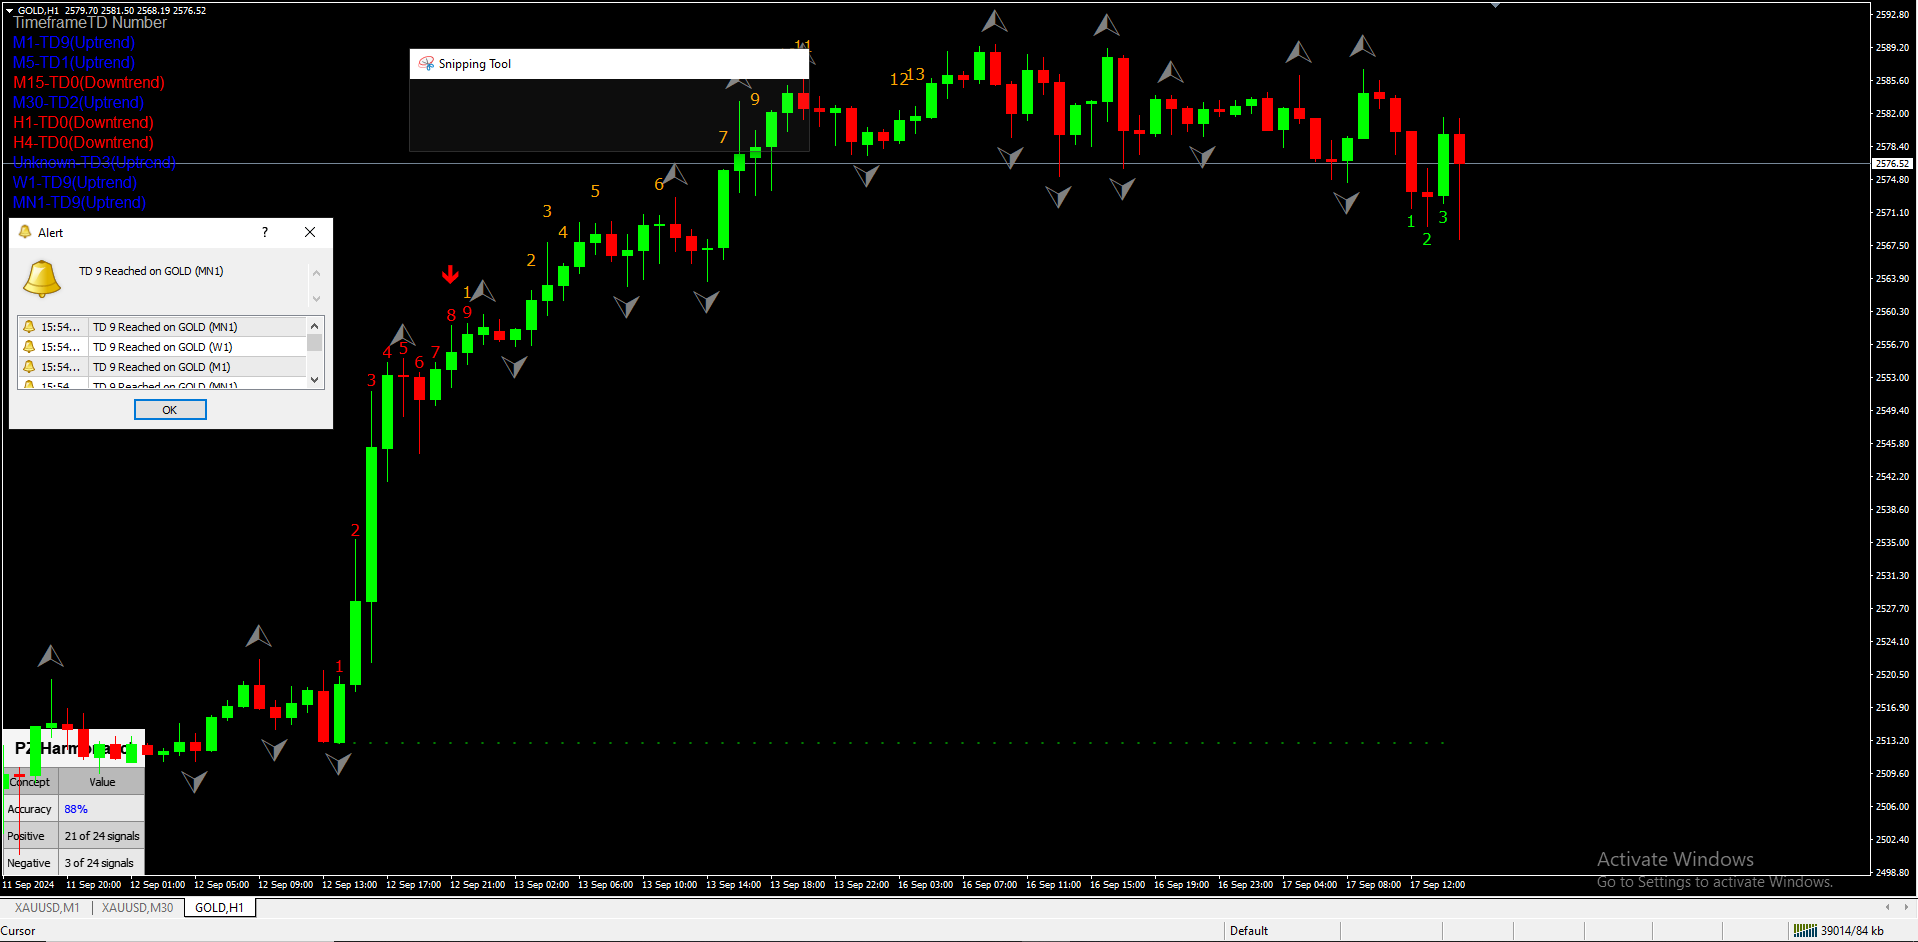
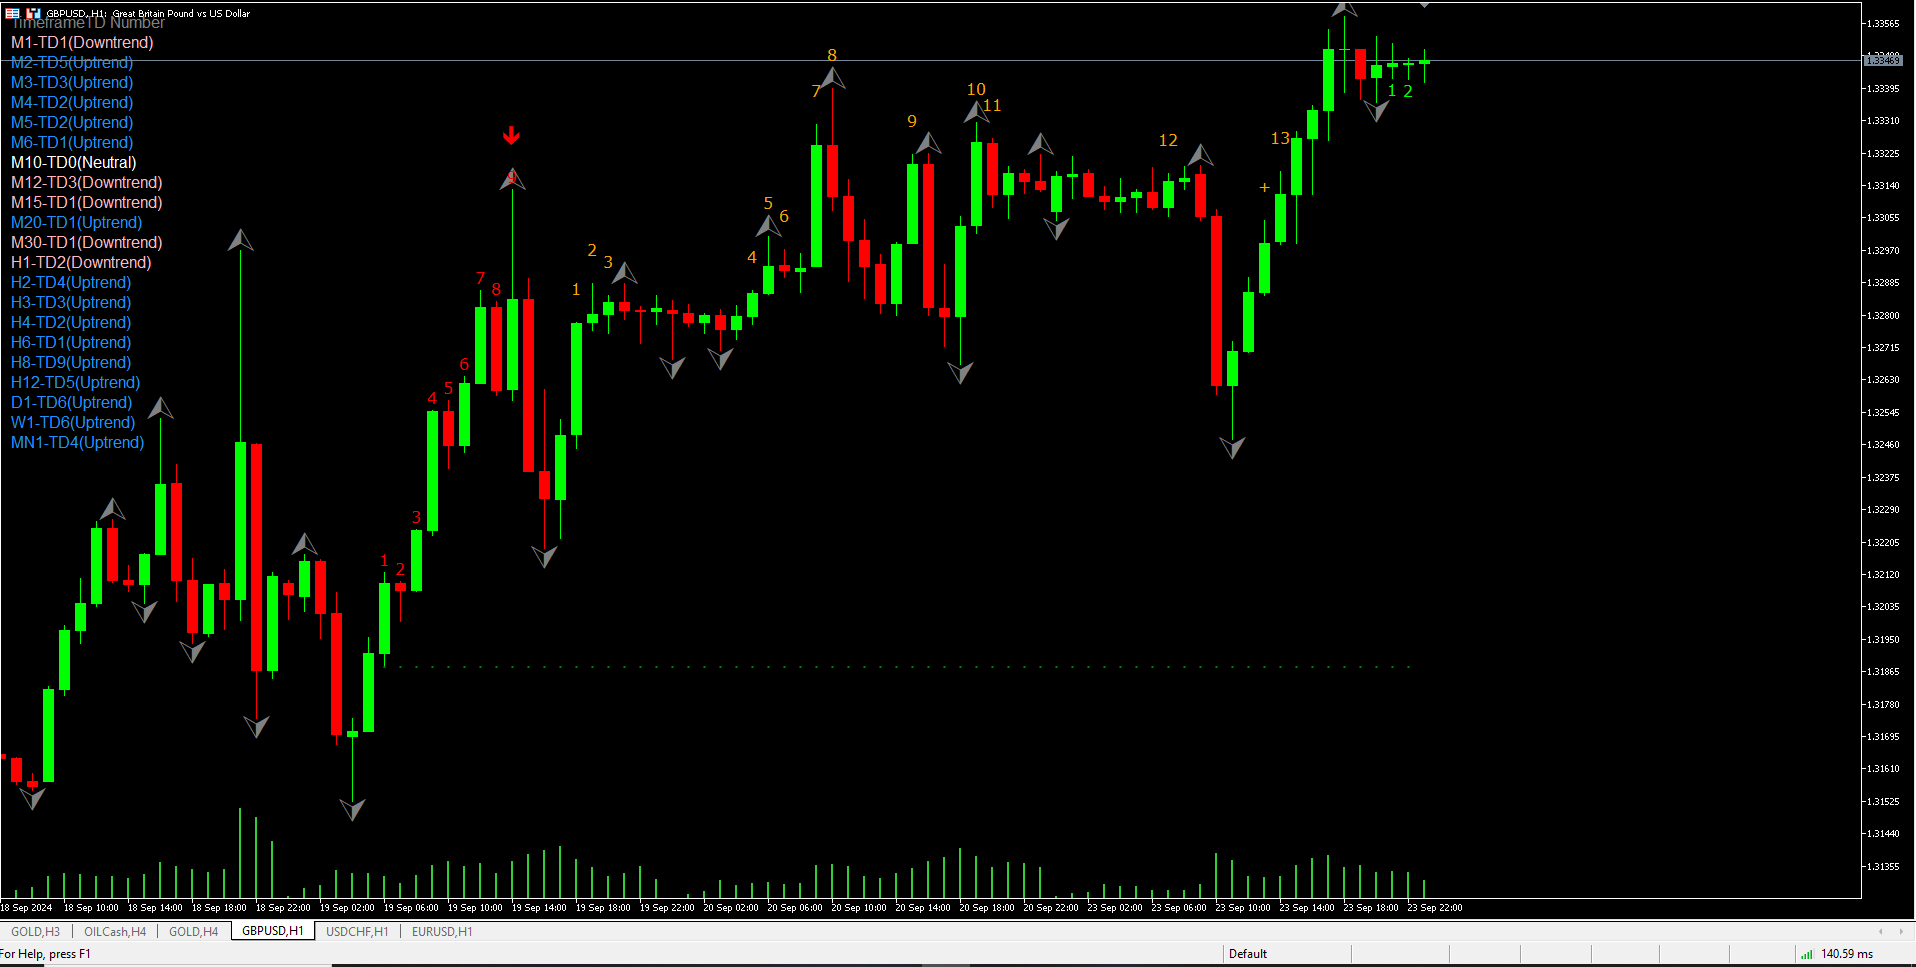
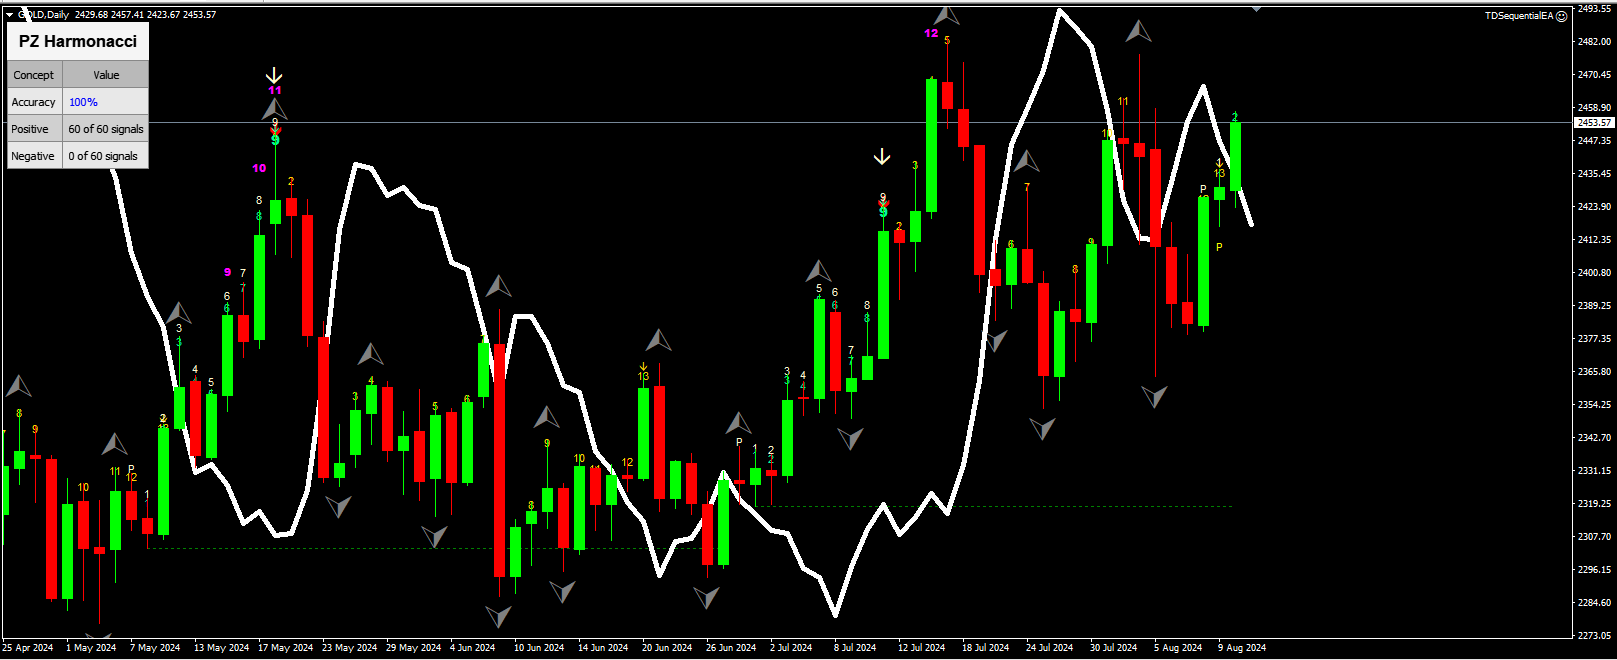
Sequential Count: The core of the TD Sequential indicator is its sequential counting mechanism. The scanner identifies a sequence of price bars where each bar must close higher (or lower) than the close of the bar four periods earlier. The sequence is divided into two distinct phases:
- Setup Phase: This phase consists of a series of consecutive bars where each bar’s close is higher than the close four bars earlier (for a bullish setup) or lower (for a bearish setup). The goal is to identify a count of 9 bars in this phase.
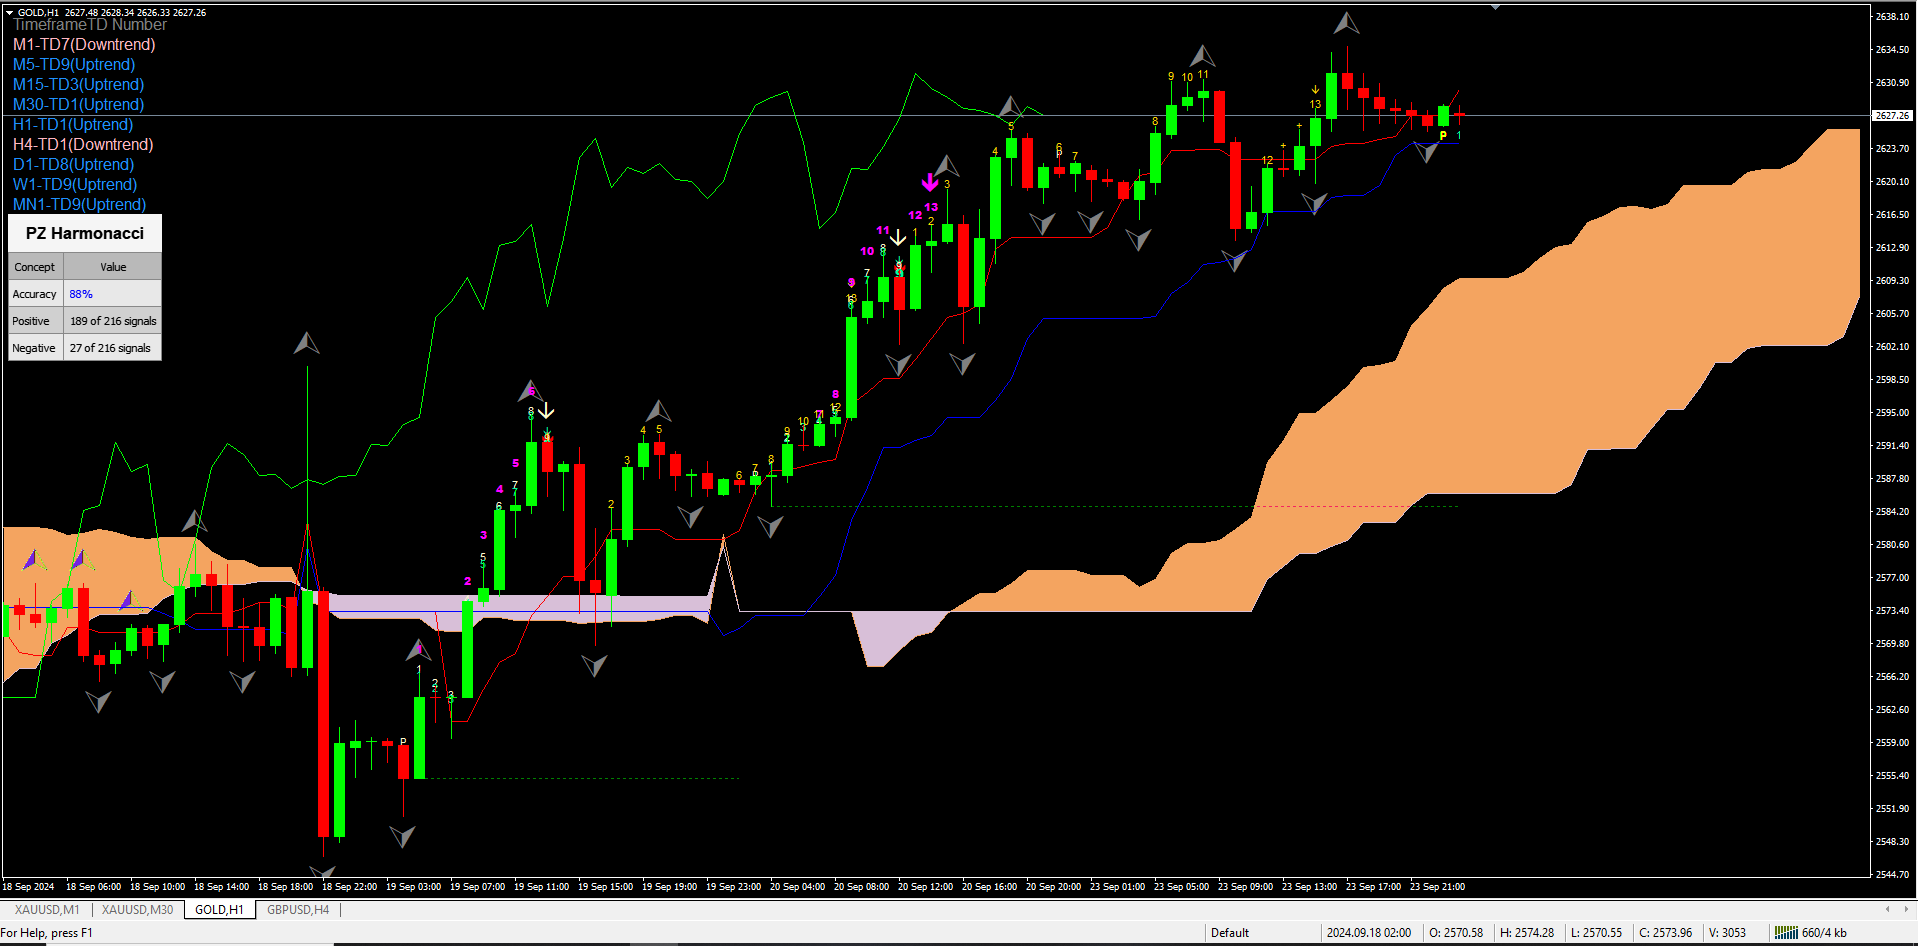
- Countdown Phase: Following the setup, the countdown phase tracks a series of bars where each bar’s close is lower (for a bullish countdown) or higher (for a bearish countdown) than the close two bars earlier. The countdown phase aims to achieve a count of 13 bars.
-
Signal Generation: The TD Sequential scanner generates buy or sell signals based on the completion of these phases. A completed setup followed by a successful countdown phase typically indicates a high probability of a reversal or significant price correction. Specifically:
- A Bullish Signal is generated when a countdown phase reaches 13 after a completed bullish setup.
- A Bearish Signal is indicated when a countdown phase reaches 13 after a completed bearish setup.
-
Application: Traders utilize the TD Sequential scanner to spot potential reversal points in various time frames, from intraday to long-term charts. By integrating these signals with other technical analysis tools and market insights, traders can make informed decisions about entry and exit points, enhancing their trading strategies.
Key Features:
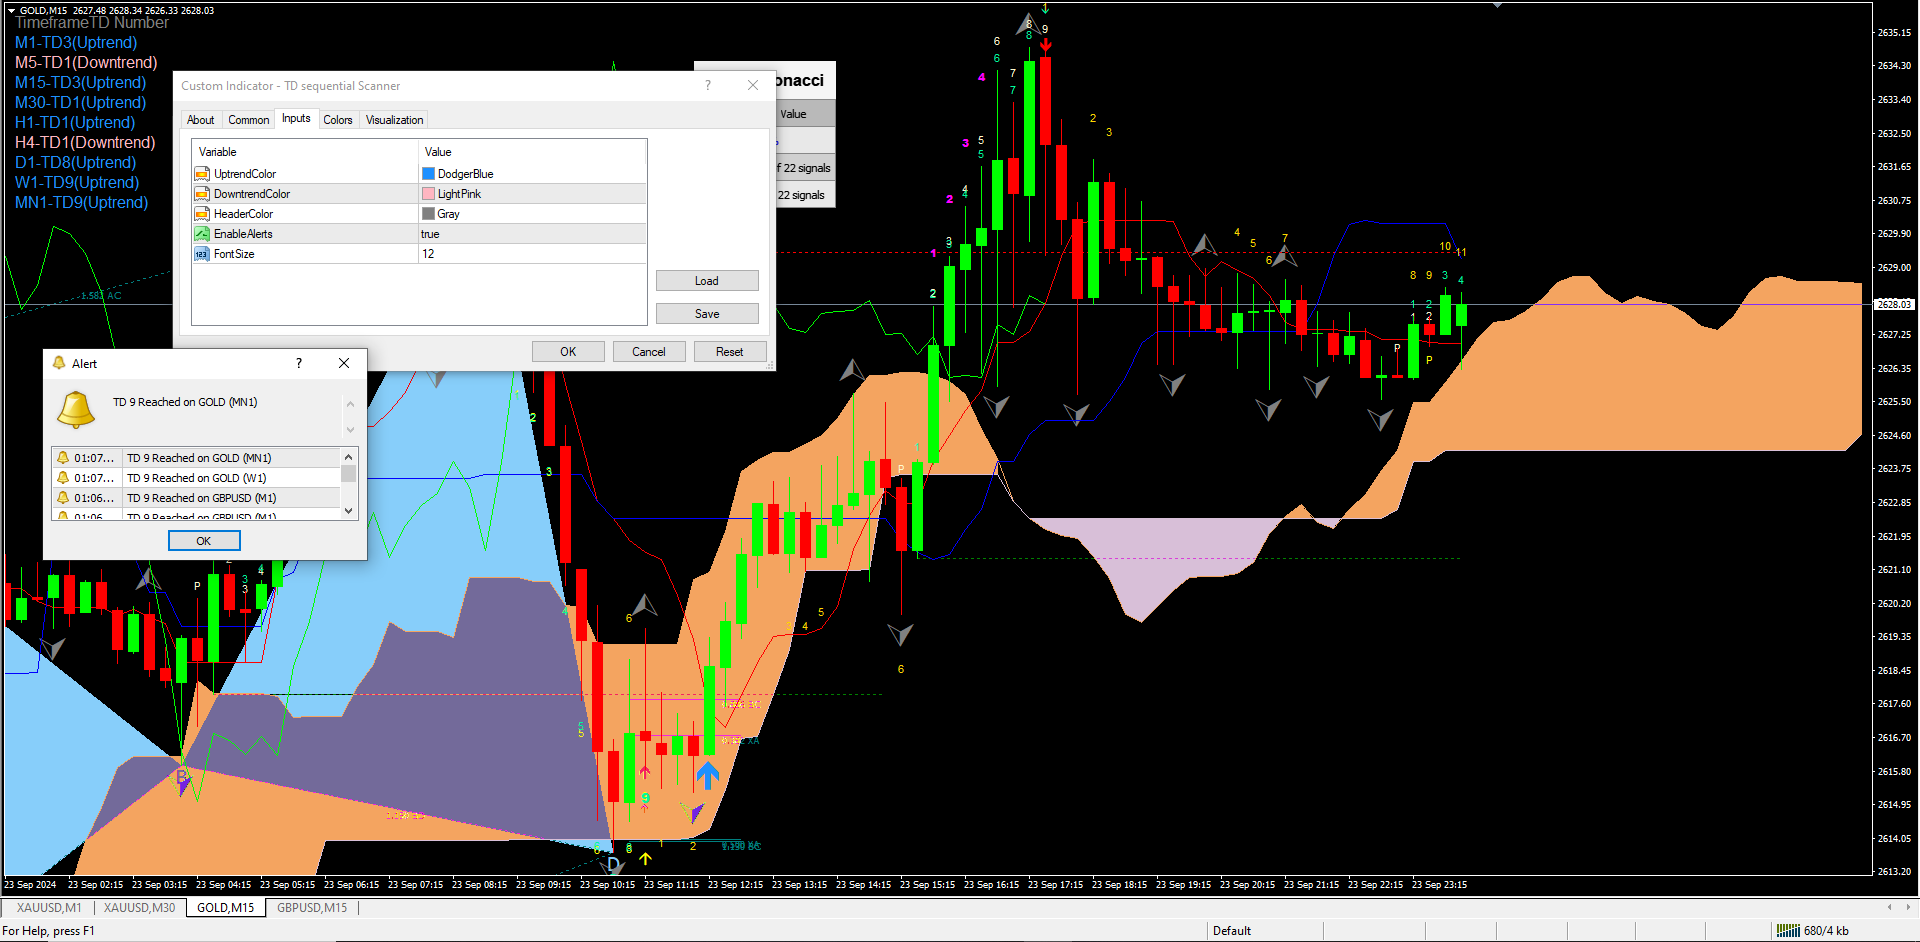
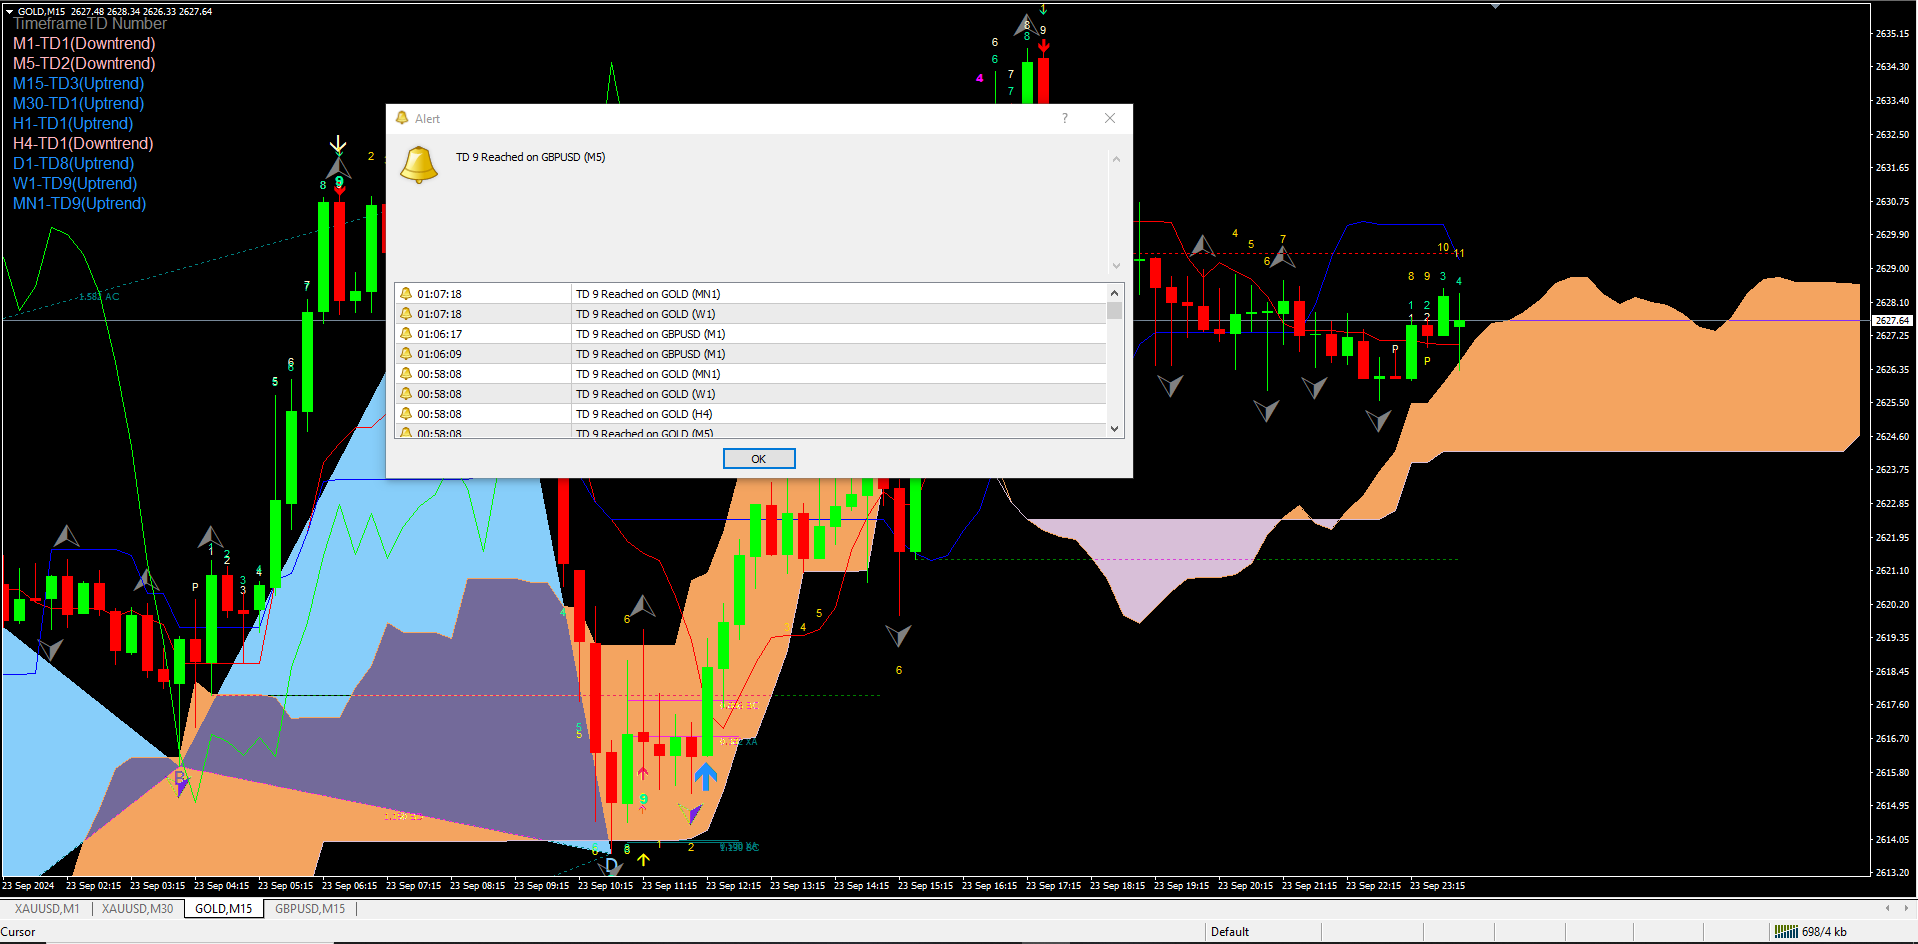
- Alerts and Notifications: The scanner provides real-time alerts when setup and countdown phases are completed, allowing traders to react promptly to potential market changes.
- Customizable Settings: Adjust the parameters and thresholds to align the TD Sequential scanner with your trading style and market conditions.
By incorporating the TD Sequential scanner into your trading toolkit, you gain access to a sophisticated method for detecting market exhaustion and potential trend reversals. This tool is invaluable for traders seeking to refine their analysis and improve their trading performance.