TradingSessionPipsVisualizer
- Indicatori
- Komi Eyram F Kahoho
- Versione: 1.5
- Aggiornato: 4 ottobre 2024
- Attivazioni: 10
Before diving into the features of this indicator, please remember to rate this product, leave a comment to share your experience, and subscribe to my page to stay informed about the latest updates and new tools. Your support is invaluable and helps me constantly improve my creations!
Description:
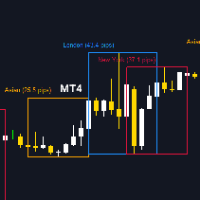
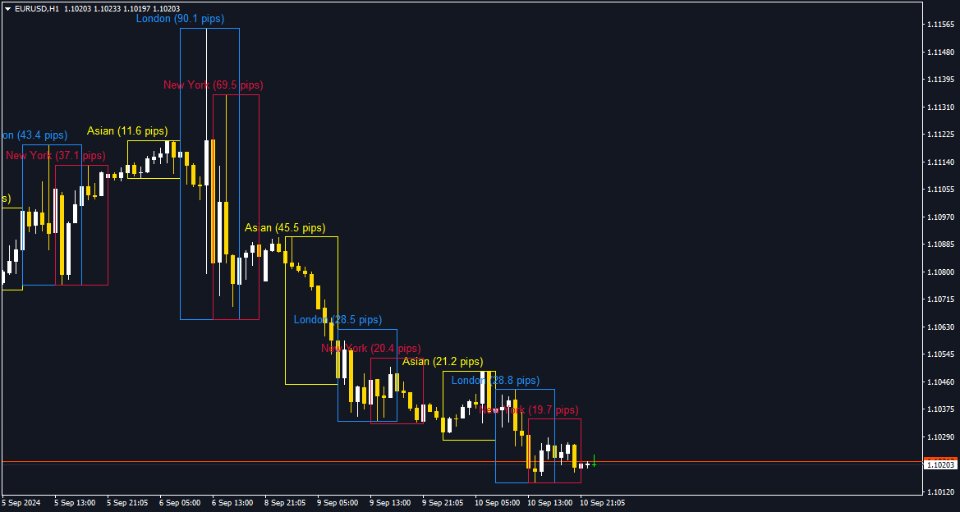
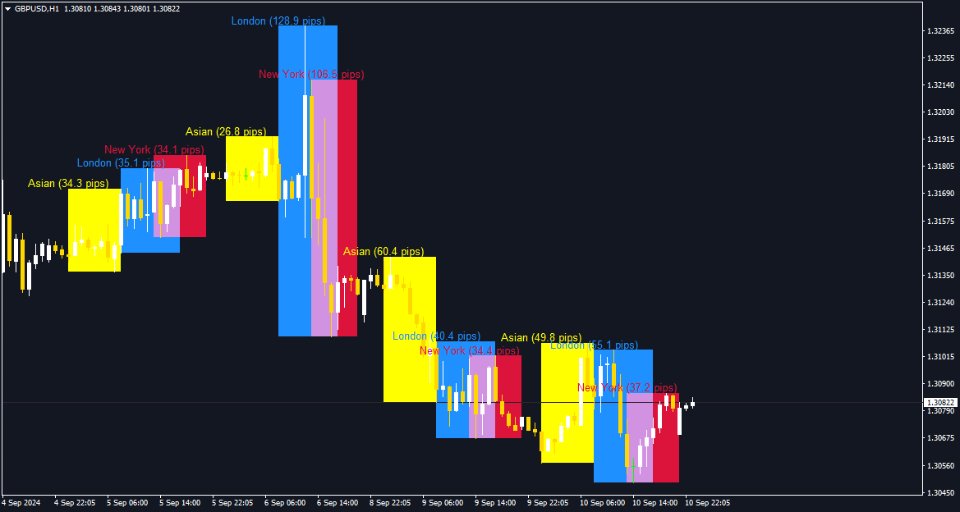
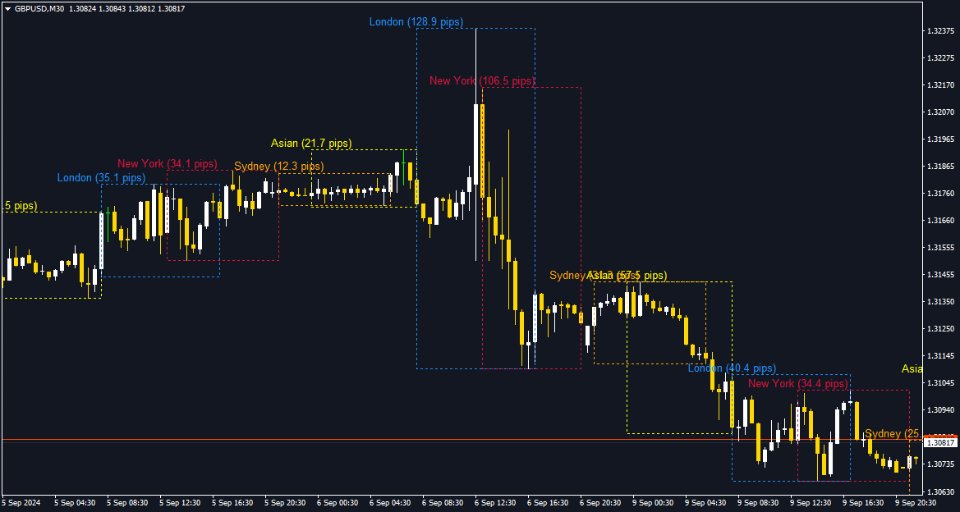
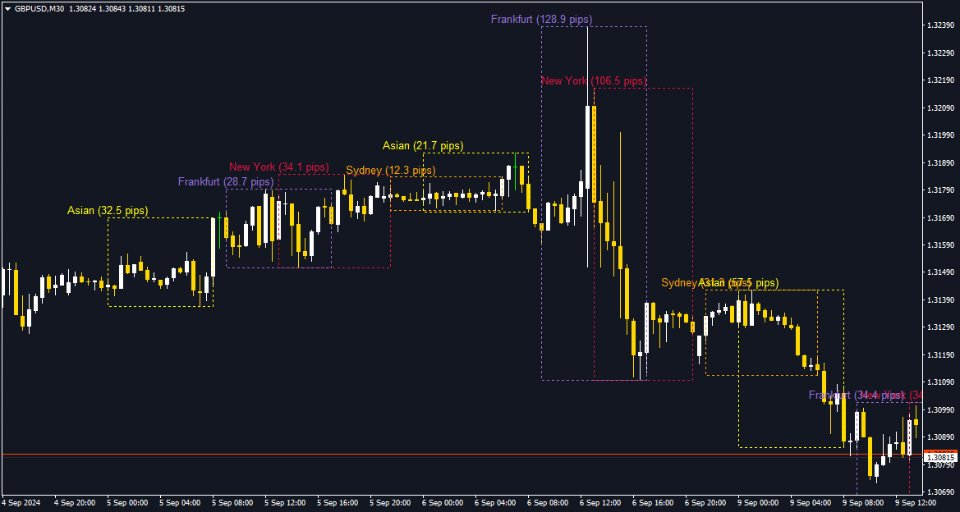
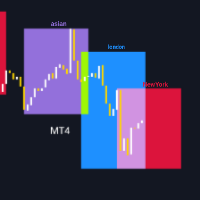
The TradingSessionPipsVisualizer is a powerful MetaTrader 4 indicator designed to visually represent major trading sessions on your charts. This tool allows you to easily distinguish between various trading sessions such as Asian, London, New York, Sydney, and Frankfurt, helping you better understand market movements during these key periods.
Key Features:
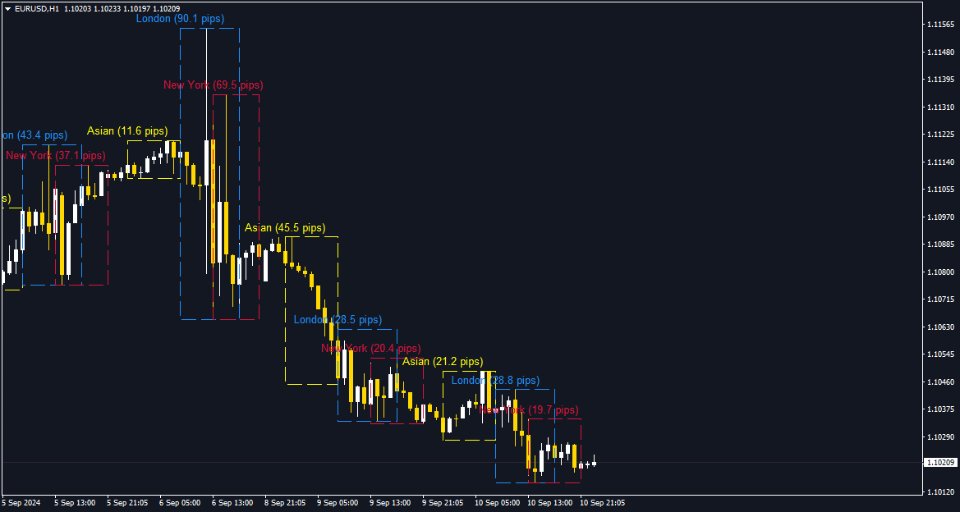
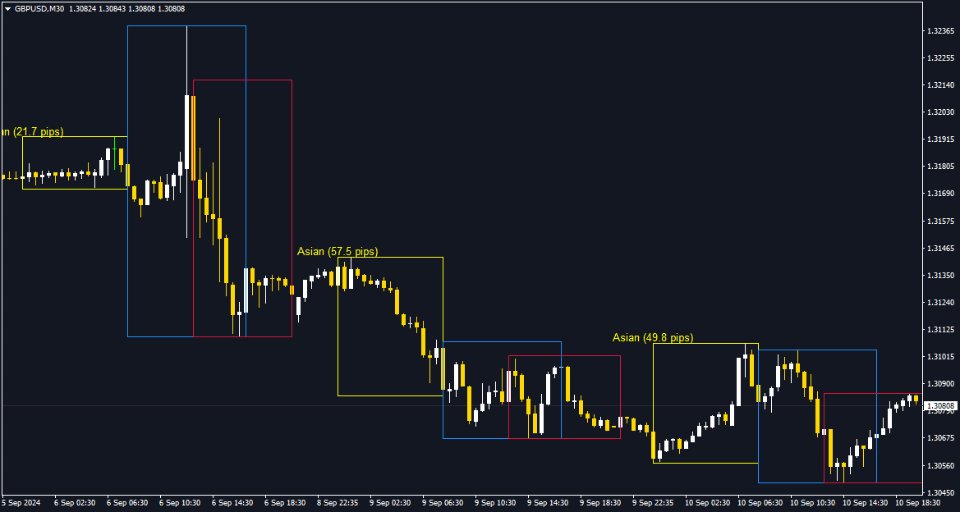
- Trading Session Visualization: Clearly visualize Asian, London, New York, Sydney, and Frankfurt trading sessions with color-coded rectangles on your chart.
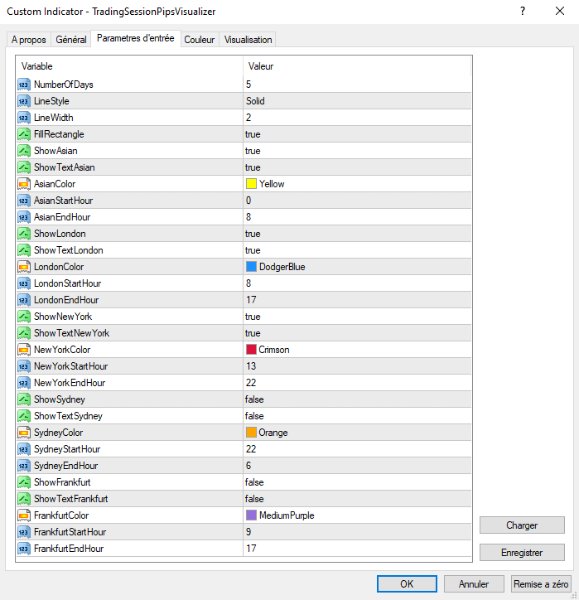
- Customizable Parameters: Adjust the color, line width, and filling options for each session's rectangle to fit your preferences.
- Dynamic Display: The indicator adapts automatically based on the number of days you choose to display, with no limit on the number of days.
- Easy Management: Efficiently manages graphical objects by removing old ones and updating with new ones.
Indicator Settings:
- Number of Days: Display sessions for an unlimited number of days.
- Color and Style: Customize the colors and line styles of each session’s rectangles.
- Rectangle Filling: Choose whether to fill the rectangles or show only the borders.
How to Use:
- Installation: Download and install the indicator in the MetaTrader 4 indicators directory.
- Configuration: Adjust the settings according to your preferences directly in the indicator's configuration panel.
- Analysis: Observe the trading sessions on your chart for better decision-making.
Feel free to explore the features and adjust the settings to get the most out of your market analysis. Thank you for your support, and happy trading!
