• Panoramica
  • Recensioni
  • Commenti
  • Novità

Imbalance DOM Pro

Imbalance DOM Pro: Potenzia le tue operazioni con il disequilibrio del libro ordini 📊🚀

🔎 Opportunità nei piccoli movimenti di prezzo
Imbalance DOM Pro è uno strumento essenziale per gli analisti che operano con il flusso degli ordini. Perfetto per i scalper, è stato progettato per coloro che desiderano sfruttare le piccole oscillazioni di prezzo con alta precisione. Con un calcolo avanzato, l'indicatore identifica i disequilibri nel libro ordini, fornendo segnali preziosi per entrate e uscite rapide.

💡 IMPORTANTE: Disponibilità del libro ordini su MT5
Prima di utilizzare Imbalance DOM Pro, assicurati che il tuo broker offra l'accesso al libro ordini su MT5. L'indicatore dipende da questi dati in tempo reale, poiché la piattaforma MT5 non memorizza la cronologia del libro ordini, il che significa che l'indicatore funziona solo in tempo reale e fornisce intuizioni immediate sugli ordini di acquisto e vendita sul mercato.

🚀 Vantaggi di Imbalance DOM Pro

1. Analisi avanzata del libro ordini con colori chiari

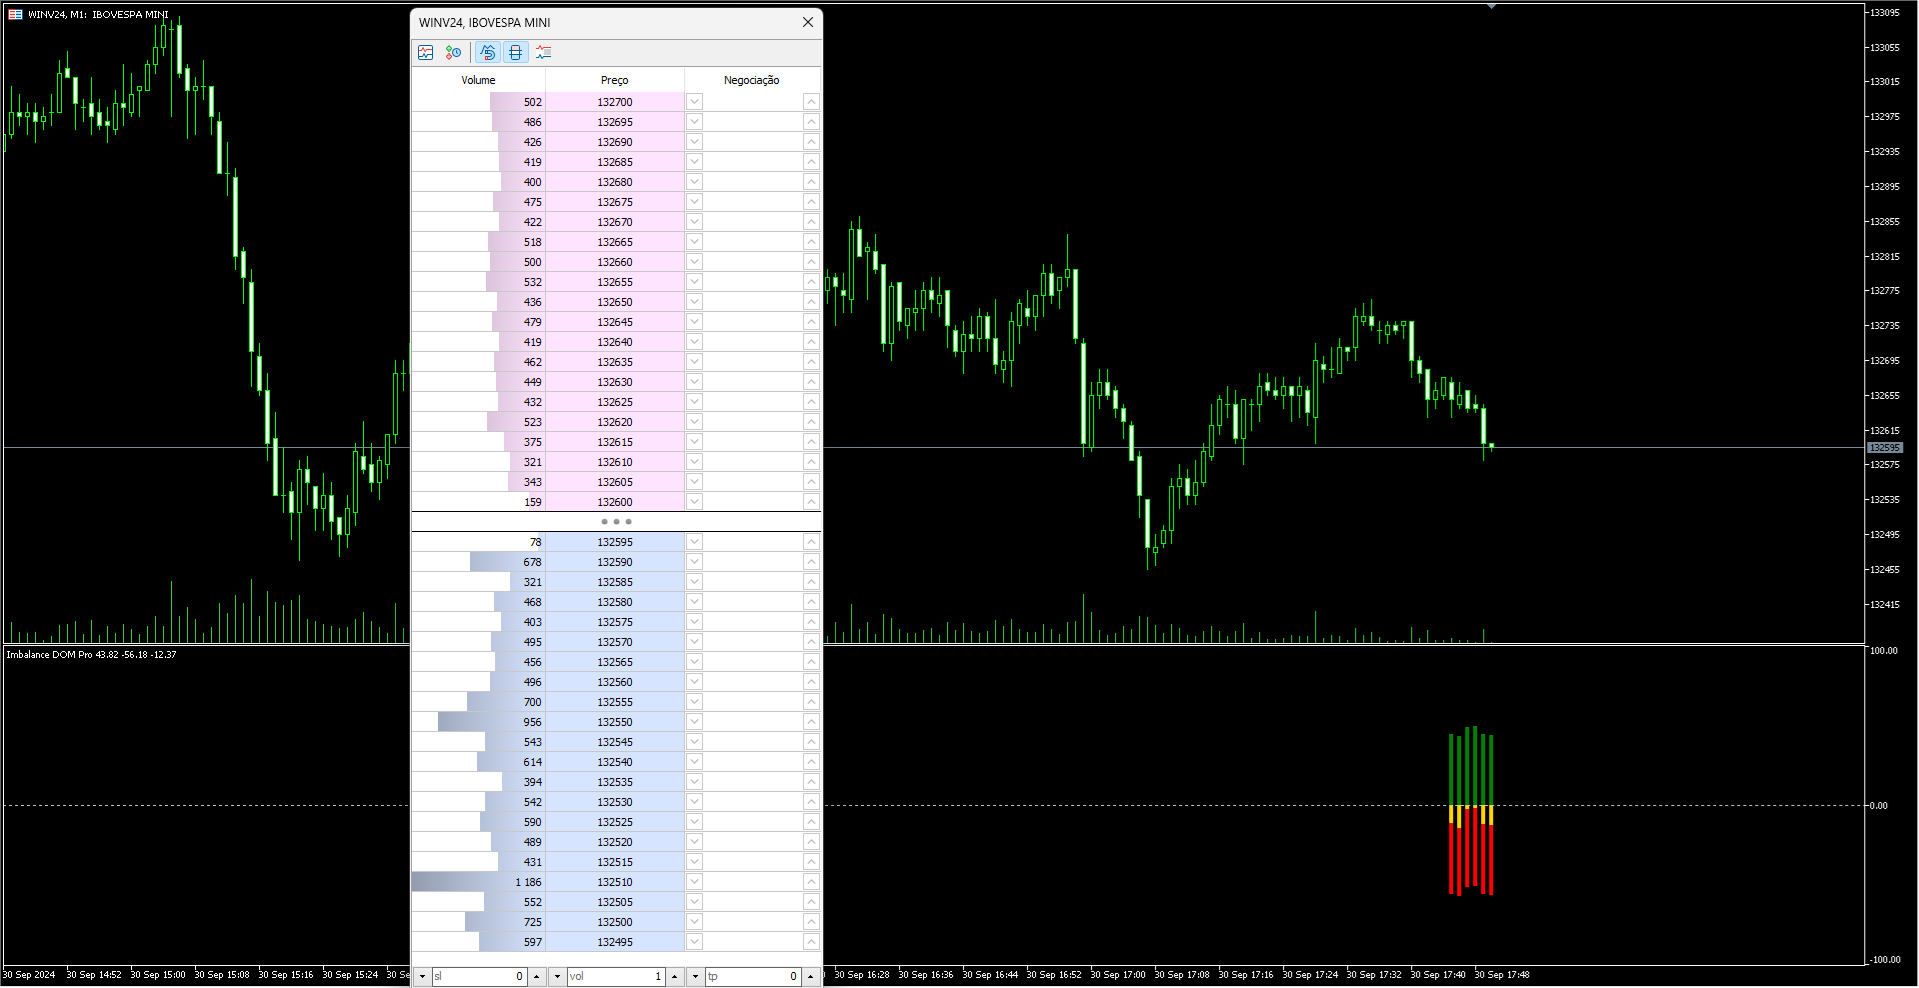
Imbalance DOM Pro facilita la visualizzazione del disequilibrio degli ordini con colori specifici:

  • Verde: Rappresenta gli ordini di acquisto nel libro.
  • Rosso: Rappresenta gli ordini di vendita.
  • Oro: Indica il disequilibrio tra ordini di acquisto e di vendita.

Questi colori permettono una lettura rapida e chiara del flusso degli ordini, ideale per scalping.

2. Segnali di acquisto e vendita in tempo reale

Ottieni segnali chiari e rapidi direttamente sul tuo grafico, permettendoti di reagire prontamente ai cambiamenti del flusso degli ordini in tempo reale.

3. Ideale per i trader del flusso ordini

Se operi in base al flusso degli ordini, questo indicatore è perfetto per massimizzare la tua efficienza. Offre una visione chiara del disequilibrio tra ordini di acquisto e di vendita, migliorando le tue decisioni con precisione.

4. Compatibile con la creazione di esperti potenti

Imbalance DOM Pro offre buffer per l'integrazione con EA (Expert Advisors). Configura i tuoi buffer per creare un esperto robusto:

  • Buffer 0: Segnale di acquisto
  • Buffer 1: Segnale di vendita
  • Buffer 2: Disequilibrio (Oro)

Approfitta di queste funzionalità per automatizzare le tue strategie basate sul disequilibrio del DOM e ottimizzare le tue operazioni.

5. Facile da usare e configurare

Con la sua interfaccia intuitiva e l'analisi precisa del flusso degli ordini, Imbalance DOM Pro semplifica le tue operazioni offrendo un'analisi dettagliata in tempo reale senza complicazioni.


Prodotti consigliati
Noize Absorption Index - is the manual trading system that measures the difference of pressure between bears forces and bulls forces. Green line - is a noize free index that showing curent situation. Zero value of index shows totally choppy/flat market.Values above zero level shows how powerfull bullish wave is and values below zero measures bearish forces.Up arrow appears on bearish market when it's ready to reverse, dn arrow appears on weak bullish market, as a result of reverse expectation.
The Inside Bar e one is a reversal/continuation candle formation, and is one of the most traded candle patterns. Robot F1 allows you to configure different trading strategies, Day Trade or swing trade, based on the Inside Bar as a starting point.  This pattern only requires two candles to perform. Robot F1 uses this extremely efficient pattern to identify trading opportunities. To make operations more effective, it has indicators that can be configured according to your strategy. Among th
Master Calendar Osw
William Oswaldo Mayorga Urduy
CALENDARIO OSW MASTER Questo indicatore è stato inizialmente creato per mio uso personale, ma l'ho migliorato poco a poco e ho implementato funzioni per aiutare il mio trading quotidiano e le funzioni continueranno ad essere implementate se saranno utili. DETTAGLI DEL CALENDARIO. >Calendario mobile e dettagliato delle notizie vicine alla data corrente, con dati quali: data, Paese, Valuta, Settore della notizia, Nome della notizia e Precedente, previsione e Dati attuali. >Il calendario s
PipFinite Trend PRO MT5
Karlo Wilson Vendiola
4.85 (574)
Breakthrough Solution For Trend Trading And Filtering With All Important Features Built Inside One Tool! Trend PRO's smart algorithm detects the trend, filters out market noise and gives entry signals with exit levels. The new features with enhanced rules for statistical calculation improved the overall performance of this indicator. Important Information Revealed Maximize the potential of Trend Pro, please visit www.mql5.com/en/blogs/post/713938 The Powerful Expert Advisor Version Automa
Il livello Premium è un indicatore unico con una precisione superiore all'80% delle previsioni corrette! Questo indicatore è stato testato dai migliori Specialisti di Trading per più di due mesi! L'indicatore dell'autore che non troverai da nessun'altra parte! Dagli screenshot puoi vedere di persona la precisione di questo strumento! 1 è ottimo per il trading di opzioni binarie con un tempo di scadenza di 1 candela. 2 funziona su tutte le coppie di valute, azioni, materie prime, cript
SolarTrade Suite Financial Indicator: Jupiter Market Indicator - La tua guida affidabile nel mondo dei mercati finanziari! Questo è un indicatore di tendenza che utilizza speciali algoritmi innovativi e avanzati per calcolare il suo valore e ha anche un design gradevole alla vista. È molto facile capire le letture di questo indicatore: colore blu - acquisto, rosso - vendita. Dai un'occhiata agli altri nostri prodotti della serie SolarTrade Suite in fondo alla descrizione. Vuoi navigare
Atomic Analyst MT5
Issam Kassas
4.42 (19)
Innanzitutto, vale la pena sottolineare che questo indicatore di trading non è repaint, non è ridisegno e non presenta ritardi, il che lo rende ideale sia per il trading manuale che per quello automatico. Manuale utente: impostazioni, input e strategia. L'Analista Atomico è un indicatore di azione del prezzo PA che utilizza la forza e il momentum del prezzo per trovare un miglior vantaggio sul mercato. Dotato di filtri avanzati che aiutano a rimuovere rumori e segnali falsi, e aumentare il pote
Owl Smart Levels MT5
Sergey Ermolov
4.07 (28)
Versione MT4  |  FAQ L' indicatore Owl Smart Levels è un sistema di trading completo all'interno dell'unico indicatore che include strumenti di analisi di mercato popolari come i frattali avanzati di Bill Williams , Valable ZigZag che costruisce la corretta struttura a onde del mercato, e i livelli di Fibonacci che segnano i livelli esatti di entrata nel mercato e luoghi per prendere profitti. Descrizione dettagliata della strategia Istruzioni per lavorare con l'indicatore Consulente-assistente
How to use Pair Trading Station Pair Trading Station is recommended for H1 time frame and you can use it for any currency pairs. To generate buy and sell signal, follow few steps below to apply Pair Trading Station to your MetaTrader terminal. When you load Pair Trading Station on your chart, Pair Trading station will assess available historical data in your MetaTrader platforms for each currency pair. On your chart, the amount of historical data available will be displayed for each currency pai
Was: $249  Now: $99   Market Profile defines a number of day types that can help the trader to determine market behaviour. A key feature is the Value Area, representing the range of price action where 70% of trading took place. Understanding the Value Area can give traders valuable insight into market direction and establish the higher odds trade. It is an excellent addition to any system you may be using. Inspired by Jim Dalton’s book “Mind Over Markets”, this indicator is designed to suit the
Aroon Precision Trends MT5
Maestri Investment Group Ltd.
Introducing the Aroon Indicator - Your Ultimate Trend Analysis Tool! Are you looking to take your trading game to the next level? Want to identify lucrative entry and exit points in the financial markets with ease? Look no further! The Aroon Indicator is here to revolutionize your trading strategy and help you make informed decisions like never before. Developed by the brilliant mind of Tushar Chande, the Aroon Indicator is a powerful technical analysis tool designed to measure the strength
Provided Trend is a complex signal formation indicator. As a result of the work of internal algorithms, you can see only three types of signals on your chart. The first is a buy signal, the second is a sell signal, and the third is a market exit signal. Options: CalcFlatSlow - The first parameter that controls the main function of splitting the price chart into waves. CalcFlatFast - The second parameter that controls the main function of splitting the price chart into waves. CalcFlatAvg - Par
Il nostro indicatore   Basic Support and Resistance   è la soluzione necessaria per aumentare l'analisi tecnica.Questo indicatore consente di proiettare i livelli di supporto e resistenza sul grafico/ MT4 gratuita Funzionalità Integrazione dei livelli di Fibonacci: Con la possibilità di visualizzare i livelli di Fibonacci insieme a livelli di supporto e resistenza, il nostro indicatore ti dà una visione ancora più profonda del comportamento del mercato e delle possibili aree di inversione.
Innanzitutto, vale la pena sottolineare che questo Strumento di Trading è un Indicatore Non-Ridipingente, Non-Ridisegnante e Non-Laggante, il che lo rende ideale per il trading professionale. Corso online, manuale utente e demo. L'Indicatore Smart Price Action Concepts è uno strumento molto potente sia per i nuovi che per i trader esperti. Racchiude più di 20 utili indicatori in uno solo, combinando idee di trading avanzate come l'Analisi del Trader del Circolo Interno e le Strategie di Trad
PipFinite Breakout EDGE MT5
Karlo Wilson Vendiola
4.81 (94)
The Missing Edge You Need To Catch Breakouts Like A Pro. Follow a step-by-step system that detects the most powerful breakouts! Discover market patterns that generate massive rewards based on a proven and tested strategy. Unlock Your Serious Edge Important information here www.mql5.com/en/blogs/post/723208 The Reliable Expert Advisor Version Automate Breakout EDGE signals using "EA Breakout EDGE" Click Here Have access to the game changing strategy that will take your trading to the n
Questo indicatore ti mostrerà i valori TP e SL (in quella valuta) che hai già impostato per ogni ordine sui grafici (chiuso alla riga della transazione/ordine) che ti aiuteranno molto a stimare il tuo profitto e la tua perdita per ogni ordine. E ti mostra anche i valori PIP. il formato mostrato è "Valori valutari dei nostri profitti o perdite / valori PIP". Il valore TP sarà mostrato in colore verde e il valore SL sarà mostrato in colore rosso. Per qualsiasi domanda o ulteriori informazioni,
Your Trend Friend
Luigi Nunes Labigalini
5 (1)
The trend is your friend! Look at the color of the indicator and trade on that direction. It does not  repaint. After each candle is closed, that's the color of the trend. You can focus on shorter faster trends or major trends, just test what's most suitable for the symbol and timeframe you trade. Simply change the "Length" parameter and the indicator will automatically adapt. You can also change the color, thickness and style of the lines. Download and give it a try! There are big movements
Introducing "X Marks the Spot" – Your Ultimate MetaTrader 5 Indicator for Perfect Trades! Are you tired of the guesswork in trading? Ready to take your MetaTrader 5 experience to a whole new level? Look no further – "X Marks the Spot" is here to revolutionize your trading strategy! What is "X Marks the Spot"? "X Marks the Spot" is not just another indicator – it's your personal trading compass that works seamlessly on all timeframes . Whether you're a beginner or an experienced trader,
This indicator uses a mathematical calculation algorithm . This algorithm calculates the remainder between the updated model and the actual values and produces the possible progress of the graph on the graph. It is not a super prophet in trading, but it is very good for the trader when entering the market and to analyze it before entering. Applicable for all currencies. Данный индикатор использует алгоритм математических вычислений . Данный алгоритм вычисляет остаток между обновленной моделью и
Somewhere over the rainbow It is a system that tries to operate the market from the exhaustion of the trend with a correction algorithm that tries to cut losses at the cost of increasing the margin This system makes all the adjustments automatically, analyzing the pair and the market to decide which is the most efficient step to reach your destination. Somewhere over the rainbow is a multiple trade and multi lot system(The maximum batch can be up to 5 times the initial batch distributed in mul
Orbit Rage Final 2
BILLY ARANDUQUE ABCEDE
Note : i only sell this EA on MQL5, any other sellers is fake. Orbit Rage Final, a cutting-edge trading strategy meticulously designed around the bull/bear candle approach and divergence analysis. This powerful tool is engineered to empower you to shape the life you desire. To embark on this transformative journey, simply download and seamlessly integrate it into your MetaTrader 4 platform by placing it in the experts advisors folder. Orbit Rage Final revolutionizes trading by offering a risk-f
HiLo Activator Plus
Rodrigo Galeote
5 (1)
HiLo Activator is one of the most used indicators to determine trend. Find it here with the ability to customize period and colors. This indicator also plots up and down arrows when there is a change on the trend, indicating very strong entry and exit points. HiLo fits well to different types of periods for day trading. You can easily understand when it is time to buy or sell. It works pretty good also for other periods like daily and monthly signalizing long-term trends. The use of the indicato
PipFinite Exit EDGE MT5
Karlo Wilson Vendiola
4.86 (29)
Did You Have A Profitable Trade But Suddenly Reversed? In a solid strategy, exiting a trade is equally important as entering. Exit EDGE helps maximize your current trade profit and avoid turning winning trades to losers. Never Miss An Exit Signal Again Monitor all pairs and timeframes in just 1 chart www.mql5.com/en/blogs/post/726558 How To Trade You can close your open trades as soon as you receive a signal Close your Buy orders if you receive an Exit Buy Signal. Close your Sell orde
Innanzitutto, è importante sottolineare che questo sistema di trading è un indicatore non repainting, non redrawing e non lagging, il che lo rende ideale per il trading professionale. Corso online, manuale utente e demo. Il "Sistema di Trading di Supporto e Resistenza Intelligente" è un indicatore avanzato progettato per trader nuovi ed esperti. Permette ai trader di ottenere precisione e fiducia sul mercato forex. Questo sistema completo combina più di 7 strategie, 10 indicatori e varie approc
The Penta-O is a 6-point retracement harmonacci pattern which usually precedes big market movements. Penta-O patterns can expand and repaint quite a bit. To make things easier this indicator implements a twist: it waits for a donchian breakout in the right direction before signaling the trade. The end result is an otherwise repainting indicator with a very reliable trading signal. The donchian breakout period is entered as an input. [ Installation Guide | Update Guide | Troubleshooting | FAQ | A
The SafeProfit Market Profile is the most advanced tracking indicator in the Forex Market. It was developed to track the market profile of each session of the day: Asian, European and American. With this indicator you will operate Intraday smiling ... knowing exactly where the Big Players are positioned and the exact moment where they are going to. The indicator is simple, fast and objective, tracking every movement of the Big Players in price. Get out of the 95% statistic that only loses and us
Bullet indicator x
Dorah Zandile Mahesu
The bullet indicator gives accurate direction of the market structure, it will indicate to you the exact direction whether it be the market is in a downtrend or if it's in an uptrend it will give you that information which will inturn benefits you by saving you the time it takes to analyse that structure, this indicator works on a timeframes and it's most favourable on higher timeframes. How it works: -The green arrow will be at the support of the structure indicating buys -The red arrow will
Cet indicateur innovant de mesure de la force des devises de INFINITY est une aide indispensable pour les scalpers et les commerçants qui négocient à long terme. Le système d'analyse De la force/faiblesse des devises est connu depuis longtemps et utilisé sur le marché par les principaux traders du monde. Tout commerce d'arbitrage n'est pas complet sans cette analyse. Notre indicateur détermine facilement la force des devises sous-jacentes les unes par rapport aux autres. Il affiche des graphiqu
"2nd To NoneFX Scalper" is one powerful indicator which you can use on any timeframe. The accuracy is in between 90% - 95% can be more. The indicator is 100% non repaint so it doesn't repaint at all. When the arrow comes out wait for the candlestick to close the arrow won't repaint/recalculate or move. The indicator works with all volatility indices,step index, Boom & Crash(500 & 1000) and all currency pairs. You can change settings of the indicator. For great results find the trend of the pair,
Golden Limit
Renato Fridschtein
There are no limits! Golden Limit is the ultimate indicator to get clear and easy readings of price movements on charts. It projects support and resistance ranges, calculated by statistical models involving Price Action and the Fibonacci sequence, revealing in advance the behavior of prices and the best places to trade and not to trade. It also has two moving averages to help choose the best entries. The Golden Limit method was created from a proven model. In summary: We use the names of preci
Gli utenti di questo prodotto hanno anche acquistato
TPSpro RFI Levels MT5
Roman Podpora
4.73 (11)
ISTRUZIONI       RUS   -   INGLESE       Si   consiglia di utilizzare con un indicatore       -       TPSpro   TENDENZA PRO -   Versione MT4         Un elemento chiave nel trading sono le zone o i livelli da cui vengono prese le decisioni di acquisto o vendita di uno strumento di trading. Nonostante i tentativi dei principali attori di nascondere la loro presenza sul mercato, lasciano inevitabilmente delle tracce. Il nostro compito era imparare a identificare queste tracce e interpretarle corre
Innanzitutto è importante sottolineare che questo sistema di trading è un indicatore Non-Repainting, Non-Redrawing e Non-Lagging, il che lo rende ideale sia per il trading manuale che per quello automatico. Corso online, manuale e download di preset. Il "Sistema di Trading Smart Trend MT5" è una soluzione completa pensata sia per i trader principianti che per quelli esperti. Combina oltre 10 indicatori premium e offre più di 7 robuste strategie di trading, rendendolo una scelta versatile per div
AT Forex Indicator MT5
Marzena Maria Szmit
5 (4)
The AT Forex Indicator MT5 is a sophisticated trading tool designed to provide traders with a comprehensive analysis of multiple currency pairs. This powerful indicator simplifies the complex nature of the forex market, making it accessible for both novice and experienced traders. AT Forex Indicator uses advanced algorithms to detect trends, patterns and is an essential tool for traders aiming to enhance their forex trading performance. With its robust features, ease of use, and reliable signal
TrendMaestro5
Stefano Frisetti
nota: questo indicatore e' per METATRADER5, se vuoi la versione per  METATRADER4 questo e' il link:   https://www.mql5.com/it/market/product/108106 TRENDMAESTRO ver 2.4 TRENDMAESTRO   riconosce un nuovo TREND sul nascere, non sbaglia mai. La sicurezza di identificare un nuovo TREND non ha prezzo. DESCRIZIONE TRENDMAESTRO identifica un nuovo TREND sul nascere, questo indicatore prende in esame la volatilita' i volumi ed il momentum per identificare il momento in cui c'e' un'esplosione di uno
FxaccurateLS
Shiv Raj Kumawat
WHY IS OUR FXACCCURATE LS MT5 THE PROFITABLE ? PROTECT YOUR CAPITAL WITH RISK MANAGEMENT Gives entry, stop and target levels from time to time. It finds Trading opportunities by analyzing what the price is doing during established trends. POWERFUL INDICATOR FOR A RELIABLE STRATEGIES We have made these indicators with a lot of years of hard work. It is made at a very advanced level. Established trends provide dozens of trading opportunities, but most trend indicators completely ignore them!
TPA True Price Action indicator reveals the true price action of the market makers through 100% non-repainting signals strictly at the close of a candle! TPA shows entries and re-entries, every time the bulls are definitely stronger than the bears and vice versa. Not to confuse with red/green candles. The shift of power gets confirmed at the earliest stage and is ONE exit strategy of several. There are available now two free parts of the TPA User Guide for our customers. The first "The Basics"
XQ Indicator MetaTrader 5
Marzena Maria Szmit
3 (2)
Step into the realm of Forex trading with confidence and precision using XQ, a cutting-edge Forex indicator designed to elevate your trading game to unprecedented heights. Whether you're a seasoned trader or just stepping into the world of currency exchange, XQ Forex Indicator empowers you with the insights and signals needed to make informed trading decisions. The signal conditions are a combination of three indicators, and XQ Forex Indicator only display  medium and long-term trends . The ind
MetaForecast M5
Vahidreza Heidar Gholami
5 (2)
MetaForecast predice e visualizza il futuro di qualsiasi mercato basandosi sull'armonia dei dati dei prezzi. Sebbene il mercato non sia sempre prevedibile, se esiste un modello nei prezzi, MetaForecast può prevedere il futuro con la massima precisione possibile. Rispetto ad altri prodotti simili, MetaForecast può generare risultati più accurati analizzando le tendenze di mercato. Parametri di input Past size (Dimensione passata) Specifica il numero di barre che MetaForecast utilizza per creare
Boom and Crash Trend Detector is a  Non-Repaint   MT5 trading system usually being sold for 50 0$ . Most people use this for Deriv but can be used to forex too. The boom and crash spike indicator is a spike detecting software, with Multiple features, these features include. Spike Alert ( from 10 to 100-second warning before spike) Continues spike Alert (for double or continuous spikes at a time) supports all Boom/crash Indices M6 time frame works best here . Bigger time frame trend pointer f
Ora $ 147 (aumentando a $ 499 dopo alcuni aggiornamenti) - account illimitati (PC o MAC) Manuale utente di RelicusRoad + Video di formazione + Accesso al gruppo Discord privato + Stato VIP UN NUOVO MODO DI GUARDARE IL MERCATO RelicusRoad è l'indicatore di trading più potente al mondo per forex, futures, criptovalute, azioni e indici, fornendo ai trader tutte le informazioni e gli strumenti di cui hanno bisogno per rimanere redditizi. Forniamo analisi tecniche e piani di trading per aiutar
QUESTO INDICATORE, BASATO SULL'INTELLIGENZA ARTIFICIALE, individua i possibili punti di inversione del mercato attraverso la lettura del footprint, e segnala IN ANTICIPO dei piccoli movimenti del mercato prima che questi avvengano. A differenza degli indicatori di prezzo e di volume, che generano gli ingressi "in ritardo" ovvero quando è già avvenuta una conferma nel prezzo o del volume su un cambio di direzione, e quindi spesso il movimento si è già esaurito, questo indicatore segnala, in base
Trade smarter, not harder: Empower your trading with Harmonacci Patterns Special Offer: Purchase now to receive free bonuses worth $165! (Read more for details) This is arguably the most complete harmonic price formation auto-recognition indicator you can find for the MetaTrader Platform. It detects 19 different patterns, takes fibonacci projections as seriously as you do, displays the Potential Reversal Zone (PRZ) and finds suitable stop-loss and take-profit levels. [ Installation Guide | Up
IVISTscalp5
Vadym Zhukovskyi
5 (5)
What's new about iVISTscalp5 forecast indicator (Version 10)? iVISTscalp5 is a unique nonlinear forecasting for a week ahead system for any financial instrument which executes fast scalping using time levels. iVISTscalp5 is a tool for easy study and understanding of financial market. 1) iVISTscalp5 forecast indicator has been completely rewritten into another programming language (C++), which has accelerated data loading and processing. As a result, a different graphical display of forecast
Bill Williams Advanced
Siarhei Vashchylka
5 (8)
Bill Williams Advanced is designed for automatic chart analysis using Bill Williams' "Profitunity" system. The indicator analyzes four timeframes at once. Manual (Be sure to read before purchasing) Advantages 1. Automatically analyzes the chart using the "Profitunity" system of Bill Williams. The found signals are placed in a table in the corner of the screen. 2. Equipped with a trend filter based on the Alligator indicator. Most of the system signals are recommended to be used only accordi
Elliot Waves Analyzer Pro
Viktor Weidenthal
2.67 (3)
Elliot Waves Analyzer Pro calculates Elliot Waves to Help Identify Trend direction and Entry Levels. Mainly for Swing Trading Strategies. Usually one would open a Position in trend direction for Wave 3 or a Correction for Wave C . This Indicator draws Target Levels for the current and next wave. Most important Rules for Elliot Wave Analysis are verified by the Indicator.  The Pro version analyzes Multiple Timeframes and shows the Subwaves and Target-Levels.   For an Overview  " Elliot Waves Anal
Go Way TREND
Ywsf Hsyn Hmad Alrsh
Segui la tendenza. Sì, attendi il segnale di ingresso, sia di acquisto che di vendita, su un frame di 15 minuti e controlla il segnale se appare su un frame di 30 minuti (a volte ci vuole un'ora o più prima che il segnale appaia. Puoi tornare al frame di 15 minuti e torna al frame di 30 minuti, e ripeti l'operazione finché non appare il segnale principale. Se il segnale appare sul frame di 30 minuti, entra con il prezzo e il profitto viene preso quando la linea di disegno cambia , viene registr
Introduction to Fractal Pattern Scanner Fractal Indicator refers to the technical indicator that makes use of the fractal geometry found in the financial market. Fractal Pattern Scanner is the advanced Fractal Indicator that brings the latest trading technology after the extensive research and development work in the fractal geometry in the financial market. The most important feature in Fractal Pattern Scanner is the ability to measure the turning point probability as well as the trend probabil
Currently, the product's selling price is over $480; however, we are offering a monthly rental system for only $30. This allows many people to enjoy and experience our products during this launch stage, which will likely lead to positive reviews from users, making it more enjoyable | We hope that if there are more than 10 positive reviews, the GOOD NEWS is that the next use will last for 3 months at a fixed price of only $30 | Take advantage of our promo opportunity, before it goes back to sell
Volatility Trend System - è un sistema di trading che fornisce segnali per le entrate. Il sistema di volatilità fornisce segnali lineari e puntuali nella direzione del trend, nonché segnali per uscirne, senza ridisegnare o ritardi. L'indicatore di tendenza monitora la direzione del trend a medio termine, mostra la direzione e il suo cambiamento. L'indicatore del segnale si basa sui cambiamenti della volatilità e mostra gli ingressi nel mercato. L'indicatore è dotato di diversi tipi di avvi
Introduction to X3 Chart Pattern Scanner X3 Cherart Pattern Scanner is the non-repainting and non-lagging indicator detecting X3 chart patterns including Harmonic pattern, Elliott Wave pattern, X3 patterns, and Japanese Candlestick patterns. Historical patterns match with signal patterns. Hence, you can readily develop the solid trading strategy in your chart. More importantly, this superb pattern scanner can detect the optimal pattern of its kind. In addition, you can switch on and off individu
Native Channels
BeeXXI Corporation
5 (1)
This indicator recognizes all support and resistance levels. A number of unique high-performance techniques have been applied, which made the existence of this indicator possible. All formed channels are naturally visible: horizontal linear linear parabolic cubic (Polynomial 3 degrees - Wave) This is due to a bundle of approximating channels. The formed channels form "standing waves" in a hierarchical sequence. Thus, all support and resistance levels are visible. All parameter management is
Piranha version 2
Maria Strudov
5 (1)
"Piranha" - an autonomous trading system that determines overbought and oversold levels on the chart. Red and blue zones represent overbought and oversold levels respectively. Entry points are marked with arrows: a downward arrow in the red zone for "sell" and an upward arrow in the blue zone for "buy". The Take profit level is indicated by the green moving average. Key features: Adjusting the Take profit level as the green moving average changes position. Averaging ability when a new market e
The iChannels
BeeXXI Corporation
5 (2)
Ultra-fast recognition of parabolic channels (as well as linear, horizontal and wavy channels) throughout the depth of history, creating a hierarchy of channels. Required setting: Max bars in chart: Unlimited This indicator is designed primarily for algorithmic trading, but can also be used for manual trading.  This indicator will have a very active evolution in the near future and detailed descriptions on how to apply to create robots
Introducing the Power Trade Plus indicator designed by a small group of traders with a few years of experience trading the market profitably.  The Power Trade Plus is derived from the Power Trade indicator,  the indicator strive in powerful sniper entries and take profit levels,  with an algorithm that's can determine the markets volatility and Provides entries based on the current market volatility. This indicator is much more effective in stock ,currencies and indices.
Introducing the South African Sniper indicator created by a small group of traders with a few years trading trading the financial market profitably . This is a plug and play indicator that provides you with  BUY and SELL (SNIPER ENTRY) signals with TARGET and trail stops. The indicator Works with all MT5 trading instruments. The indicator uses previous  chart data as receipt to speculate on future market moves.  "The South African Sniper indicator community are very happy with the indicator an
SMCpro
Arief
5 (1)
Currently Price  20% OFF  ( for unlimited use ) Indicator   USER MANUAL , trade setups, solving issues, etc :  Direct Download Here     (  for users only  ) Hello World! Introducing.. SMCpro tool and Indicator for  MetaTrader 5 , a cutting-edge feature designed to revolutionize your trading experience. With innovative ICT Smart Money Concept, you gain unparalleled insight into market dynamics, empowering you to make informed trading decisions like never before. SMC Indicator built on th
Golden Gate Algo MT5
James David Lane
4 (6)
40% DI SCONTO PER NATALE! AUMENTO DEL PREZZO A $250 IL 1 GENNAIO! Presentiamo GoldenGate Entries: una soluzione di trading all'avanguardia! Scopri un approccio rivoluzionario al trading con GoldenGate Entries (GGE), un indicatore avanzato progettato per migliorare la tua esperienza di trading. GGE offre un set completo di funzionalità per fornire agli utenti precisione e fiducia nelle loro decisioni di trading. Coppie: Qualsiasi (FX - Materie prime - Azioni - Azioni - Cripto) TimeFrame
Elliott Wave Trend was designed for the scientific wave counting. This tool focuses to get rid of the vagueness of the classic Elliott Wave Counting using the guideline from the template and pattern approach. In doing so, firstly Elliott Wave Trend offers the template for your wave counting. Secondly, it offers Wave Structural Score to assist to identify accurate wave formation. It offers both impulse wave Structural Score and corrective wave Structure Score. Structural Score is the rating to sh
L'Oscillatore dell'Indice di Precisione (Pi-Osc) di Roger Medcalf di Precision Trading Systems La Versione 2 è stata attentamente rielaborata per essere estremamente veloce nel caricarsi sul tuo grafico e sono state apportate alcune altre migliorie tecniche per migliorare l'esperienza. Il Pi-Osc è stato creato per fornire segnali di sincronizzazione del trading accurati progettati per individuare punti di esaurimento estremi, i punti ai quali i mercati vengono costretti a recarsi solo per e
Matreshka
Dimitr Trifonov
5 (1)
Matreshka self-testing and self-optimizing indicator: 1. Is an interpretation of the Elliott Wave Analysis Theory. 2. Based on the principle of the indicator type ZigZag, and the waves are based on the principle of interpretation of the theory of DeMark. 3. Filters waves in length and height. 4. Draws up to six levels of ZigZag at the same time, tracking waves of different orders. 5. Marks Pulsed and Recoil Waves. 6. Draws arrows to open positions 7. Draws three channels. 8. Notes support and re
Altri dall’autore
SwingVolumePro
Thalles Nascimento De Carvalho
Panoramica SwingVolumePro è un indicatore avanzato e versatile, progettato per essere utilizzato su una vasta gamma di strumenti finanziari e per supportare diversi stili di trading. Basato su un'analisi rigorosa di volume e prezzo, fornisce segnali chiari e precisi che consentono ai trader di tutti i livelli di prendere decisioni informate basate su dati di alta qualità. SwingVolumePro.PDF Caratteristiche principali Versatilità: SwingVolumePro può essere applicato a vari asset, t
AI Channel
Thalles Nascimento De Carvalho
4 (4)
Welcome to the presentation of the AI Channel indicator, a powerful tool that uses artificial intelligence for price channel analysis in the financial market. In this session, we will explore how this revolutionary indicator can assist investors and traders in making more informed and strategic decisions. Let's get started! I. What is the AI Channel indicator? AI Channel is an indicator developed based on advanced artificial intelligence algorithms. It utilizes historical price data of financial
FREE
Cumulative Volume Bands
Thalles Nascimento De Carvalho
CVB Cumulative Volume Bands: Potenzia le tue operazioni con il volume accumulato! CVB Cumulative Volume Bands è un indicatore avanzato progettato per i trader che cercano segnali precisi basati sul volume accumulato. Utilizzando bande di volume accumulato, questo indicatore offre letture chiare delle pressioni di acquisto e vendita nel mercato, aiutando a identificare inversioni e forti movimenti dei prezzi. Cumulative Volume Bands for MT5 ! Caratteristiche principali: Analis
FREE
Box Weis Wave
Thalles Nascimento De Carvalho
5 (1)
Eleva la tua analisi con Weis Wave Box! Se stai cercando precisione e chiarezza nel tuo trading, Weis Wave Box è lo strumento che fa per te. Questo indicatore avanzato offre un'analisi visiva dettagliata delle onde di volume e dei punti di swing, aiutandoti a comprendere meglio la relazione tra sforzo e risultati nel mercato. Caratteristiche principali di Weis Wave Box: Onde di Volume Personalizzabili: Regola le onde di volume in tick per adattarle alle tue strategie di trading. Stori
Swing Point Volume
Thalles Nascimento De Carvalho
Swing Point Volume, the indicator that signals weakness and strength at the tops and bottoms. This indicador can be for used the Wyckoff Method. Information provided; - Swing on customized ticks. - Volume and points in each balance sheet. - Percentage of Displacement. - Sound alert option on top and bottom breaks. - Volume in ticks and Real Volume. - Volume HL (extreme) or (opening and closing) - Customized volume shapes.
Atr Projection
Thalles Nascimento De Carvalho
L'indicateur ATR Projeção se distingue comme un outil robuste dans l'analyse technique, conçu pour fournir des informations précises sur les limites potentielles des mouvements de prix sur les marchés financiers. Son approche flexible permet aux utilisateurs de personnaliser de manière intuitive les métriques d'analyse, en s'adaptant aux besoins spécifiques de chaque actif négocié. Fonctionnement personnalisable : Par défaut, l'ATR Projeção fonctionne en considérant 30 % de la moyenne des
Long Short Pro
Thalles Nascimento De Carvalho
Indicatore Long & Short - Versione Pro: Sblocca il Potenziale Illimitato della Tua Analisi di Mercato! Nessuna Limitazione per Qualsiasi Attivo La versione Pro dell’indicatore Long & Short ti offre la libertà totale di utilizzarlo su qualsiasi strumento finanziario. Niente più limitazioni – applica lo stesso indicatore a tutti i tuoi attivi preferiti! Senza Limitazioni Approfitta di tutte le funzionalità dell’indicatore senza alcuna restrizione. La versione Pro offre un’esperienza
Didi Index Volume
Thalles Nascimento De Carvalho
Presentiamo il Didi Index Volume, un indicatore di analisi tecnica sviluppato dal trader brasiliano Odir Aguiar, che si distingue per il suo approccio avanzato e potente nell'individuazione delle opportunità nei mercati finanziari. Disponibile su diverse piattaforme, il Didi Index Volume è diventato uno strumento essenziale per i trader che cercano informazioni precise e preziose per le loro strategie di trading. L'indicatore combina il rinomato Didi Index, creato da Odir Aguiar, con l'intell
Smart Binary Volume
Thalles Nascimento De Carvalho
L'indicatore Smart Binary Volume è uno strumento versatile che combina l'analisi del volume di trading con l'apprendimento automatico (machine learning). Può essere applicato su diversi mercati e strategie, inclusi lo scalping e altre tipologie di trading a breve termine. Utilizzando algoritmi avanzati di machine learning, l'indicatore identifica pattern complessi, generando segnali di acquisto e vendita più precisi. Buffer to Create EA. Buffer Line Gold = 0. Buffer Line Red = 2 Buffer   AI 
TimeChannel
Thalles Nascimento De Carvalho
The "Timechannel" is a powerful technical analysis tool designed specifically for traders who want to gain deeper and more accurate insights into price movements across multiple timeframes (multi-timeframe). This indicator is an essential addition to the toolbox of any serious trader seeking to make informed and data-driven trading decisions. Key Features: Advanced Multi-Timeframe Analysis : Timechannel allows traders to analyze price movements on different timeframes simultaneously. This is cr
Big Player Range
Thalles Nascimento De Carvalho
5 (2)
Scopri la Potenza di "BigPlayerRange": Il Tuo Alleato nell'Analisi Tecnica del Mercato Presentiamo BigPlayerRange , uno strumento avanzato di analisi tecnica progettato per rivelare le aree di interesse degli investitori istituzionali sul mercato. Con questo strumento, potrai identificare con precisione dove i principali attori sono attivamente coinvolti e comprendere come ciò possa influenzare le tue strategie di trading. Caratteristiche Principali: Mappatura delle Aree di Interesse Istitu
Master OBV
Thalles Nascimento De Carvalho
MasterOBV: Domina le Tendenze di Mercato con Precisione! MasterOBV è un indicatore di analisi tecnica che combina volume , correlazione positiva e una Media Mobile (MA) per affinare l'identificazione delle tendenze sui mercati finanziari. Funzionalità Principali: Volume Intelligente: Analizza il volume delle transazioni per identificare cambiamenti significativi nella forza della tendenza. Correlazione Positiva: Include asset correlati per ottenere una visione più ampia e precisa, ra
Smart Delta Volume
Thalles Nascimento De Carvalho
Smart Delta Volume: Preciso e Adattabile alle Condizioni Dinamiche del Mercato Smart Delta Volume è un indicatore tecnico avanzato progettato per offrire un'analisi precisa e adattabile in un ambiente di mercato in continua evoluzione. Utilizzando livelli dinamici che si regolano automaticamente in base alla volatilità, questo indicatore fornisce una visione più completa e affidabile dell'interazione tra flusso di volume e azione dei prezzi. Questa capacità di adattamento è cruciale per i tra
VolaMetrics VSA
Thalles Nascimento De Carvalho
VolaMetrics VSA | Un Potente Alleato nell'Analisi Tecnica Il VolaMetrics VSA è un indicatore di analisi tecnica che combina il metodo Volume Spread Analysis (VSA) con un'analisi dettagliata del volume delle transazioni . Progettato per identificare e tracciare i movimenti significativi dei prezzi , il VolaMetrics VSA utilizza l'interazione tra volume e spread dei prezzi per fornire intuizioni preziose che possono aiutare nelle decisioni di trading. Fondamenti della Volume Spread Analysis (VSA
CVD SmoothFlow Pro
Thalles Nascimento De Carvalho
CVD SmoothFlow Pro - Analisi del Volume Illimitata per Qualsiasi Attivo! CVD SmoothFlow Pro è la soluzione definitiva per i trader che cercano un'analisi del volume precisa e illimitata. Utilizzando il calcolo del Cumulative Volume Delta (CVD) con filtraggio avanzato del rumore, la versione Pro offre la flessibilità e la precisione necessarie per operare su qualsiasi strumento finanziario. Cosa offre CVD SmoothFlow Pro? Analisi Chiara : Filtra il rumore di mercato e mette in risalto i movi
VolumeSecret
Thalles Nascimento De Carvalho
VolumeSecret: Il Potere del Volume nelle Tue Mani Nel mondo sfidante della programmazione, affrontiamo costantemente ostacoli che ci spingono a crescere e ad evolverci. Comprendiamo profondamente le difficoltà imposte dal mercato e come i trader lottano per raggiungere le migliori performance. Per questo motivo, lavoriamo instancabilmente su soluzioni innovative per rendere la presa di decisioni sul mercato più fluida e precisa. VolumeSecret è il risultato di questo impegno. Si tratta di un indi
Cumulative Vol Bands
Thalles Nascimento De Carvalho
CVB Cumulative Volume Bands: Potenzia le tue operazioni con il volume accumulato! CVB Cumulative Volume Bands è un indicatore avanzato progettato per i trader che cercano segnali precisi basati sul volume accumulato. Utilizzando bande di volume accumulato, questo indicatore offre letture chiare delle pressioni di acquisto e vendita nel mercato, aiutando a identificare inversioni e forti movimenti dei prezzi. Caratteristiche principali: Analisi del Volume Accumulato : Rileva i punt
ZigWave Oscillator
Thalles Nascimento De Carvalho
ZigWave Oscillator: Potenzia le tue operazioni con oscillatori e ZigZag! Il ZigWave Oscillator è lo strumento perfetto per i trader che cercano precisione e chiarezza nell'analisi del mercato finanziario. Questo indicatore combina la forza degli oscillatori con la semplicità visiva dello ZigZag, aiutandoti a identificare le migliori opportunità di acquisto e vendita con rapidità ed efficienza. Perché scegliere il ZigWave Oscillator? Analisi precisa degli oscillatori : Integra RSI, Will
Filtro:
Nessuna recensione
Rispondi alla recensione
Versione 1.1 2024.09.30
otimização na coleta dos dados.