• Panoramica
  • Recensioni (2)
  • Commenti (2)
  • Novità

Liquidity Breaks and Swings

5

Consulta "Novità" per una descrizione delle funzioni più recenti. La versione 1.4 è stata solo una pulizia, niente di speciale.

//+---------------------------------------------------------------------------------------------------------------+

Ho creato questo perché avevo bisogno di un indicatore frattale personalizzabile. Verifica anche la diminuzione dei volumi per avere una sorta di conferma. Ecco la descrizione:

Panoramica

Questo indicatore è progettato per aiutare a identificare i punti chiave di swing nel mercato analizzando l'azione dei prezzi e la dinamica dei volumi.

Caratteristiche

Il nucleo della strategia dell'indicatore si basa sull'identificazione di modelli di alti e bassi che spesso precedono significativi movimenti di prezzo. Questi modelli vengono determinati scansionando il grafico alla ricerca di candele con:

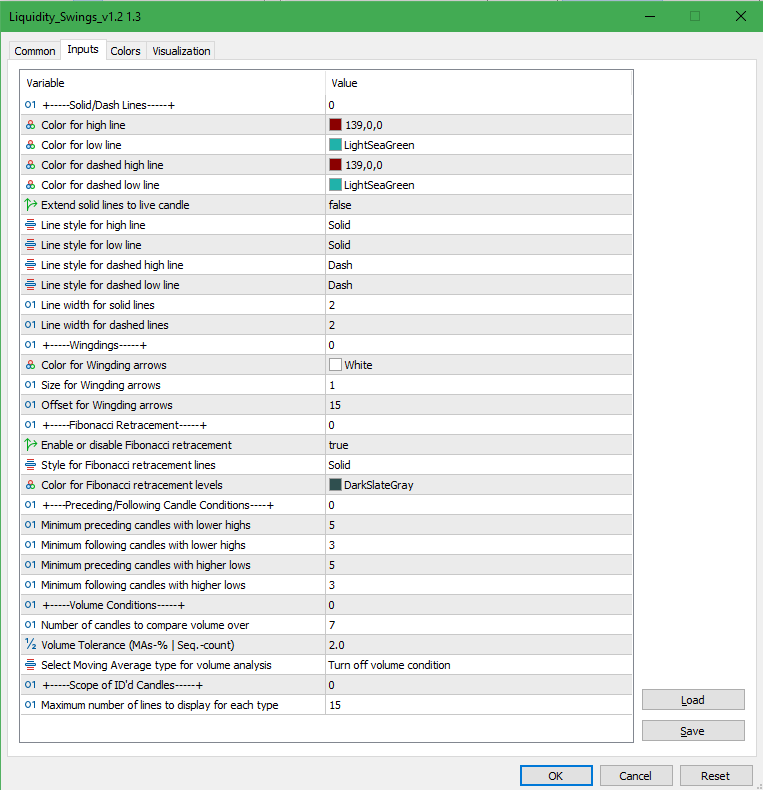
Modelli di Candele Ribassiste: Identificati quando il massimo di una candela è superiore a un numero [Regolabile dall'Utente] di candele precedenti (Predefinito 5) e successive (Predefinito 3). Viene marcata solo se la candela ha anche un numero [Regolabile dall'Utente] di barre di volume decrescenti che la precedono.

Modelli di Candele Rialziste: Identificati quando il minimo di una candela è inferiore a un numero [Regolabile dall'Utente] di candele precedenti (Predefinito 5) e successive (Predefinito 3). Viene marcata solo se la candela ha anche un numero [Regolabile dall'Utente] di barre di volume decrescenti che la precedono.

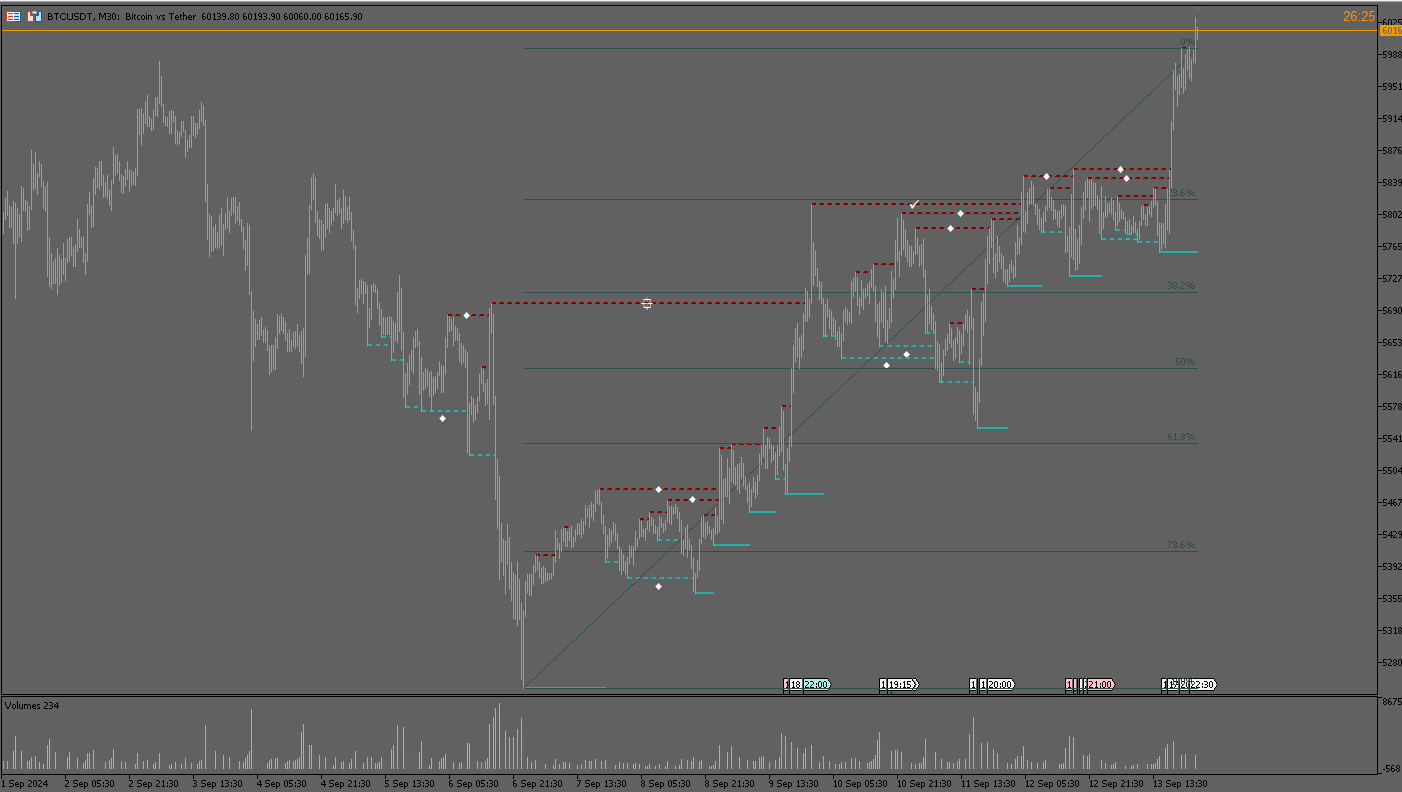
Disegno della Linea di Rottura

Una volta identificata una candela, l'indicatore disegna una linea sul massimo o sul minimo della candela. Se una candela successiva rompe al di sopra di una candela con massimo o al di sotto di una candela con minimo, la linea viene quindi convertita in una linea tratteggiata, che si estende fino al punto della rottura.

Il numero di tutte le candele identificate può essere inserito nella sezione proprietà, così come un'opzione per estendere i livelli non rotti fino alla candela attuale.

Classificazione dei Livelli di Rottura

Ogni linea tratteggiata viene assegnata a un grado in base al numero di candele tra il modello identificato e la rottura:

  • "Grande Swing": Si estende per 150 o più candele. 
  • "Non Male Swing": Si estende per 110-139 candele. 
  • "OK Swing": Si estende per 70-109 candele. 
  • "Swing Medio": Si estende per 30-69 candele. 
  • "Swing Non Marcato": Si estende per meno di 30 candele.

Ritracciamento di Fibonacci (opzionale)

L'indicatore include anche una funzione di ritracciamento automatico di Fibonacci che viene disegnata dinamicamente in base ai punti di swing identificati:

In un trend rialzista, il ritracciamento di Fibonacci viene disegnato dal minimo della candela più bassa identificata al massimo della candela più alta identificata. In un trend ribassista, il ritracciamento viene disegnato dal massimo della candela più alta identificata al minimo della candela più bassa identificata. L'identificazione di un trend rialzista o ribassista in questo caso si basa sulla vicinanza della candela più alta o più bassa alla candela attuale, cioè: Se la candela più alta identificata è più vicina alla nostra candela attuale, il codice la valuterà come un trend rialzista e viceversa.

Si consiglia di disattivare la griglia per utilizzare questo indicatore.


Recensioni 2
Jaydeep Jaganbhai Patel
322
Jaydeep Jaganbhai Patel 2024.10.18 05:13 
 

good indicator.

Prodotti consigliati
Il Catturatore di Tendenza: La Strategia del Catturatore di Tendenza con Indicatore di Allarme è uno strumento versatile di analisi tecnica che aiuta i trader a identificare le tendenze di mercato e i potenziali punti di ingresso e uscita. Presenta una Strategia dinamica del Catturatore di Tendenza, adattandosi alle condizioni di mercato per una chiara rappresentazione visiva della direzione della tendenza. I trader possono personalizzare i parametri in base alle loro preferenze e tolleranza
FREE
I Blocchi d'Ordini di Offerta e Domanda: L'indicatore "Blocchi d'Ordini di Offerta e Domanda" è uno strumento sofisticato basato sui concetti di Smart Money, fondamentale per l'analisi tecnica nel mercato del Forex. Si concentra sull'identificazione delle zone di offerta e domanda, aree cruciali in cui i trader istituzionali lasciano tracce significative. La zona di offerta, che indica gli ordini di vendita, e la zona di domanda, che indica gli ordini di acquisto, aiutano i trader a anticipar
FREE
Tops and Bottoms Indicator
Josue De Matos Silva
4.67 (6)
Tops & Bottoms Indicator FREE   Tops abd Bottoms:   An effective indicator for your trades The tops and bottoms indicator helps you to find  ascending and descending channel formations with indications of ascending and/or descending tops and bottoms. In addition, it  show possibles  opportunities with a small yellow circle when the indicator encounters an impulse formation. This indicator provide to you  more security and speed in making entry decisions. Also test our FREE advisor indicator:
FREE
Best SAR MT5
Ashkan Hazegh Nikrou
5 (2)
Descrizione:  siamo felici di presentare il nostro nuovo indicatore gratuito basato su uno degli indicatori professionali e popolari nel mercato forex (PSAR) questo indicatore è una nuova modifica sull'indicatore SAR parabolico originale, nell'indicatore pro SAR puoi vedere l'incrocio tra i punti e il grafico dei prezzi, questo il crossover non è un segnale ma parla del potenziale di fine movimento, puoi iniziare a comprare con un nuovo punto blu e posizionare lo stop loss un atr prima del pr
FREE
Follow The Line MT5
Oliver Gideon Amofa Appiah
4.52 (29)
This indicator obeys the popular maxim that: "THE TREND IS YOUR FRIEND" It paints a GREEN line for BUY and also paints a RED line for SELL. (you can change the colors). It gives alarms and alerts of all kinds. IT DOES NOT REPAINT and can be used for all currency pairs and timeframes. Yes, as easy and simple as that. Even a newbie can use it to make great and reliable trades. NB: For best results, get my other premium indicators for more powerful and reliable signals. Get them here: https://www.m
FREE
Dual RSI
Paul Conrad Carlson
3 (1)
Indicator alerts for Dual Relative strength index rsi. Large rsi preset at 14 is below 30 small rsi preset at 4 is below 10 for buy bullish signals . Large rsi preset are 14 is above 70 small rsi preset at 4 is above 90 for sell bearish signals . Includes mobile and terminal alerts. draws lines when alerts. This indicator can help identify extremes and then the tops or bottoms of those extremes .
FREE
Reversal Candles MT5
Nguyen Thanh Cong
5 (3)
Introduction Reversal Candles is a cutting-edge non-repainting   forex indicator designed to predict price reversals with remarkable accuracy through a sophisticated combination of signals. Signal Buy when the last closed candle has a darker color (customizable) and an up arrow is painted below it Sell when the last closed candle has a darker color (customizable) and a down arrow is painted above it
FREE
What is this indicator? This indicator is the MACD (Moving Average Convergence/Divergence) supporting Virtual Trading mode of  Knots Compositor . When the mode is turned on, the indicator will be recalculated based on the displayed candlesticks. When the mode is turned off, the indicator will be recalculated based on the original chart candlesticks. Types of the applied price - Close - Open - High - Low - Median Price (HL/2) - Typical Price (HLC/3) - Weighted Price (HLCC/4) KC-Indicators
FREE
This indicator is a zero-lag indicator and displays  strength of trend change . True Trend  Oscillator Pro works best in combination with True Trend Moving Average Pro that displays exact trend as is. Oscillator value is exact price change in given direction of the trend. True Trend Moving Average Pro: https://www.mql5.com/en/market/product/103586 If you set PERIOD input parameter to 1 this indicator becomes a sharpshooter for binary options. Developers can use True Trend Oscillator in E
FREE
Bounce Zone MT5
Nguyen Thanh Cong
4.2 (5)
Introduction The Bounce Zone indicator is a cutting-edge non-repainting technical tool built to identify key areas on the price chart where market sentiment is likely to cause a significant price reversal. Using advanced algorithms and historical price data analysis, this indicator pinpoints potential bounce zones. Combined with other entry signal, this indicator can help forex traders place the best trades possible Signal A possible buy signal is generated when price is in the green zo
FREE
Trend Master Chart MT5
Frederic Jacques Collomb
5 (1)
Trend Master Chart è l'indicatore di tendenza di cui hai bisogno. Si sovrappone al grafico e utilizza la codifica a colori per definire le diverse tendenze/mosse del mercato. Utilizza un algoritmo che combina due medie mobili e diversi oscillatori. I periodi di questi tre elementi sono modificabili. Funziona su qualsiasi intervallo di tempo e su qualsiasi coppia. A colpo d'occhio sarai in grado di identificare una tendenza al rialzo o al ribasso e i diversi punti di ingresso in questa tendenz
FREE
DALA Forecast
Grigorii Matsnev
About the indicator: DALA Forecast is a universal tool for predicting the dynamics of time series of any nature. For prediction, modified methods of nonlinear dynamics analysis are used, on the basis of which a predictive model is built using machine learning methods.  To get the trial version of the indicator, you can contact me in private messages. How to use the indicator: Apply the indicator to your chosen financial instrument or indicator with the settings you need. The prediction will b
FREE
High Low Open Close
Alexandre Borela
4.97 (37)
Se ti piace questo progetto, lascia una recensione a 5 stelle. Seguire su instagram: borelatech Questo indicatore disegna i prezzi aperti, alti, bassi e di chiusura per i specificati periodo e può essere regolato per un determinato fuso orario. Questi sono livelli importanti guardati da molti istituzionali e professionali commercianti e può essere utile per voi per conoscere i luoghi dove potrebbero essere più attivo. I periodi disponibili sono: Giorno precedente. Settimana precedente. Me
FREE
Donchian Channel DC is the indicator of Donchian Channels, that plots maximum and minimum values of a specific period, besides mean value line. It´s possible to configure simple period for analysis and the indicator will plot all three values. You can trade with this indicator as trend or reversal, according to each strategy. Do not let to test others indicators as soon as others expert advisors.
HMA Color with Alerts MT5
Pavel Zamoshnikov
4.73 (48)
Hull Moving Average (HMA) is well-deservedly popular among traders because of the effective averaging of market noise and a relatively small delay. The current MetaTrader 5 version changes its color when the movement direction changes. Sound and text signals are available. It also supports sending email and push messages. It is possible to trigger a signal on the current incomplete bar, although such a signal may be canceled before completion if conditions are no longer appropriate. One of the p
FREE
Seconds Charts Demo
Aleksandr Goryachev
Micro  Demo  ******************* Секундные графики в Meta Trader 5 ********************** Более точного инструмента для входа в сделку вы не найдёте. Платная полная версия:  Micro "Second charts" В демоверсии секундные периоды сменяются случайным образом через случайные интервалы времени. Отсутствует автоматическая настройка периодов бесплатных индикаторов.   Входные параметры: Displayed bars - отображаемые бары Step of price levels, pp, 0-off - шаг отрисовки ценовых уровней, пункты Scale
FREE
SC MTF Stochastic MT5
Krisztian Kenedi
4.92 (13)
Highly configurable Stochastic indicator. Features: Highly customizable alert functions (at levels, crosses, direction changes via email, push, sound, popup) Multi timeframe ability Color customization (at levels, crosses, direction changes) Linear interpolation and histogram mode options Works on strategy tester in multi timeframe mode (at weekend without ticks also) Adjustable Levels Parameters: Stochastic Timeframe:  You can set the lower/higher timeframes for Stochastic. Stochastic    Bar
FREE
Peak Trough Analysis is the great tool to detect peaks and troughs in your chart. Peak Trough Analysis tool can use three different peaks and troughs detection algorithm. The three algorithm include the orignal Fractals Indicator by Bill Williams, the Modified Fractals indicator and ZigZag indicator. You can use this peak and trough analysis tool to detect the price pattern made up from Equilibrium Fractal-Wave process. For further usage, there are good guide line on how to use this peak trough
FREE
Highly configurable Adx indicator. Features: Highly customizable alert functions (at levels, crosses, direction changes via email, push, sound, popup) Multi timeframe ability Color customization (at levels, crosses, direction changes) Linear interpolation and histogram mode options Works on strategy tester in multi timeframe mode (at weekend without ticks also) Adjustable Levels Parameters: ADX   Timeframe:  You can set the lower/higher timeframes for Adx. ADX   Bar Shift:   you can set the
FREE
True Day
Aurthur Musendame
5 (1)
True Days is a tool designed specifically for the trader who wants to catch intraday volatility in price charts.  True day makes it easier for the trader to avoid trading in the dead zone - a period in time where markets are considered dead or non volatile. The trader can concentrate on finding opportunities only during periods of profound market movements. By default the indicator gives you a true day starting at 02:00 to 19:00 hours GMT+2. You can adjust according to your Time Zone. By deafult
FREE
Mitimom
Danil Poletavkin
The indicator is based on Robert Miner's methodology described in his book "High probability trading strategies" and displays signals along with momentum of 2 timeframes. A Stochastic oscillator is used as a momentum indicator. The settings speak for themselves period_1 is the current timeframe, 'current' period_2 is indicated - the senior timeframe is 4 or 5 times larger than the current one. For example, if the current one is 5 minutes, then the older one will be 20 minutes The rest of the
FREE
Value Chart Candlesticks
Flavio Javier Jarabeck
4.7 (10)
The idea of a Value Chart indicator was presented in the very good book I read back in 2020 , " Dynamic Trading Indicators: Winning with Value Charts and Price Action Profile ", from the authors Mark Helweg and David Stendahl. The idea is simple and the result is pure genius: Present candlestick Price analysis in a detrended way! HOW TO READ THIS INDICATOR Look for Overbought and Oversold levels. Of course, you will need to test the settings a lot to find the "correct" one for your approach.
FREE
如果产品有任何问题或者您需要在此产品上添加功能,请联系我 Contact/message me if you encounter any issue using the product or need extra feature to add on the base version. Floating Highest Lowest MT5 provides you an intuitive and user-friendly method to monitor the floating highest (profit) and lowest (loss) that all your trades together ever arrive. For example, I opened 3 orders, which arrived at $4.71 floating profit when trade following trend. Later when the trend is against me, these 3 orders arrive $30 in loss, and
FREE
Cumulative Delta MT5
Evgeny Shevtsov
4.53 (53)
The indicator analyzes the volume scale and splits it into two components - seller volumes and buyer volumes, and also calculates the delta and cumulative delta. The indicator does not flicker or redraw, its calculation and plotting are performed fairly quickly, while using the data from the smaller (relative to the current) periods. The indicator operation modes can be switched using the Mode input variable: Buy - display only the buyer volumes. Sell - display only the seller volumes. BuySell -
FREE
Trade Sentiment or trade assistant is a MT5 Indicatior. That show buy or sell signal of different indicator to assist to take trades. That will help you to take right trades or to get confirmation for your trade. You don't need to have this indicators. Including indicators like  RSI , STOCH , CCI. And the signals are Based on different Timeframes like 5M , 15H , 1H and 4H.
FREE
Free automatic Fibonacci is an indicator that automatically plots a Fibonacci retracement based on the number of bars you select on the BarsToScan setting in the indicator. The Fibonacci is automatically updated in real time as new highest and lowest values appears amongst the selected bars. You can select which level values to be displayed in the indicator settings. You can also select the color of the levels thus enabling the trader to be able to attach the indicator several times with differe
FREE
High Trend Lite MT5
Evgeniy Scherbina
5 (1)
The indicator High Trend Lite monitors 5 symbols in up to 3 timeframes simultaneously and calculates the strength of their signals. The indicator notifies you when a signal is the same in different timeframes. The indicator can do this from just one chart. Therefore, High Trend Lite is a multicurrency and multitimeframe indicator. With the High Trend Pro , available at this link , you will have an unlimited number of symbols, 4 timeframes, a colourful chart of the primary MACD indicator, several
FREE
Highly configurable MFI indicator. Features: Highly customizable alert functions (at levels, crosses, direction changes via email, push, sound, popup) Multi timeframe ability Color customization (at levels, crosses, direction changes) Linear interpolation and histogram mode options Works on strategy tester in multi timeframe mode (at weekend without ticks also) Adjustable Levels Parameters: MFI Timeframe:  You can set the current or a higher timeframes for MFI. MFI Bar Shift:   you can set th
FREE
Show Pips for MT5
Roman Podpora
4.63 (19)
Questo indicatore informativo sarà utile per coloro che vogliono essere sempre informati sulla situazione attuale del conto. -   Indicatori più utili L'indicatore mostra dati come profitto in punti, percentuale e valuta, nonché lo spread per la coppia corrente e il tempo fino alla chiusura della barra nell'intervallo di tempo corrente. Esistono diverse opzioni per posizionare la linea delle informazioni sulla carta: A destra del prezzo (corre dietro al prezzo); Come commento (nell'angolo in a
FREE
Pull Back
Zoltan Nemet
4.88 (8)
Volume pressure and oscillator overbougth - oversold condition togedther. Signals appears on chart. Turnig points, trading ranges, support- resistance levels also. Change parameters in the trendscalp settings. TTF bars can be set: 8, or, 15, or 45, 150. Greather periods are very useful at strong support - resistance areas.  IF ONE OF OUR FREE INDICATOR IS NICE TO YOU, FEEL FREE TO BUY AT LEAST OUR CHIEPST PRODUCT TO DONATE US. "Lots of small peace can be a mountain" ( nathan rothschild, john len
FREE
Gli utenti di questo prodotto hanno anche acquistato
TPSpro RFI Levels MT5
Roman Podpora
4.75 (12)
ISTRUZIONI       RUS   -   INGLESE       Si   consiglia di utilizzare con un indicatore       -       TPSpro   TENDENZA PRO -   Versione MT4         Un elemento chiave nel trading sono le zone o i livelli da cui vengono prese le decisioni di acquisto o vendita di uno strumento di trading. Nonostante i tentativi dei principali attori di nascondere la loro presenza sul mercato, lasciano inevitabilmente delle tracce. Il nostro compito era imparare a identificare queste tracce e interpretarle corre
TPSproTREND PrO MT5
Roman Podpora
4.89 (9)
TPSpro TREND PRO   è un indicatore di tendenza che analizza automaticamente il mercato, fornisce informazioni sulla tendenza e sui rispettivi cambiamenti e fornisce segnali per entrare nelle operazioni senza ridisegnare. L'indicatore utilizza ciascuna candela e la analizza separatamente. Si riferisce a vari shock al rialzo o al ribasso. Punto di ingresso preciso per il trading di valute, criptovalute, metalli, azioni e indici! Versione MT5                   Descrizione completa dell'indicatore
Atbot
Zaha Feiz
4.92 (36)
AtBot:  Come funziona e come usarlo ### Come funziona L'indicatore "AtBot" per la piattaforma MT5 genera segnali di acquisto e vendita utilizzando una combinazione di strumenti di analisi tecnica. Integra la Media Mobile Semplice (SMA), la Media Mobile Esponenziale (EMA) e l'indice di Gamma Vero Medio (ATR) per identificare opportunità di trading. Inoltre, può utilizzare le candele Heikin Ashi per migliorare la precisione dei segnali. Lascia una recensione dopo l'acquisto e ricevi un regalo bon
Trend Screener Pro MT5
STE S.S.COMPANY
4.87 (63)
Indicatore di tendenza, soluzione unica rivoluzionaria per il trading di tendenze e il filtraggio con tutte le importanti funzionalità di tendenza integrate in un unico strumento! È un indicatore multi-timeframe e multi-valuta al 100% non ridipingibile che può essere utilizzato su tutti i simboli/strumenti: forex, materie prime, criptovalute, indici e azioni. Trend Screener è un indicatore di tendenza che segue un indicatore efficiente che fornisce segnali di tendenza a freccia con punti nel gra
Innanzitutto è importante sottolineare che questo sistema di trading è un indicatore Non-Repainting, Non-Redrawing e Non-Lagging, il che lo rende ideale sia per il trading manuale che per quello automatico. Corso online, manuale e download di preset. Il "Sistema di Trading Smart Trend MT5" è una soluzione completa pensata sia per i trader principianti che per quelli esperti. Combina oltre 10 indicatori premium e offre più di 7 robuste strategie di trading, rendendolo una scelta versatile per div
Atomic Analyst MT5
Issam Kassas
4.32 (19)
Innanzitutto, vale la pena sottolineare che questo indicatore di trading non è repaint, non è ridisegno e non presenta ritardi, il che lo rende ideale sia per il trading manuale che per quello automatico. Manuale utente: impostazioni, input e strategia. L'Analista Atomico è un indicatore di azione del prezzo PA che utilizza la forza e il momentum del prezzo per trovare un miglior vantaggio sul mercato. Dotato di filtri avanzati che aiutano a rimuovere rumori e segnali falsi, e aumentare il pote
Quantum TrendPulse
Bogdan Ion Puscasu
Ecco   Quantum TrendPulse   , lo strumento di trading definitivo che combina la potenza di   SuperTrend   ,   RSI   e   Stocastico   in un unico indicatore completo per massimizzare il tuo potenziale di trading. Progettato per i trader che cercano precisione ed efficienza, questo indicatore ti aiuta a identificare con sicurezza le tendenze di mercato, i cambiamenti di momentum e i punti di entrata e uscita ottimali. Caratteristiche principali: Integrazione SuperTrend:   segui facilmente l'andame
FX Volume MT5
Daniel Stein
4.93 (14)
Ricevi il tuo aggiornamento quotidiano sul mercato con dettagli e schermate tramite il nostro Morning Briefing qui su mql5 e su Telegram ! FX Volume è il PRIMO e UNICO indicatore di volume che fornisce una visione REALE del sentiment del mercato dal punto di vista del broker. Fornisce informazioni straordinarie su come gli operatori di mercato istituzionali, come i broker, sono posizionati sul mercato Forex, molto più velocemente dei rapporti COT. Vedere queste informazioni direttamente sul vo
FX Power MT5 NG
Daniel Stein
5 (6)
Ricevi il tuo aggiornamento quotidiano sul mercato con dettagli e schermate tramite il nostro Morning Briefing qui su mql5 e su Telegram ! FX Power MT5 NG è la nuova generazione del nostro popolare misuratore di forza delle valute, FX Power. Cosa offre questo misuratore di forza di nuova generazione? Tutto ciò che avete amato dell'FX Power originale IN PIÙ Analisi della forza di ORO/XAU Risultati di calcolo ancora più precisi Periodi di analisi configurabili individualmente Limite di calcolo pe
Gold Stuff mt5
Vasiliy Strukov
4.92 (169)
Gold Stuff mt5 è un indicatore di tendenza progettato specificamente per l'oro e può essere utilizzato anche su qualsiasi strumento finanziario. L'indicatore non ridisegna e non è in ritardo. Periodo consigliato H1. Contattami subito dopo l'acquisto per avere le impostazioni e un bonus personale!   I risultati in tempo reale possono essere visualizzati qui.  Puoi ottenere una copia gratuita del nostro indicatore Strong Support e Trend Scanner, per favore scrivi in ​​privato. M   IMPOSTAZION
Questo cruscotto mostra gli ultimi   pattern armonici   disponibili per i simboli selezionati, in modo da risparmiare tempo ed essere più efficienti /   versione MT4 . Indicatore gratuito:   Basic Harmonic Pattern Colonne dell'indicatore Symbol :   vengono visualizzati i simboli selezionati Trend:   rialzista o ribassista Pattern:   tipo di pattern (gartley, butterfly, bat, crab, shark, cypher o ABCD) Entry:   prezzo di ingresso SL:   prezzo di stop loss TP1:   1 prezzo di take profit TP
Presentazione       Quantum Breakout PRO   , l'innovativo indicatore MQL5 che sta trasformando il modo in cui scambi le zone di breakout! Sviluppato da un team di trader esperti con un'esperienza di trading di oltre 13 anni,       Quantum Breakout PRO       è progettato per spingere il tuo viaggio di trading a nuovi livelli con la sua strategia innovativa e dinamica della zona di breakout. Quantum Breakout Indicator ti fornirà frecce di segnalazione sulle zone di breakout con 5 zone target
Top indicator for MT5   providing accurate signals to enter a trade without repainting! It can be applied to any financial assets:   forex, cryptocurrencies, metals, stocks, indices .  Watch  the video  (6:22) with an example of processing only one signal that paid off the indicator! MT4 version is here It will provide pretty accurate trading signals and tell you when it's best to open a trade and close it. Most traders improve their trading results during the first trading week with the help of
Innanzitutto, vale la pena sottolineare che questo Strumento di Trading è un Indicatore Non-Ridipingente, Non-Ridisegnante e Non-Laggante, il che lo rende ideale per il trading professionale. Corso online, manuale utente e demo. L'Indicatore Smart Price Action Concepts è uno strumento molto potente sia per i nuovi che per i trader esperti. Racchiude più di 20 utili indicatori in uno solo, combinando idee di trading avanzate come l'Analisi del Trader del Circolo Interno e le Strategie di Trad
Blahtech Supply Demand MT5
Blahtech Limited
4.54 (13)
Was: $299  Now: $99   Supply Demand uses previous price action to identify potential imbalances between buyers and sellers. The key is to identify the better odds zones, not just the untouched ones. Blahtech Supply Demand indicator delivers functionality previously unavailable on any trading platform. This 4-in-1 indicator not only highlights the higher probability zones using a multi-criteria strength engine, but also combines it with multi-timeframe trend analysis, previously confirmed swings
L'indicatore Quadrato di Gann è uno strumento potente di analisi di mercato basato sull'articolo "Formula Matematica per le Previsioni di Mercato" scritto da W.D. Gann. Questo strumento utilizza concetti matematici e teorie di Gann per effettuare un'analisi precisa del mercato. Utilizza i quadrati di 144, 90, 52 e anche il quadrato di 9. Inoltre, integra il metodo del  per il quadrato di 9 e la sua relazione con canali e modelli stellari di quel quadrato. Manuale Utente e Applicazione: Prima di
TPA True Price Action indicator reveals the true price action of the market makers through 100% non-repainting signals strictly at the close of a candle! TPA shows entries and re-entries, every time the bulls are definitely stronger than the bears and vice versa. Not to confuse with red/green candles. The shift of power gets confirmed at the earliest stage and is ONE exit strategy of several. There are available now two free parts of the TPA User Guide for our customers. The first "The Basics"
Matrix Arrow Indicator MT5
Juvenille Emperor Limited
5 (13)
Matrix Arrow Indicator MT5   è un trend unico 10 in 1 che segue un indicatore multi-timeframe al   100% non ridipinto   che può essere utilizzato su tutti i simboli/strumenti:   forex ,   materie prime ,   criptovalute ,   indici ,   azioni .  Matrix Arrow Indicator MT5  determinerà la tendenza attuale nelle sue fasi iniziali, raccogliendo informazioni e dati da un massimo di 10 indicatori standard, che sono: Indice di movimento direzionale medio (ADX) Indice del canale delle materie prime (CCI
ATrend
Zaha Feiz
4.83 (6)
"ATREND: Come funziona e come utilizzarlo" ### Come funziona L'indicatore "ATREND" per la piattaforma MT5 è progettato per fornire ai trader robusti segnali di acquisto e vendita utilizzando una combinazione di metodologie di analisi tecnica. Questo indicatore sfrutta principalmente l'Average True Range (ATR) per la misurazione della volatilità, insieme ad algoritmi di individuazione dei trend per identificare potenziali movimenti di mercato. Lascia un messaggio dopo l'acquisto e ricevi un rega
Quantum Trend Sniper
Bogdan Ion Puscasu
4.8 (49)
Presentazione       Quantum Trend Sniper Indicator   , l'innovativo indicatore MQL5 che sta trasformando il modo in cui identifichi e scambi le inversioni di tendenza! Sviluppato da un team di trader esperti con un'esperienza di trading di oltre 13 anni,       Indicatore Quantum Trend Sniper       è progettato per spingere il tuo viaggio di trading verso nuove vette con il suo modo innovativo di identificare le inversioni di tendenza con una precisione estremamente elevata. *** Acquista Quant
Auto Order Block with break of structure based on ICT and Smart Money Concepts (SMC) Futures Break of Structure ( BoS )             Order block ( OB )            Higher time frame Order block / Point of Interest ( POI )    shown on current chart           Fair value Gap ( FVG ) / Imbalance   -  MTF      ( Multi Time Frame )    HH/LL/HL/LH  -  MTF      ( Multi Time Frame )  Choch  MTF      ( Multi Time Frame )  Volume Imbalance     ,  MTF          vIMB Gap’s Power of 3 Equal High
Ora $ 147 (aumentando a $ 499 dopo alcuni aggiornamenti) - account illimitati (PC o MAC) Manuale utente di RelicusRoad + Video di formazione + Accesso al gruppo Discord privato + Stato VIP UN NUOVO MODO DI GUARDARE IL MERCATO RelicusRoad è l'indicatore di trading più potente al mondo per forex, futures, criptovalute, azioni e indici, fornendo ai trader tutte le informazioni e gli strumenti di cui hanno bisogno per rimanere redditizi. Forniamo analisi tecniche e piani di trading per aiutar
PTS - Divergence Buy Finder di Precision Trading Systems Il Precision Divergence Finder è stato progettato per individuare i minimi di mercato con estrema precisione e lo fa frequentemente. Nell'analisi tecnica, l'arte di individuare i minimi di mercato è generalmente molto più semplice rispetto a individuare i massimi, e questo strumento è progettato appositamente per questa finalità. Dopo aver identificato una divergenza rialzista, è saggio attendere che la tendenza si inverta prima di ac
GannRS Trend Scalper   GannRS is an advanced trading tool based on Gann Law and Supports and Resistances. designed to have an   active trading at any time not lagging Indications are given at the beginning of a new candle Please watch the full tutorial video. How to use GannRS Very easy to set up... Put it on your chart Adjust inputs Inputs Show Resistance and support : [bool]  true = Shows R/S on chart false = does not show Show Levels :[bool]  true = Shows levels on the chart false = doe
Advanced Supply Demand MT5
Bernhard Schweigert
4.5 (14)
La migliore soluzione per qualsiasi principiante o trader esperto! Questo indicatore è uno strumento di trading unico, di alta qualità e conveniente perché abbiamo incorporato una serie di funzionalità proprietarie e una nuova formula. Con questo aggiornamento, sarai in grado di mostrare fusi orari doppi. Non solo potrai mostrare una TF più alta, ma anche entrambe, la TF del grafico, PIÙ la TF più alta: SHOWING NESTED ZONES. Tutti i trader di domanda di offerta lo adoreranno. :) Informazioni imp
Contact me for instruction, any questions! Related Product:  Gold Trade Expert MT5 Introduction The breakout and retest strategy is traded support and resistance levels. it involves price breaking through a previous level.  The break and retest strategy is designed to help traders do two main things, the first is to avoid false breakouts. Many false breakouts start with a candlestick that breaks out of a level but ends with an immediate candlestick that brings the price back into the level. T
Alla ricerca di un potente indicatore di trading forex che possa aiutarti a identificare facilmente opportunità di trading redditizie? Non guardare oltre il Super Segnale Bestia. Questo indicatore basato sulle tendenze di facile utilizzo monitora continuamente le condizioni del mercato, cercando nuove tendenze in via di sviluppo o saltando su quelle esistenti. Il Beast Super Signal fornisce un segnale di acquisto o di vendita quando tutte le strategie interne sono allineate e sono al 100% in con
Was: $249  Now: $99   Market Profile defines a number of day types that can help the trader to determine market behaviour. A key feature is the Value Area, representing the range of price action where 70% of trading took place. Understanding the Value Area can give traders valuable insight into market direction and establish the higher odds trade. It is an excellent addition to any system you may be using. Inspired by Jim Dalton’s book “Mind Over Markets”, this indicator is designed to suit the
Black Dragon indicator mt5
Ramil Minniakhmetov
4.82 (55)
L'indicatore di rilevamento delle tendenze integrerà qualsiasi strategia e può anche essere utilizzato come strumento indipendente. IMPORTANTE! Contattami subito dopo l'acquisto per ricevere istruzioni e un bonus!  Vantaggi Facile da usare, non sovraccarica il grafico con informazioni non necessarie; Possibilità di utilizzo come filtro per qualsiasi strategia; Ha livelli integrati di supporto e resistenza dinamici, che possono essere utilizzati sia per la presa di profitto che per imposta
FxaccurateLS
Shiv Raj Kumawat
WHY IS OUR FXACCCURATE LS MT5 THE PROFITABLE ? PROTECT YOUR CAPITAL WITH RISK MANAGEMENT Gives entry, stop and target levels from time to time. It finds Trading opportunities by analyzing what the price is doing during established trends. POWERFUL INDICATOR FOR A RELIABLE STRATEGIES We have made these indicators with a lot of years of hard work. It is made at a very advanced level. Established trends provide dozens of trading opportunities, but most trend indicators completely ignore them!
Filtro:
Jaydeep Jaganbhai Patel
322
Jaydeep Jaganbhai Patel 2024.10.18 05:13 
 

good indicator.

arpad f.
18
arpad f. 2024.09.11 20:22 
 

L'utente non ha lasciato alcun commento sulla valutazione.

Rispondi alla recensione
Versione 1.4 2024.09.14
Minor bug fixes.
Versione 1.3 2024.09.13
New Features of v1.3:

-Fifth option to use a "sequential" volume decrease condition as it was in v1.0; Now when switching to "Sequential", the Volume Tolerance tells the code how many increasing volume bars are allowed within the scope of the decreasing previous volume bars. When switching to either one of the MA methods, the Volume Tolerance adapts and turns back to percentage (0.05 = 5%)

-Sixth option for volume condition: You can now turn off volume conditions completely.

-Bypassing volume checks: When OFF is selected, the volume conditions are bypassed, and the indicator focuses solely on candle patterns.

-Flexible volume tolerance: Different handling of VolumeTolerance depending on the selected method (percentage or sequential count).

-Streamlined pattern identification: Candle patterns can now be identified with or without volume checks.

+---------------+

-Swapped the grading texts to wingdings to avoid clutter & changed the grading principles to allow for the correction in logic, you'll notice the amount of identified
candles has significatnly decreased:
-Great Swing: over 140 candles | OBJPROP_ARROWCODE, 176
-Not Bad Swing: between 90 and 139 candles | OBJPROP_ARROWCODE, 252
-Avg. Swing: between 20 and 89 candles | OBJPROP_ARROWCODE, 119
-Weak Swing: below 20 candles, NOT MARKED

+---------------+

-Added a 76.8% Fib level, as well as made the fib retracement colour customisable.

+---------------+

The Revamped Volume Conditions Breakdown:

1. Volume Window:
-This is the number of candles you look at to check whether the volume is decreasing.
-For example, if the VolumeWindow is set to 5, the system looks at the last 5 candles' volume and checks if they show a general pattern of decreasing volume.

2. Volume Tolerance:
-This is a percentage threshold that defines how much the volume needs to decrease for it to be considered significant.
-A lower tolerance (e.g., 0.05 or 5%) means that even a small decrease in volume counts, while a higher tolerance requires a steeper drop in volume for the candle to pass the rule.
-For example, if VolumeTolerance is 5%, the current candle’s volume must be at least 5% lower than the average volume over the previous candles to pass the test.

3. Moving Averages:
-The volume is not just compared directly candle-to-candle. Instead, it’s compared against a moving average of the volume, which gives a smoother and more reliable measure of how volume is behaving over time.

-There are four types of moving averages you can choose from depending on your strategy:
-SMA (Simple Moving Average): A straightforward average of the volumes over the window. Every candle is treated equally. Mid-term
-EWMA (Exponentially Weighted Moving Average): Gives more weight to recent candles. So, if recent volumes are changing, it reacts faster than the SMA. Intra-day
-SMMA (Smoothed Moving Average): This averages out the data even more slowly, making it less sensitive to short-term changes but better for identifying long-term
trends. Long Term
-LWMA (Linear Weighted Moving Average): Similar to EWMA but with a linear weighting, meaning the most recent candle has the most influence, but older candles still
matter (a little bit). Ultra Short-Term / Intra-Hour

4. How It Works Together:
The system looks at the VolumeWindow number of candles and calculates the selected moving average (SMA, EWMA, SMMA, or LWMA).
It then compares the current candle’s volume to the moving average and checks if it has dropped by the percentage set (Default 0.001 -0.1%) in the VolumeTolerance.
If the current volume is lower than the moving average by the required percentage, the volume is considered to be "decreasing" for that candle and only then the code will check if the candle fits the candle pattern conditions.

//+---------------------------------------------------------------------------------------------------------------+
Versione 1.2 2024.09.13
12345678
Versione 1.1 2024.09.12
-The logic to identify candles & draw lines has been corrected to include (lol) the volume criteria, now it will only draw the lines if all criteria has been met...

-Swapped the grading texts to wingdings to avoid clutter & changed the grading principles to allow for the correction in logic, you'll notice the amount of identified candles has significatnly decreased:
-Great Swing: over 140 candles | OBJPROP_ARROWCODE, 176
-Not Bad Swing: between 90 and 139 candles | OBJPROP_ARROWCODE, 252
-Avg. Swing: between 20 and 89 candles | OBJPROP_ARROWCODE, 119
-Weak Swing: below 20 candles, NOT MARKED

-Added a 76.8% Fib level, as well as made the fib retracement colour customisable.