TK Rainbow
- Indicatori
- Nguyen Trung Khiem
- Versione: 1.0
TK - Rainbow Indicator
Description:
The TK - Rainbow indicator is a robust tool for technical analysis, designed to provide a clear view of market trends through a multi-line approach. With 30 lines calculated at different periods, it offers an extensive analysis of price movements. The indicator uses a dual-color scheme to highlight upward and downward trends, making it easy to interpret market conditions at a glance.
Key Features:
- 30 Lines: Each line represents a different smoothing period to cover a wide range of market trends.
- Dual-Color Scheme: Uses two colors to differentiate between upward (cold color) and downward (warm color) trends.
- Customizable Settings: Adjust the line width, style, and step size to fit your trading preferences.
How to Use TK - Rainbow:
- Apply the Indicator:
- Add the TK - Rainbow indicator to your chart from MetaTrader 5’s list of indicators.
- Configure Parameters:
- Step (inpStep): Defines the period increment between each line. Adjust this to set the spacing of the lines.
- Price (inpPrice): Select the price type (e.g., Close, Open, High, Low) used for calculations.
- Lines Width (inpLinesWidth): Set the thickness of the lines for clarity.
- Lines Style (inpLinesStyle): Choose the style of the lines (e.g., Solid, Dashed).
- Interpret the Colors:
- Upward Trends: Lines in cold colors (blue) indicate an upward trend.
- Downward Trends: Lines in warm colors (red) signify a downward trend.
- Trading Strategies:
- Trend Identification:
- Bullish Trend: When most lines are in cold colors and positioned higher, it suggests a strong upward trend. Consider entering long positions or holding existing ones.
- Bearish Trend: When most lines are in warm colors and positioned lower, it indicates a strong downward trend. Consider entering short positions or holding existing ones.
- Trend Reversal:
- Reversal Signal: Look for a noticeable change in color across the lines. A shift from cold to warm colors or vice versa may signal a potential trend reversal. Confirm this signal with additional indicators or analysis methods.
- Line Crossovers:
- Crossover Confirmation: Watch for crossovers where shorter period lines move above or below longer period lines. This can confirm the strength or weakness of the trend and help with entry or exit decisions.
- Support and Resistance Levels:
- Trend Lines: Analyze the positions and movements of the lines to identify potential support and resistance levels. Flattening or divergence of lines can indicate key levels where price may reverse or consolidate.
- Trend Identification:
- Adjust Visibility:
- Customize the color scheme and line settings to enhance readability. Adjust the settings according to different trading timeframes and market conditions.
Tips:
- Combine the TK - Rainbow indicator with other technical analysis tools to confirm signals and improve trading decisions.
- Regularly review and adjust the indicator’s settings based on market behavior and your trading strategy.

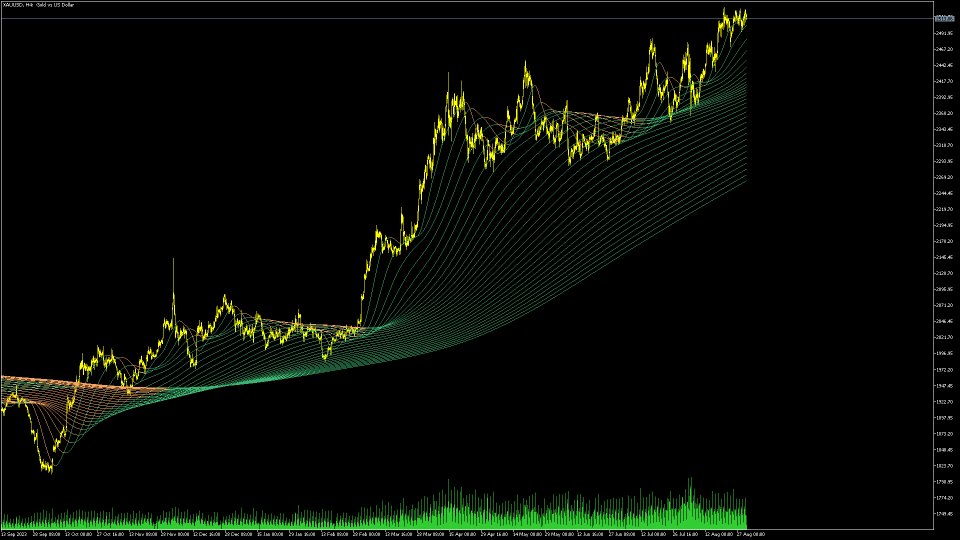
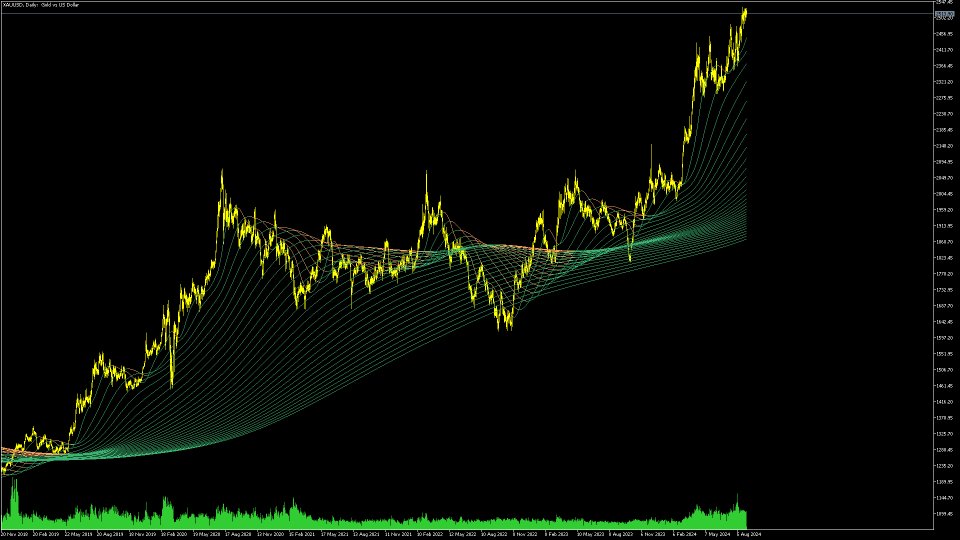
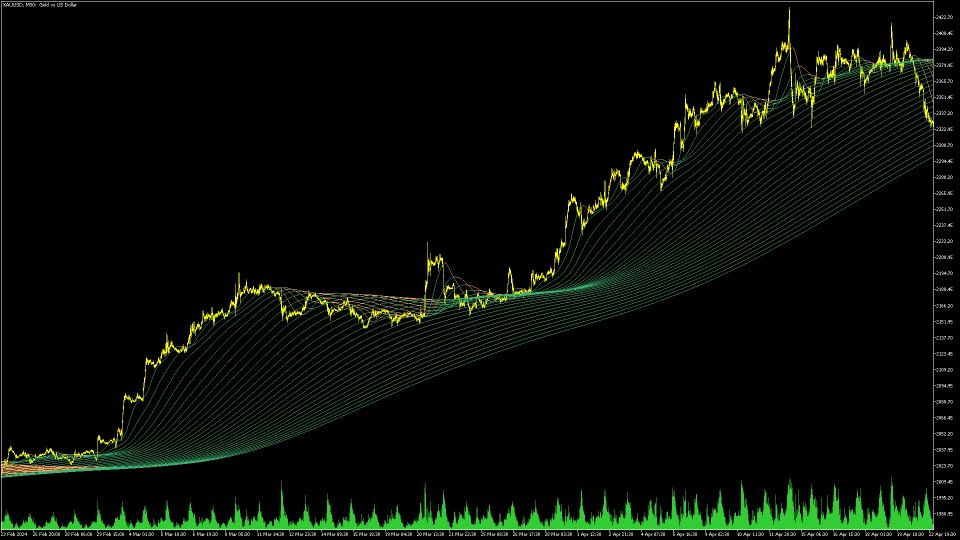
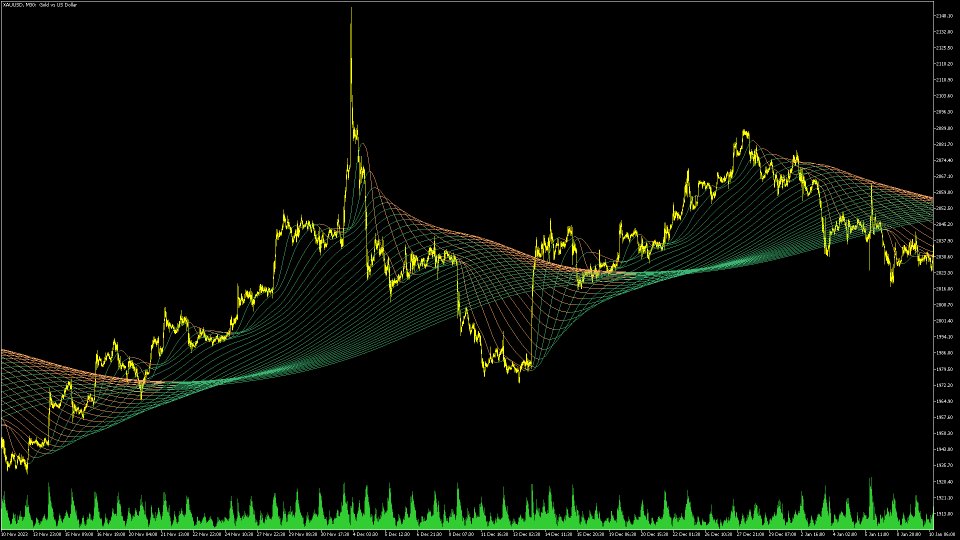


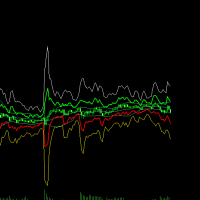



The **TK - Rainbow Indicator** is an excellent addition to the toolkit of any technical analyst or trader. Its multi-line approach, comprising **30 lines calculated over different periods**, provides an in-depth view of price movements and trends. This level of detail ensures traders can better identify subtle shifts in market momentum. The dual-color scheme is particularly user-friendly, enabling quick interpretation of upward and downward trends. By visually distinguishing between bullish and bearish conditions, the indicator simplifies decision-making, making it especially valuable for traders seeking clarity in complex market conditions. However, for some users, the sheer volume of lines might initially seem overwhelming. To maximize its potential, traders may need a period of familiarization to interpret the data effectively and integrate it into their broader strategy. ### **Pros:** - **Comprehensive Analysis:** Tracks market trends using 30 lines with different periods. - **Clear Visuals:** Dual-color scheme for intuitive trend identification. - **Versatility:** Suitable for various markets and trading strategies. ### **Cons:** - **Steep Learning Curve:** May require time to fully understand and utilize. - **Potential Clutter:** Too many lines might distract less experienced traders. ### **Verdict:** The TK - Rainbow Indicator is a powerful and visually appealing tool for traders who value detailed trend analysis. While it may demand some initial effort to master, its benefits in terms of clarity and depth of analysis are well worth the investment.