Session Average Date Range MT4
- Indicatori
- Tien Long Tu
- Versione: 1.40
- Aggiornato: 19 agosto 2024
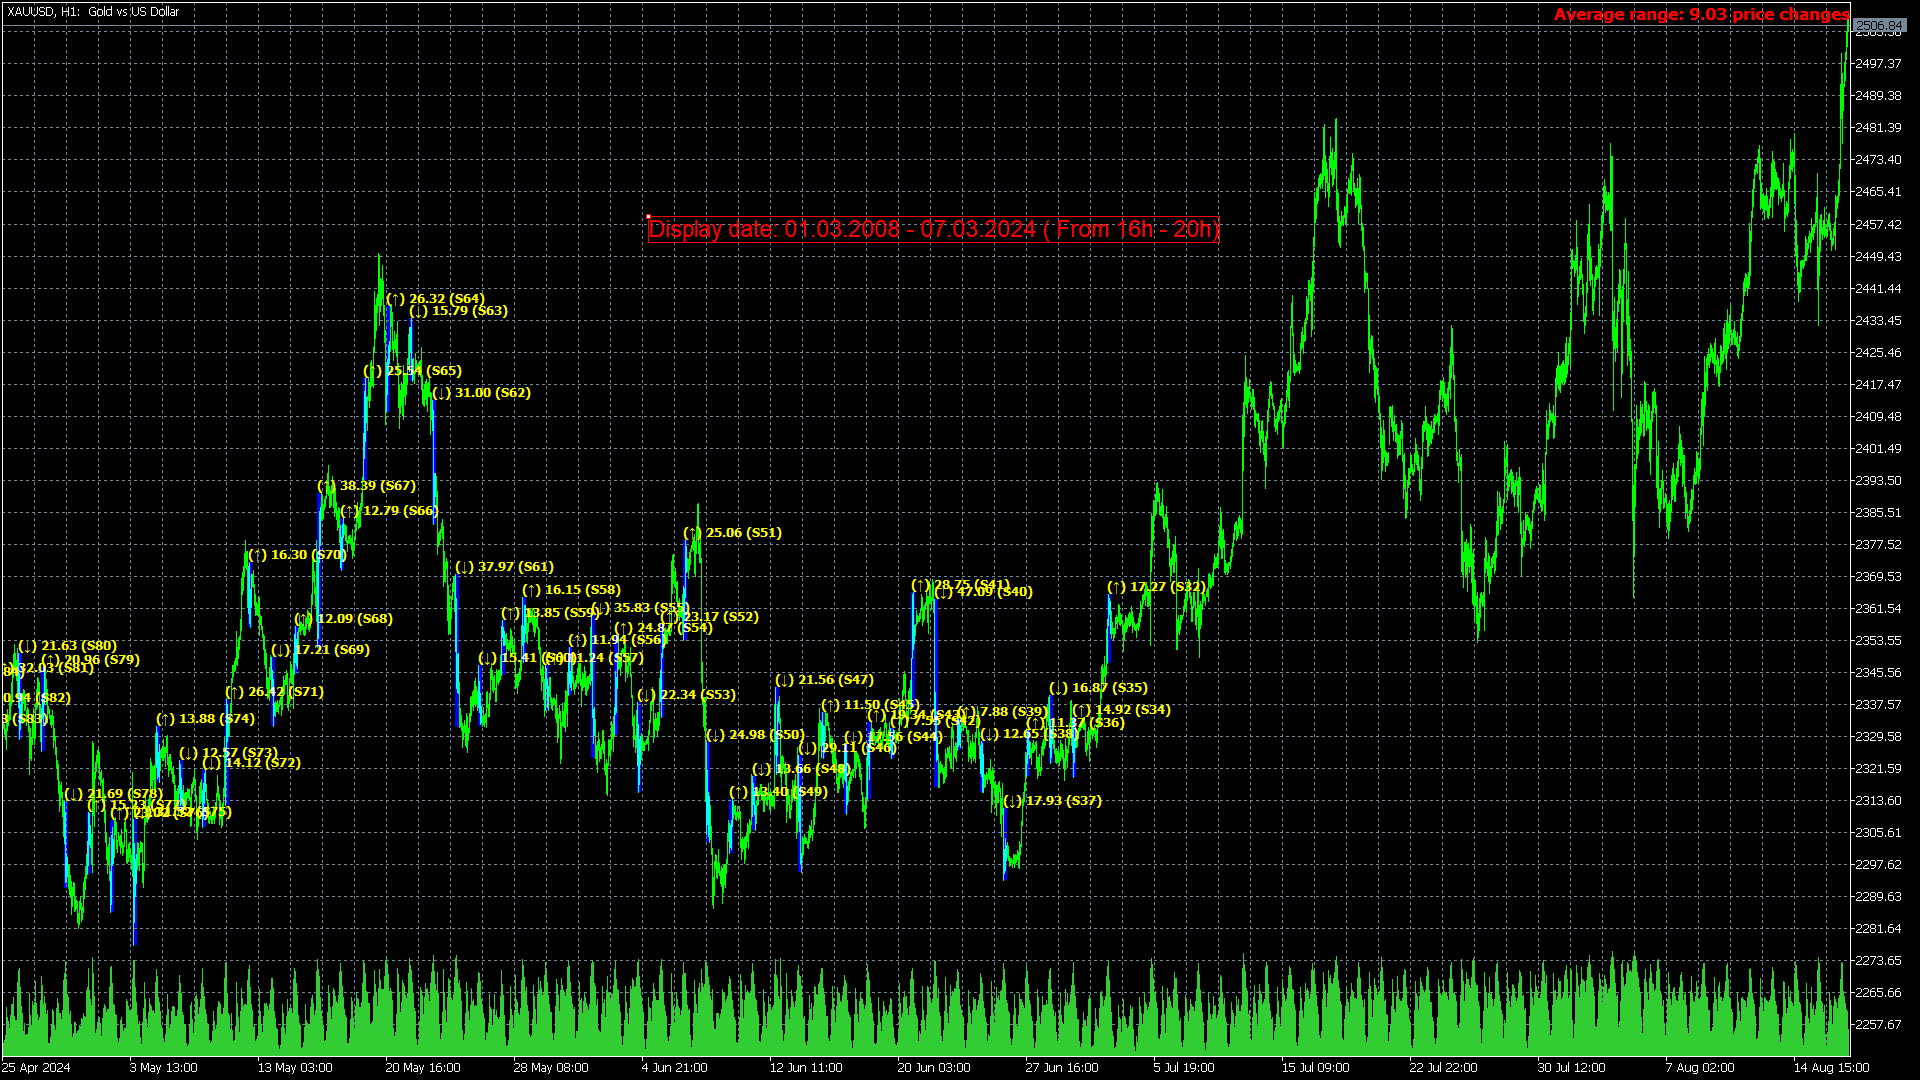
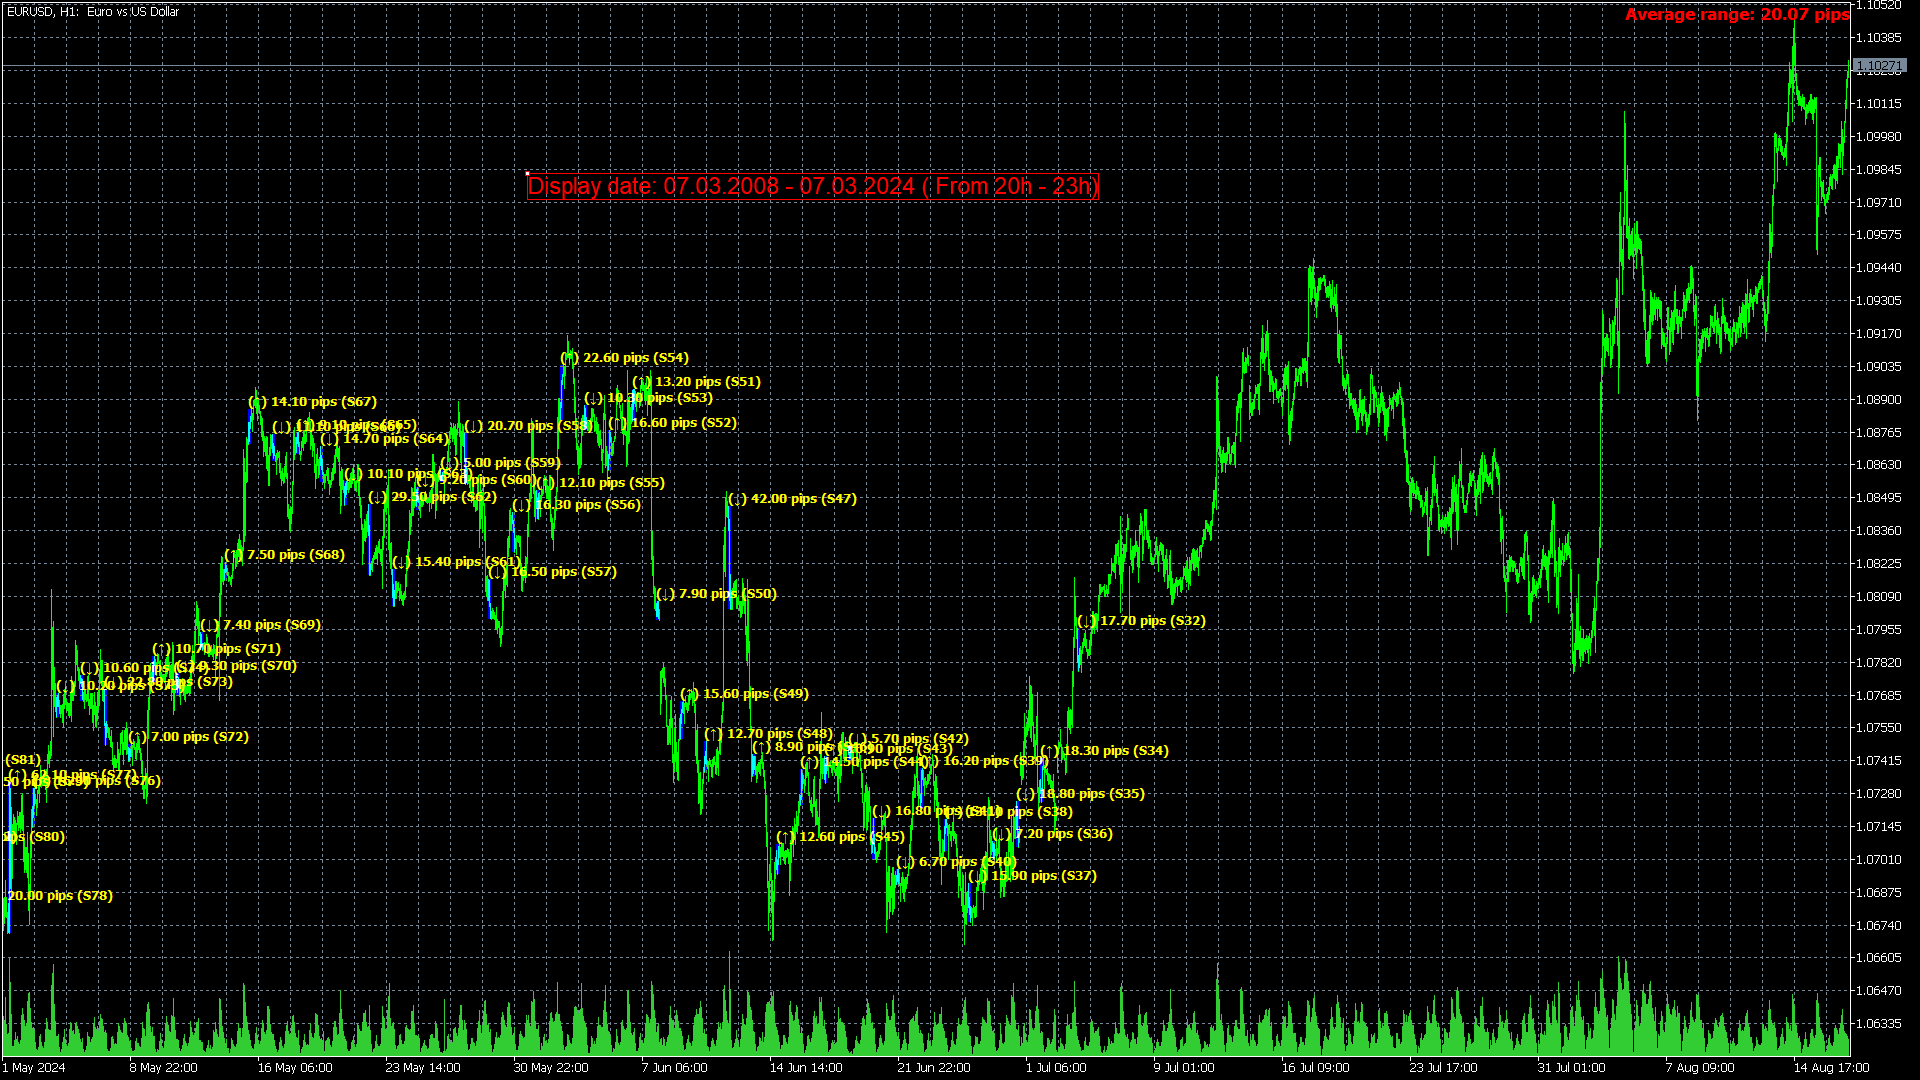
Session Average Date Range: Analyze and average the low - high of specific trading sessions within custom date ranges, offering insights into price movements and market behavior over selected periods.
The "Session Average Date Range" tool is an advanced analytical utility designed to empower traders and analysts by allowing them to dissect and evaluate the high and low range of specific trading sessions within a user-defined date range. This tool provides a flexible and precise approach to analyzing price dynamics and the high and low range over chosen periods, which is particularly valuable for those looking to understand market behavior during critical historical events.
**Note:** When the trading platform is closed, the indicator may not load correctly. To ensure it works, you may need to load the indicator, unload it, and then load it again.
**Note:** : This indicator can only be used with historical data. It does not support real-time data analysis.
Key Features:
1. **Customizable Time and Date Input:**
- **Start Time and End Time:** Users can specify the exact start and end times of the trading session they wish to analyze. This level of detail allows for the examination of specific market hours, such as the New York session, or any other time frame relevant to the analysis.
- **Start Date and End Date:** Define the range of dates for analysis, enabling users to focus on particular periods, such as the years 2007 to 2009, which were notable for significant economic events and market fluctuations.
2. **Session-Based Analysis:**
- The tool offers the ability to zoom in on specific trading sessions within the selected date range. This means users can analyze sessions independently, providing insights into how price movements, and other metrics varied during different parts of the trading day.
3. **Historical High and Low Range Insights:**
- By analyzing periods such as the economic crises from 2007 to 2009, users can gain a deeper understanding of how market volatility was influenced by major economic events. For example, evaluating the New York session's high and low during these years can reveal patterns and behaviors that were unique to those tumultuous times.
4. **Enhanced Price Analytics:**
- Traders and analysts can leverage this tool to perform detailed price analysis by focusing on specific time frames and dates. This is particularly useful for backtesting strategies or studying historical price behavior during key economic events or market conditions.
5. **Application for Long-Term Studies:**
- The tool supports long-term analysis, making it ideal for users who want to study historical market data over extended periods. This feature is essential for understanding how market dynamics evolve over time and for assessing the impact of significant historical events on trading sessions.
Practical Use Case:
Consider a trader interested in evaluating the the high and low range of the New York trading session during the global financial crisis of 2007-2009. By using the Session Average Date Range tool, the trader can input the exact start and end times for the New York session and set the date range from 2007 to 2009. The tool will then provide detailed analysis and average ranges of price movements during these sessions, offering valuable insights into how the session behaved under the stress of the financial crisis.
This tool is designed to support a broad range of users, from those conducting academic research to professional traders looking to refine their strategies based on historical data. By providing a customizable and detailed view of trading sessions, the Session Average Date Range tool stands as a powerful asset for anyone involved in price analysis and volatility assessment.
note: Works for timeframes of H4 and below.
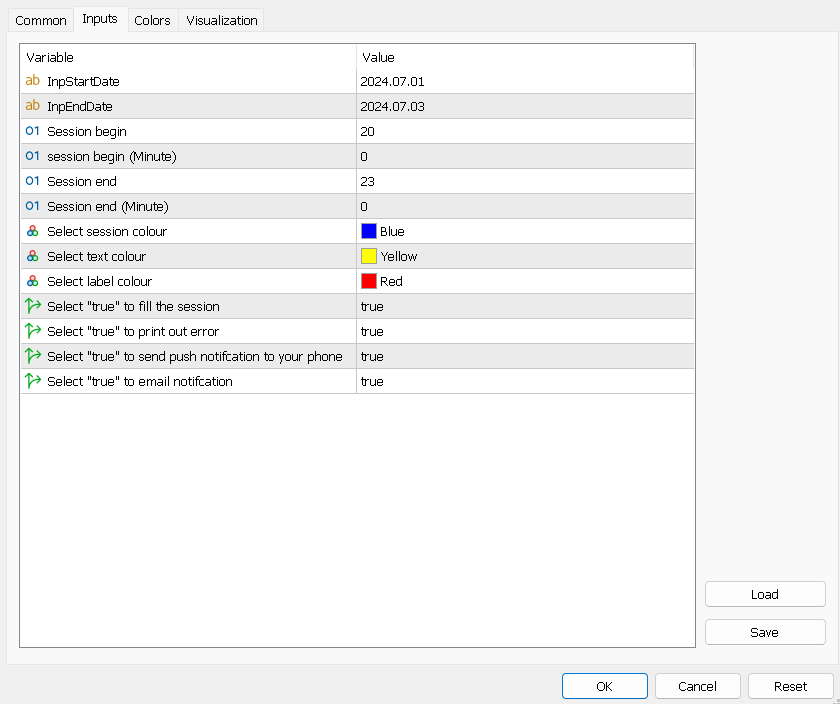
Main inputs
- InpStartDate: Specify the starting date for the analysis period. This sets the beginning of the range for which session data will be evaluated.
- InpEndDate: Define the ending date for the analysis period. This marks the end of the range and limits the session data evaluation to this date.