Reversal Up Down Arrows MT5
- Indicatori
- Vitalyi Belyh
- Versione: 1.20
- Attivazioni: 7
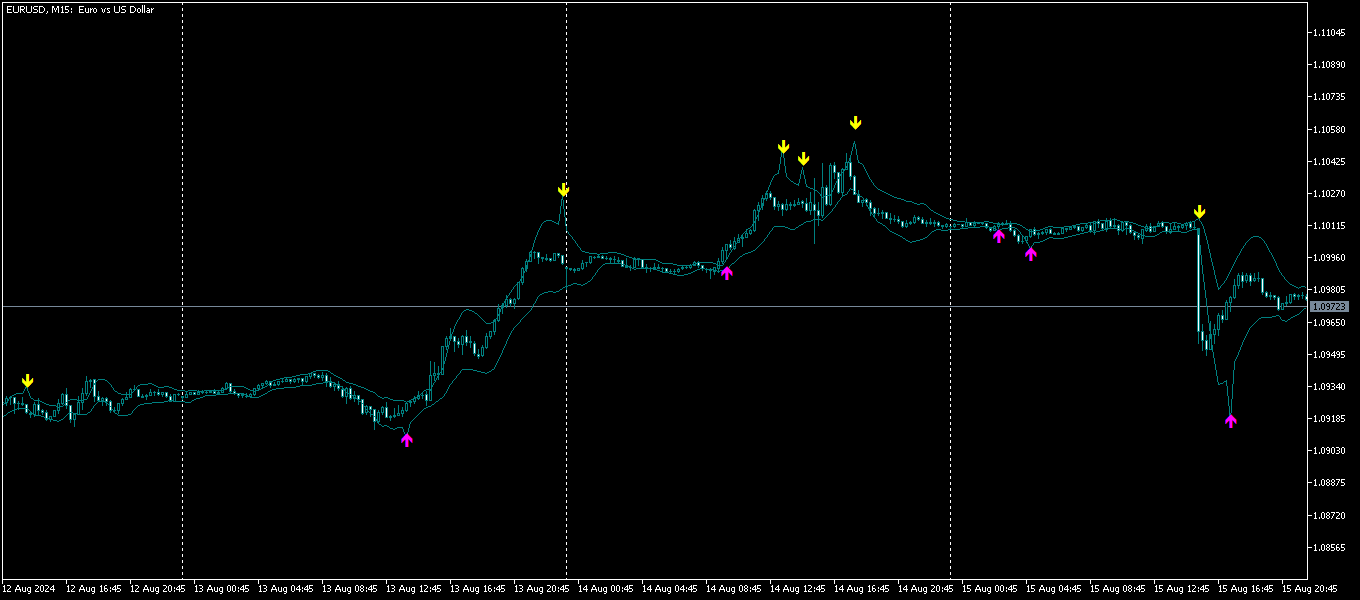
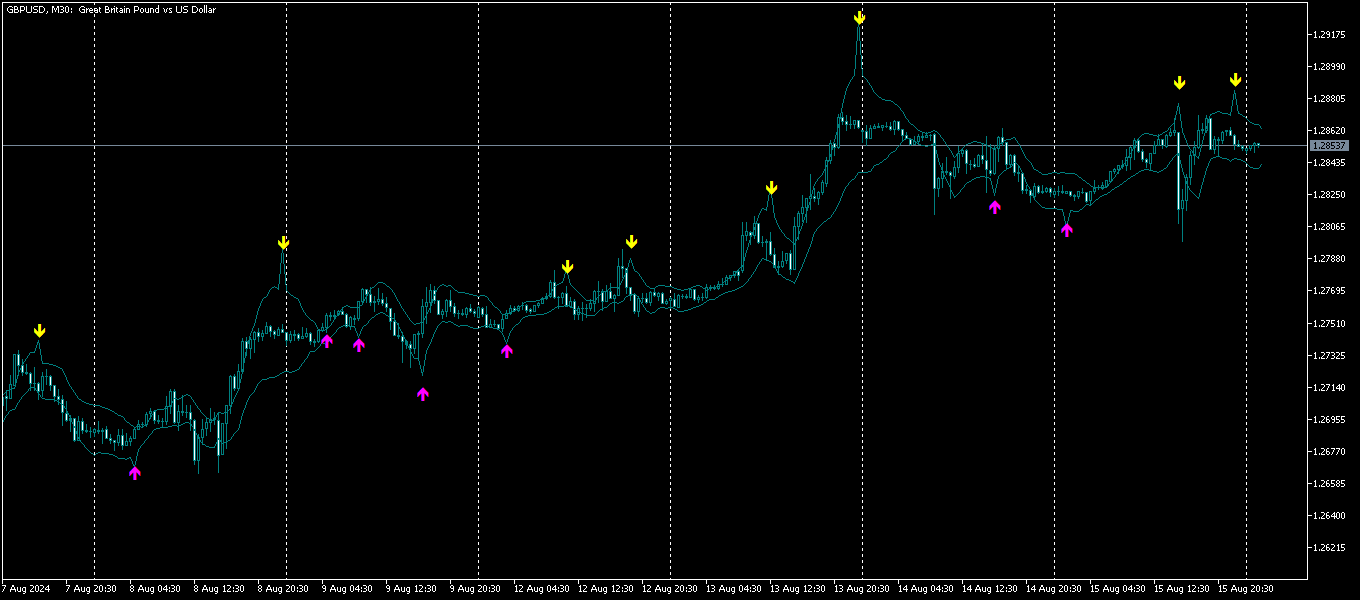
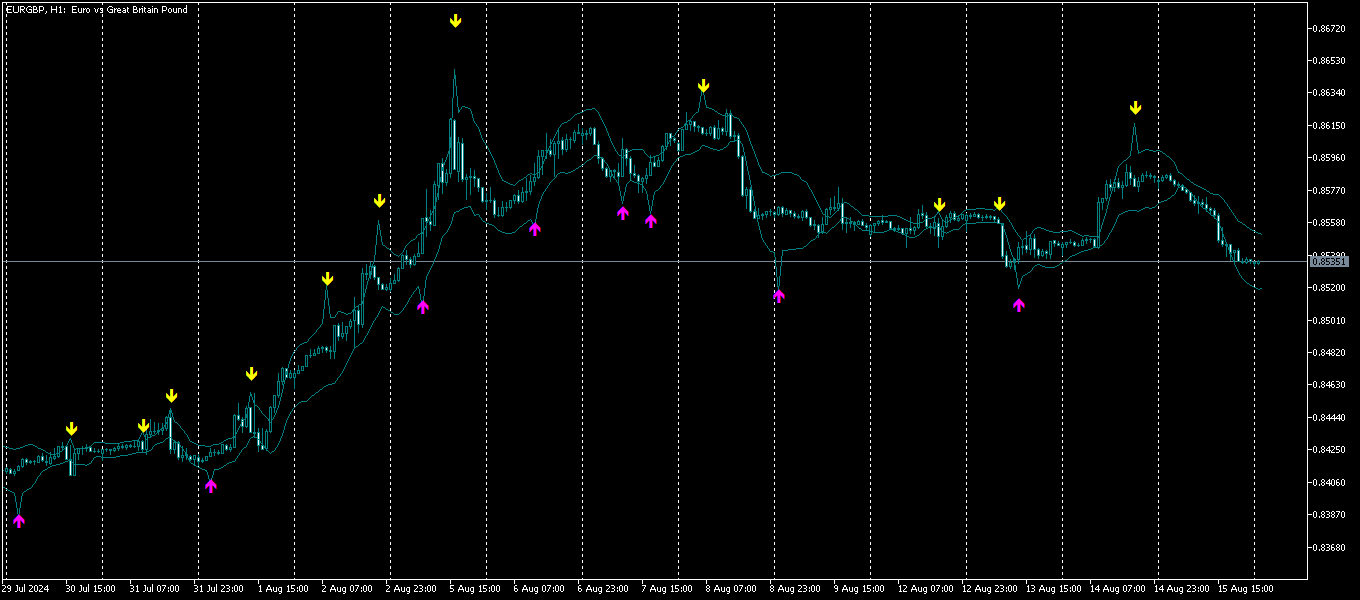
Una serie di indicatori che riconoscono i punti di svolta. Rileva i massimi e i minimi dalle combinazioni di candele dopo averli sottratti da due MA. Applicabile ai sistemi di trading quando si utilizzano le registrazioni anticipate. Può essere utilizzato lungo il trend per lo scalping e il trading intraday e per rilevare inversioni di trend nelle fasi iniziali.
Possibilità
Parametri di input
Possibilità
- I parametri forniscono impostazioni flessibili per qualsiasi intervallo di tempo e strumento di trading.
- Esistono diversi tipi di avvisi per i segnali.
- Freccia gialla - Sell signal , freccia rosa - Buy signal .
- Il calcolo ottimizzato dell'indicatore consente di aprirlo su più grafici senza utilizzare il processore.
- L'indicatore non viene mai ridisegnato, tutti i segnali vengono visualizzati solo quando la candela si chiude.
Parametri di input
- First Line - Primo periodo MA per il calcolo dei segnali
- Second Line - Il periodo della seconda MA per il calcolo dei segnali (si consiglia di impostarlo 2-4 volte più lungo del periodo della prima MA)
- Play Sound / Display Pop -up Message / Send Push Notification / Send Email - Utilizzo delle notifiche quando vengono visualizzate le frecce e le fermate del segnale.
- Sound for Signals - File audio per segnali.