• Panoramica
  • Recensioni
  • Commenti
  • Novità

MultiSymbolsWpr Indice x IBOV

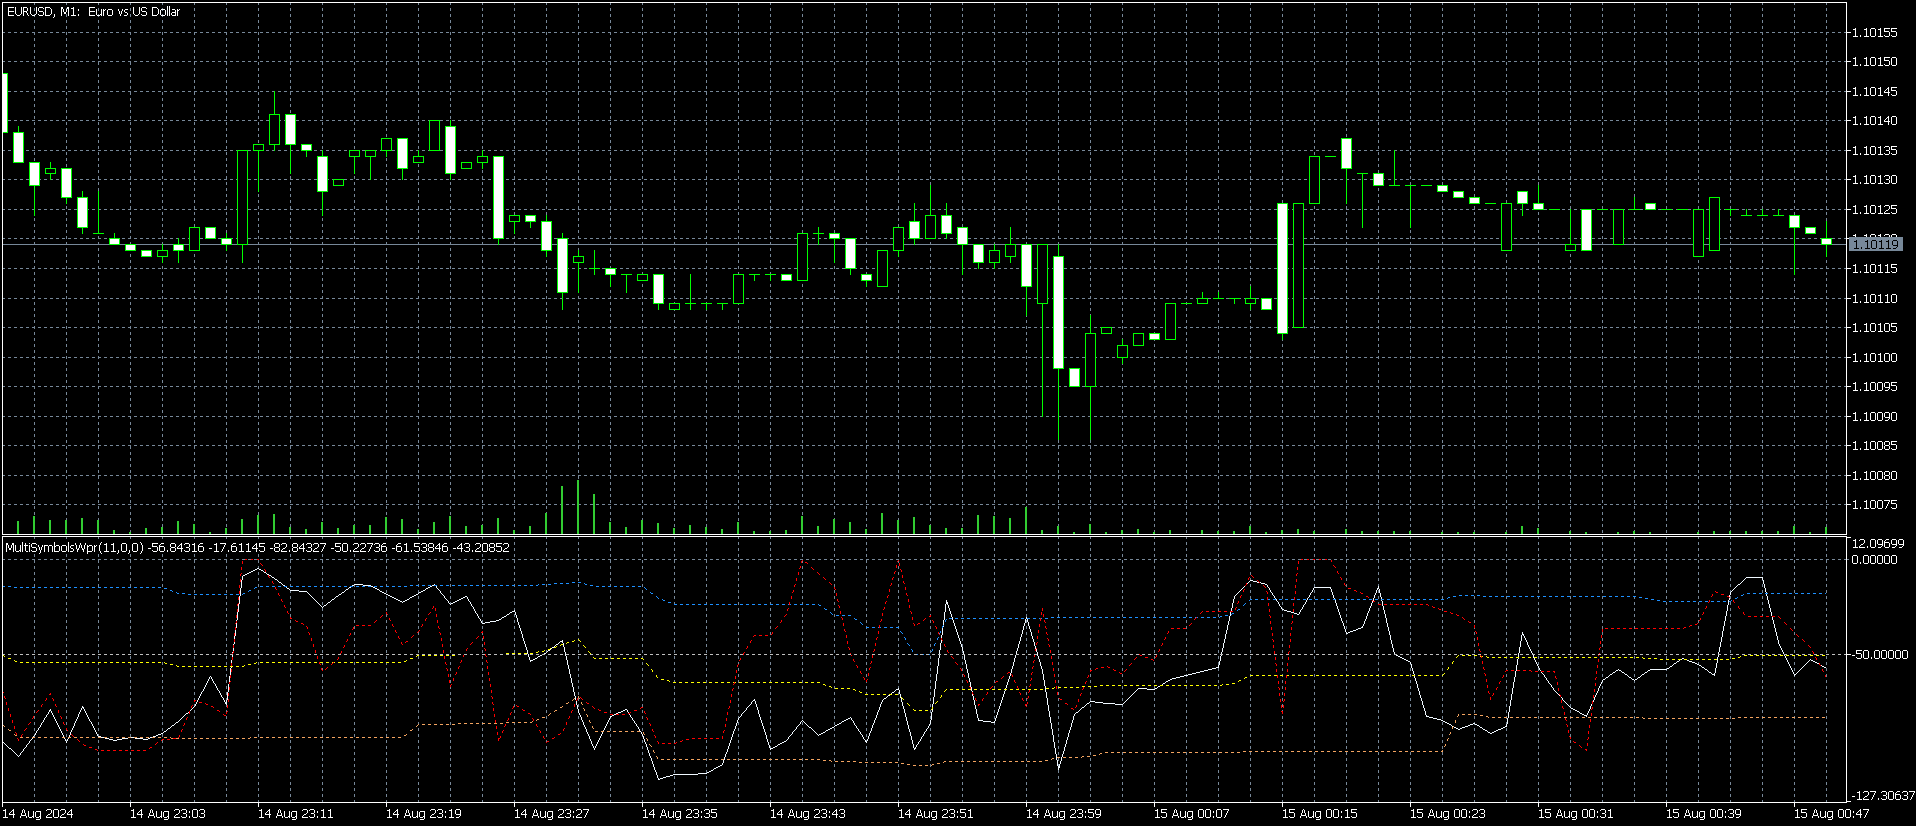
O Indicador foi desenvolvido para a bolsa Brasileira, identificando a relação do Índice com a soma dos principais ativos do IBOV, também funciona para qualquer mercado do mundo, possui um oscilador WPR com a soma dos principais ativos escolhidos, indicando a antecipação do movimento em relação ao Índice.

Características

  • WPR com a soma dos papéis escolhidos - branco
  • WPR do papel atual - vermelho
  • Canal de Tendência

O indicador pode indicar movimento de entradas, sendo:

  • cruzamento das linhas
  • cruzamento da linha Multi Symbols no -50
  • cruzamento entre os canais de máximas e mínimas
  • divergência das linhas

O indicador pode identificar tendência quando quando o canal tiver abaixo ou acima de -50

Copie e cole a lista dos ativos e pesos do Ibovespa e altere como desejar:

PETR4,PETR3,VALE3,WEGE3,ELET3,ABEV3,ITUB4,B3SA3,BBDC4,BBAS3,BPAC11,GGBR4,HAPV3,ITSA4,JBSS3,RENT3,PRIO3,RADL3,RAIL3

6.69,4.92,13,2.23,3.73,3.32,6.77,4.17,3.43,1.8,1.616,1.175,2.35,1,2.49,1.45,1.6,1.3,1.65

Se você tiver alguma dúvida ou dificuldade, por favor, envie-me uma mensagem privada.


Prodotti consigliati
Cybertrade Keltner Channels
Emanuel Andriato
4.75 (4)
Cybertrade Keltner Channels - MT5 Created by Chester Keltner, this is a volatility indicator used by technical analysis. It is possible to follow the trend of financial asset prices and generate support and resistance patterns. In addition, envelopes are a way of tracking volatility in order to identify opportunities to buy and sell these assets. It works on periods longer than the period visible on the chart. All values ​​are available in the form of buffers to simplify possible automations.
FREE
Quantitative Candlesticks Qstick
Flavio Javier Jarabeck
4 (3)
Qstick is a way to objectively quantify candlestick analysis and improve the interpretation of candlestick patterns. Qstick was developed by Tushar Chande and published in his book " The New Technical Trader - Boost Your Profit by Plugging Into the Latest Indicators (1994) ". Qstick is built based on a moving average of the difference between the Open and Close prices. The basis of the idea is that the Opening and Closing prices are the heart of candlestick analysis. We strongly recommend the re
FREE
Functional in the Forex market. Functional in the B3 market - Bolsa Brasil Balcão. Motivation The technical Fibonacci retraction indicator for many is essential and the basis for all market movement forecasts. The name of the tool comes from the Italian mathematician Leonardo de Pisa (13th century). This DEMO version will work in Meta Trader with Demo and Strategy Tester. To purchase the Full version that works on a Real account, click on: https://www.mql5.com/en/market/product/38089
FREE
Donchian Pro
Paulo Henrique Faquineli Garcia
5 (2)
The Donchian Channel Channels are among the most popular tools of technical analysis, as they visually convey to the analyst the limits within which most price movement tends to occur. Channel users know that valuable information can be obtained at any time, whether prices are in the central region of a band or close to one of the border lines. One of the best known techniques to explore these concepts is Bollinger Bands. However, John Bollinger was not the only one to research the applicatio
FREE
Bollinger colorido
Sergio Domingues
5 (1)
Funciona como bandas de bollinger normais. Criado por Joe Ross, é um setup de maior risco por ser contra-tendência. Pode ser usado para Day Trade, Swing Trade e Position. Para identificar, é necessário inserir no gráfico as Bandas de Bollinger, com uma Média Móvel Simples de 20 períodos e largura (desvio) 2. Verifica-se um fechamento de determinado candle abaixo da banda inferior de Bollinger. Se o próximo candle fechar dentro das Bandas, marca-se a máxima dele. O rompimento dessa máxima será o
FREE
FT ADX Color Candles
FELIPE MISAEL MORAES KRUGER
4.86 (7)
Trading can be quite tiring when you need to look at several things at the same time. Format of candles, supports, resistances, schedules, news and indicators. This tool aims to facilitate the analysis of the ADX indicator. It colors the candles based on the levels of the indicator and the DI lines. The period, the limit of the indicator and the colors of the candles are customizable. You can also place a visual aid on the lower right side of the graph to view the values of ADX, DI + and
FREE
Quarter EMA
Jithin Sajan Sajan
5 (1)
Kindly rate and comment about the product for upgradation & Support The 5 EMA is plotted in green color ( Lime ). The 14 EMA is plotted in red color ( Red ). The 20 EMA is plotted in blue color ( Blue ). The 200 EMA is plotted in yellow color ( Yellow ). The Quarter EMA that provided calculates and plots four Exponential Moving Averages (EMAs) on the chart using different periods: 5, 14, 20, and 200. Each EMA is represented by a different color on the chart. Here's a description of each
FREE
Quintet EMA
Jithin Sajan Sajan
Kindly rate and comment about the product for upgradation & Support The   5 EMA   is plotted in   green   color ( Lime ). The  14 EMA  is plotted in  red  color ( Red ). The   20 EMA   is plotted in   blue   color ( Blue ). The  200 EMA  is plotted in  black  color ( Black ). The   200 EMA   is plotted in   yellow   color ( Yellow ). The Quarter EMA that provided calculates and plots four Exponential Moving Averages (EMAs) on the chart using different periods: 5, 14, 20, and 200. Each EMA
FREE
Rejection Zones
Paulo Henrique Faquineli Garcia
Este poderoso indicador analisa o gráfico e mostra zonas de Rejeição de Preços! Isto é, locais onde o preço foi, mas não foi aceito pelo mercado! A visualização desta zona de Rejeição, facilita o entendimento do trader na tomada de decisões de onde operar e como operar! O indicador é composto por 4 linhas, sendo classificadas em 2 grupos: Linhas Vermelha e Amarela: Denotam os extremos onde o preço conseguiu chegar, mas não foi aceito! Linhas Laranja e Azul: A partir delas, denotam o Início da
FREE
Supports And Resistances Lines
Francisco Gomes Da Silva
4.76 (41)
Indicatore zone di supporto e resistenza MT5 questo indicatore sa come identificare automaticamente massimi e minimi. Questo indicatore di supporto e resistenza crea linee di supporto e linee di resistenza basate su massimi e minimi. come creare linee di supporto e resistenza. questo è un indicatore per creare linee automatiche di supporto e resistenza. come trovare il livello di supporto con l'indicatore. questo indicatore trova i massimi e i minimi automaticamente. L'indicatore crea automatica
FREE
Spike Catch Pro
Amani Fungo
4 (6)
Spike Catch Pro 22:03 release updates Advanced engine for searching trade entries in all Boom and Crash pairs (300,500 and 1000) Programmed strategies improvements Mx_Spikes (to combine Mxd,Mxc and Mxe), Tx_Spikes,   RegularSpikes,   Litho_System,   Dx_System,   Md_System,   MaCross,   Omx_Entry(OP),  Atx1_Spikes(OP),   Oxc_Retracement (AT),M_PullBack(AT) we have added an arrow on strategy identification, this will help also in the visual manual backtesting of the included strategies and see h
FREE
Graphic Alignment Context
Ricardo Alexandre Laurentino
The Graphic Alignment Context (GAC) Technical Indicator measures the vertical difference of the simple average price of a financial instrument in the context of three different timeframes determined by a defined number of bars or candles (periods) to determine the strength of the buy or sell trend. sale. Ascending average prices indicate Buying strength (1), Descending average prices indicate Selling strength (-1) and any scenario different from the previous two conditions indicates Neutrality
FREE
Free automatic Fibonacci is an indicator that automatically plots a Fibonacci retracement based on the number of bars you select on the BarsToScan setting in the indicator. The Fibonacci is automatically updated in real time as new highest and lowest values appears amongst the selected bars. You can select which level values to be displayed in the indicator settings. You can also select the color of the levels thus enabling the trader to be able to attach the indicator several times with differe
FREE
Bollinger Clouds
Samuel Manoel De Souza
The Indicator indicator draws 2 clouds based on Bollinger Bands indicator values. The upper cloud is formed by the upper lines values and the lower cloud by the lowers lines values. The indicator allows to change the Bollinger Bands parameters and the clouds colors the period of the base line and the deviations of each Bollinger Bands instance. The indicator holds 5 buffer index as follow: [0] - Outer values of the upper cloud [1]  - Inner values of the upper cloud [2]  - Base/Center line values
FREE
No Wick On Close
Flavio Javier Jarabeck
5 (1)
We at Minions Labs love to study, challenge and discover new facts about Price Behavior in current markets. We would NOT call it Price Action because today this is a word totally overused and means, thanks to the False Prophets out there, absolutely NOTHING. The study hypothesis we propose is this: Some Assets, in certain Timeframes, present a behavior of Price continuity when the candlesticks close without a Wick on them... So the purpose of this indicator is to "color" those candlesticks wh
FREE
Weis Waves
Flavio Javier Jarabeck
3.15 (26)
The original author is David Weis, an expert in the Wyckoff Method. The Weis Wave is a modern adaptation of the 1930's Wyckoff Method, another expert in Tape Reading techniques and Chart Analysis. Weis Waves takes market volume and stacks it into waves according to price conditions giving the trader valuable insights about the market conditions. If you want to learn more about this subject you can find tons of videos in YouTube. Just look for "The Wickoff Method", "Weis Wave" and "Volume Spread
FREE
TilsonT3
Jonathan Pereira
Tillson's T3 moving average was introduced to the world of technical analysis in the article ''A Better Moving Average'', published in the American magazine Technical Analysis of Stock Commodities. Developed by Tim Tillson, analysts and traders of futures markets soon became fascinated with this technique that smoothes the price series while decreasing the lag (lag) typical of trend-following systems.
FREE
WH Price Wave Pattern MT5
Wissam Hussein
3.7 (10)
Benvenuto nel nostro   modello di ondata di prezzo   MT5 --(modello ABCD)-- Il modello ABCD è un modello di trading potente e ampiamente utilizzato nel mondo dell'analisi tecnica. È un modello di prezzo armonico che i trader utilizzano per identificare potenziali opportunità di acquisto e vendita sul mercato. Con il modello ABCD, i trader possono anticipare potenziali movimenti di prezzo e prendere decisioni informate su quando entrare e uscire dalle negoziazioni. Versione EA:   Price Wave E
FREE
Market Momentum
Flavio Javier Jarabeck
3.86 (7)
The Market Momentum indicator is based on the Volume Zone Oscillator (VZO), presented by Waleed Aly Khalil in the 2009 edition of the International Federation of Technical Analysts journal, and presents a fresh view of this market valuable data that is oftenly misunderstood and neglected: VOLUME. With this new approach of "seeing" Volume data, traders can infer more properly market behavior and increase their odds in a winning trade. "The VZO is a leading volume oscillator; its basic usefulnes
FREE
Santa Donchian
Marco Aurelio Cestari
4.17 (6)
Santa Donchian Indicator  is an efficient way to detect support, resistence and break outs in any market. The Donchian channel measures the high and the low of a previously defined range.  Typically, a trader would look for a well-defined range and then wait for the price to break out to either one side for a trade entry trigger. Advantages Never repaints, never backpaints, never recalculates. Works in all symbols and all timeframes. Perfect trend filter for any strategy or expert advisor. Fu
FREE
Reversal Composite Candles
MetaQuotes Ltd.
3.5 (24)
The idea of the system is to indentify the reversal patterns using the calculation of the composite candle. The reversal patterns is similar to the "Hammer" and "Hanging Man" patterns in Japanese candlestick analysis. But it uses the composite candle instead the single candle and doesn't need the small body of the composite candle to confirm the reversal. Input parameters: Range - maximal number of bars, used in the calculation of the composite candle. Minimum - minimal size of the composite can
FREE
MIDAS Super VWAP
Flavio Javier Jarabeck
4.29 (14)
Imagine VWAP, MVWAP and MIDAS in one place... Well, you found it! Now you can track the movement of Big Players in various ways, as they in general pursue the benchmarks related to this measuring, gauging if they had good execution or poor execution on their orders. Traders and analysts use the VWAP to eliminate the noise that occurs throughout the day, so they can measure what prices buyers and sellers are really trading. VWAP gives traders insight into how a stock trades for that day and deter
FREE
Value Chart Candlesticks
Flavio Javier Jarabeck
4.7 (10)
The idea of a Value Chart indicator was presented in the very good book I read back in 2020 , " Dynamic Trading Indicators: Winning with Value Charts and Price Action Profile ", from the authors Mark Helweg and David Stendahl. The idea is simple and the result is pure genius: Present candlestick Price analysis in a detrended way! HOW TO READ THIS INDICATOR Look for Overbought and Oversold levels. Of course, you will need to test the settings a lot to find the "correct" one for your approach.
FREE
Wave Box Market Frenquency
Jean Jacques Huve Ribeiro
4.83 (6)
Totally linked to the result of a movement and the duration he had. Its height records how many ticks the asset walked during a given movement, its width shows us the duration that movement had. Its configuration must be in line with the Weis Wave Indicator configuration to observe the movement force and can indicate a possible accumulation or distribution of the movement;
FREE
Pivot Point Fibo RSJ è un indicatore che traccia le linee di supporto e resistenza del giorno utilizzando i tassi di Fibonacci. Questo spettacolare indicatore crea fino a 7 livelli di supporto e resistenza tramite Pivot Point utilizzando i tassi di Fibonacci. È fantastico come i prezzi rispettino ogni livello di questo supporto e resistenza, dove è possibile percepire possibili punti di entrata/uscita di un'operazione. Caratteristiche Fino a 7 livelli di supporto e 7 livelli di resistenza
FREE
This indicator sums up the difference between the sells aggression and the buys aggression that occurred in each Candle, graphically plotting the waves of accumulation of the aggression volumes.   Through these waves an exponential average is calculated that indicates the direction of the business flow. Note: This indicator DOES NOT WORK for Brokers and/or Markets WITHOUT the type of aggression (BUY or SELL).   Be sure to try our Professional version with configurable features and alerts:  Agr
FREE
This is  RSI with alarm and push notification  -is a indicator based on the popular Relative Strength Index (RSI) indicator with Moving Average and you can use it in Forex, Crypto, Traditional, Indices, Commodities. You can change colors to see how it fits you. Back test it, and find what works best for you. This product is an oscillator with dynamic overbought and oversold levels, while in the standard RSI, these levels are static and do not change. This allows  RSI with alarm and push notific
FREE
QuantumAlert Stoch Navigator is a free indicator available for MT4/MT5 platforms, its work is to provide "alerts" when the market is inside "overbought and oversold" regions in the form of "buy or sell" signals. This indicator comes with many customization options mentioned in the parameter section below, user can customise these parameters as needful. Join our   MQL5 group , where we share important news and updates. You are also welcome to join our private channel as well, contact me for the p
FREE
Economic Markers
Flavio Javier Jarabeck
4.83 (18)
Easily get all relevant economic events of the current day right into your chart, as markers. Filter what kind of markers do you want: by country (selected individually) and by Importance (High relevance, Medium, Low or any combination of these). Configure the visual cues to your liking. If there is more than one event set to the very same time, their Names will be stacked and you will see the messages merged with the plus (+) sign on the marker. Obviously that long or too much events on the sam
FREE
Force Numbers
Flavio Javier Jarabeck
Several assets in several markets have the behavior of using specific numbers as Force Numbers, where support, resistance and price thrust is created. Let this indicator draw those levels of support and resistance for you. You can also stack it to show different level of Prices! This technique is being used by Tape Readers and Order Flow traders all over the world for a long time. Give it a try. Challenge yourself to study new ways of Price Action! SETTINGS What Price reference to use in th
FREE
Gli utenti di questo prodotto hanno anche acquistato
Atomic Analyst MT5
Issam Kassas
4.79 (19)
Innanzitutto, vale la pena sottolineare che questo indicatore di trading non è repaint, non è ridisegno e non presenta ritardi, il che lo rende ideale sia per il trading manuale che per quello automatico. Manuale utente: impostazioni, input e strategia. L'Analista Atomico è un indicatore di azione del prezzo PA che utilizza la forza e il momentum del prezzo per trovare un miglior vantaggio sul mercato. Dotato di filtri avanzati che aiutano a rimuovere rumori e segnali falsi, e aumentare il pote
Innanzitutto è importante sottolineare che questo sistema di trading è un indicatore Non-Repainting, Non-Redrawing e Non-Lagging, il che lo rende ideale sia per il trading manuale che per quello automatico. Corso online, manuale e download di preset. Il "Sistema di Trading Smart Trend MT5" è una soluzione completa pensata sia per i trader principianti che per quelli esperti. Combina oltre 10 indicatori premium e offre più di 7 robuste strategie di trading, rendendolo una scelta versatile per div
Gold Stuff mt5
Vasiliy Strukov
4.9 (182)
Gold Stuff mt5 è un indicatore di tendenza progettato specificamente per l'oro e può essere utilizzato anche su qualsiasi strumento finanziario. L'indicatore non ridisegna e non è in ritardo. Periodo consigliato H1. Contattami subito dopo l'acquisto per avere le impostazioni e un bonus personale!   I risultati in tempo reale possono essere visualizzati qui.  Puoi ottenere una copia gratuita del nostro indicatore Strong Support e Trend Scanner, per favore scrivi in ​​privato. M   IMPOSTAZION
Quantum Trend Sniper
Bogdan Ion Puscasu
4.92 (48)
Presentazione       Quantum Trend Sniper Indicator   , l'innovativo indicatore MQL5 che sta trasformando il modo in cui identifichi e scambi le inversioni di tendenza! Sviluppato da un team di trader esperti con un'esperienza di trading di oltre 13 anni,       Indicatore Quantum Trend Sniper       è progettato per spingere il tuo viaggio di trading verso nuove vette con il suo modo innovativo di identificare le inversioni di tendenza con una precisione estremamente elevata. *** Acquista Quant
TPSproTREND PrO MT5
Roman Podpora
4.89 (9)
TPSpro TREND PRO  - is a trend indicator that automatically analyzes the market and provides information about the trend and each of its changes, as well as giving signals for entering trades without redrawing! The indicator uses each candle, analyzing them separately. referring to different impulses - up or down impulse. Exact entry points into transactions for currencies, crypto, metals, stocks, indices!  Version MT4               DETAILED DESCRIPTION               R ecommended to use with an
TPSpro RFI Levels MT5
Roman Podpora
4.67 (9)
Reversal First Impulse levels (RFI)      INSTRUCTIONS        RUS       -       ENG              R ecommended to use with an indicator   -   TPSpro  TREND PRO -  Version MT4                 A key element in trading is zones or levels from which decisions to buy or sell a trading instrument are made. Despite attempts by major players to conceal their presence in the market, they inevitably leave traces. Our task was to learn how to identify these traces and interpret them correctly. Main functi
Trend Screener Pro MT5
STE S.S.COMPANY
4.88 (67)
Indicatore di tendenza, soluzione unica rivoluzionaria per il trading di tendenze e il filtraggio con tutte le importanti funzionalità di tendenza integrate in un unico strumento! È un indicatore multi-timeframe e multi-valuta al 100% non ridipingibile che può essere utilizzato su tutti i simboli/strumenti: forex, materie prime, criptovalute, indici e azioni. Trend Screener è un indicatore di tendenza che segue un indicatore efficiente che fornisce segnali di tendenza a freccia con punti nel gra
Atbot
Zaha Feiz
4.92 (13)
AtBot:  Come funziona e come usarlo ### Come funziona L'indicatore "AtBot" per la piattaforma MT5 genera segnali di acquisto e vendita utilizzando una combinazione di strumenti di analisi tecnica. Integra la Media Mobile Semplice (SMA), la Media Mobile Esponenziale (EMA) e l'indice di Gamma Vero Medio (ATR) per identificare opportunità di trading. Inoltre, può utilizzare le candele Heikin Ashi per migliorare la precisione dei segnali. Lascia una recensione dopo l'acquisto e ricevi un regalo bon
FX Power MT5 NG
Daniel Stein
5 (6)
Ricevi il tuo aggiornamento quotidiano sul mercato con dettagli e schermate tramite il nostro Morning Briefing qui su mql5 e su Telegram ! FX Power MT5 NG è la nuova generazione del nostro popolare misuratore di forza delle valute, FX Power. Cosa offre questo misuratore di forza di nuova generazione? Tutto ciò che avete amato dell'FX Power originale IN PIÙ Analisi della forza di ORO/XAU Risultati di calcolo ancora più precisi Periodi di analisi configurabili individualmente Limite di calcolo pe
Innanzitutto, vale la pena sottolineare che questo Strumento di Trading è un Indicatore Non-Ridipingente, Non-Ridisegnante e Non-Laggante, il che lo rende ideale per il trading professionale. Corso online, manuale utente e demo. L'Indicatore Smart Price Action Concepts è uno strumento molto potente sia per i nuovi che per i trader esperti. Racchiude più di 20 utili indicatori in uno solo, combinando idee di trading avanzate come l'Analisi del Trader del Circolo Interno e le Strategie di Trad
IX Power MT5
Daniel Stein
4.17 (6)
IX Power   porta finalmente l'imbattibile precisione di FX Power ai simboli non-Forex. Determina con precisione l'intensità delle tendenze a breve, medio e lungo termine dei vostri indici preferiti, azioni, materie prime, ETF e persino criptovalute. Potete   analizzare tutto ciò che   il vostro terminale ha da offrire. Provatelo e sperimentate come   il vostro tempismo migliori significativamente   durante il trading. Caratteristiche principali di IX Power Risultati di calcolo precisi al
ICT, SMC, SMART MONEY CONCEPTS, SMART MONEY, Smart Money Concept, Support and Resistance, Trend Analysis, Price Action, Market Structure, Order Blocks, BOS/CHoCH,   Breaker Blocks ,  Momentum Shift,   Supply&Demand Zone/Order Blocks , Strong Imbalance,   HH/LL/HL/LH,    Fair Value Gap, FVG,  Premium  &   Discount   Zones, Fibonacci Retracement, OTE, Buy Side Liquidity, Sell Side Liquidity, BSL/SSL Taken, Equal Highs & Lows, MTF Dashboard, Multiple Time Frame, BigBar, HTF OB, HTF Market Structure
Automated Trendlines MT5
Georgios Kalomoiropoulos
Le linee di tendenza sono lo strumento più essenziale di analisi tecnica nel forex trading. Sfortunatamente, la maggior parte dei trader non li disegna correttamente. L'indicatore automatizzato delle linee di tendenza è uno strumento professionale per i trader seri che ti aiuta a visualizzare il movimento di tendenza dei mercati. Esistono due tipi di linee di tendenza, linee di tendenza rialziste e linee di tendenza ribassiste. Nella tendenza rialzista, la linea di tendenza Forex viene t
Gartley Hunter Multi
Siarhei Vashchylka
5 (8)
Gartley Hunter Multi - An indicator for searching for harmonic patterns simultaneously on dozens of trading instruments and on all possible timeframes. Manual (Be sure to read before purchasing) | Version for MT4 Advantages 1. Patterns: Gartley, Butterfly, Shark, Crab. Bat, Alternate Bat, Deep Crab, Cypher 2. Simultaneous search for patterns on dozens of trading instruments and on all possible timeframes 3. Search for patterns of all possible sizes. From the smallest to the largest 4. A
Ora $ 147 (aumentando a $ 499 dopo alcuni aggiornamenti) - account illimitati (PC o MAC) Manuale utente di RelicusRoad + Video di formazione + Accesso al gruppo Discord privato + Stato VIP UN NUOVO MODO DI GUARDARE IL MERCATO RelicusRoad è l'indicatore di trading più potente al mondo per forex, futures, criptovalute, azioni e indici, fornendo ai trader tutte le informazioni e gli strumenti di cui hanno bisogno per rimanere redditizi. Forniamo analisi tecniche e piani di trading per aiutar
Advanced Supply Demand MT5
Bernhard Schweigert
4.53 (15)
La migliore soluzione per qualsiasi principiante o trader esperto! Questo indicatore è uno strumento di trading unico, di alta qualità e conveniente perché abbiamo incorporato una serie di funzionalità proprietarie e una nuova formula. Con questo aggiornamento, sarai in grado di mostrare fusi orari doppi. Non solo potrai mostrare una TF più alta, ma anche entrambe, la TF del grafico, PIÙ la TF più alta: SHOWING NESTED ZONES. Tutti i trader di domanda di offerta lo adoreranno. :) Informazioni imp
XQ Indicator MetaTrader 5
Marzena Maria Szmit
5 (1)
Step into the realm of Forex trading with confidence and precision using XQ, a cutting-edge Forex indicator designed to elevate your trading game to unprecedented heights. Whether you're a seasoned trader or just stepping into the world of currency exchange, XQ Forex Indicator empowers you with the insights and signals needed to make informed trading decisions. The signal conditions are a combination of three indicators, and XQ Forex Indicator only display  medium and long-term trends . The ind
Blahtech Supply Demand MT5
Blahtech Limited
4.54 (13)
Was: $299  Now: $99   Supply Demand uses previous price action to identify potential imbalances between buyers and sellers. The key is to identify the better odds zones, not just the untouched ones. Blahtech Supply Demand indicator delivers functionality previously unavailable on any trading platform. This 4-in-1 indicator not only highlights the higher probability zones using a multi-criteria strength engine, but also combines it with multi-timeframe trend analysis, previously confirmed swings
Introduction to X3 Chart Pattern Scanner X3 Cherart Pattern Scanner is the non-repainting and non-lagging indicator detecting X3 chart patterns including Harmonic pattern, Elliott Wave pattern, X3 patterns, and Japanese Candlestick patterns. Historical patterns match with signal patterns. Hence, you can readily develop the solid trading strategy in your chart. More importantly, this superb pattern scanner can detect the optimal pattern of its kind. In addition, you can switch on and off individu
Questo cruscotto mostra gli ultimi   pattern armonici   disponibili per i simboli selezionati, in modo da risparmiare tempo ed essere più efficienti /   versione MT4 . Indicatore gratuito:   Basic Harmonic Pattern Colonne dell'indicatore Symbol :   vengono visualizzati i simboli selezionati Trend:   rialzista o ribassista Pattern:   tipo di pattern (gartley, butterfly, bat, crab, shark, cypher o ABCD) Entry:   prezzo di ingresso SL:   prezzo di stop loss TP1:   1 prezzo di take profit TP
Order Block Hunter MT5
Noha Mohamed Fathy Younes Badr
5 (1)
Order block hunter indicator is the best indicator for  hunt the order blocks that area where there has been a large concentration of limit orders waiting to be executed Order blocks are identified on a chart by observing previous price action and looking for areas where the price experienced significant movement or sudden changes in direction .This indicator does that for you by using very complicated codes and helps you to take the best areas To buy and sell because it make marks at the best a
AT Forex Indicator MT5
Marzena Maria Szmit
5 (4)
The AT Forex Indicator MT5 is a sophisticated trading tool designed to provide traders with a comprehensive analysis of multiple currency pairs. This powerful indicator simplifies the complex nature of the forex market, making it accessible for both novice and experienced traders. AT Forex Indicator uses advanced algorithms to detect trends, patterns and is an essential tool for traders aiming to enhance their forex trading performance. With its robust features, ease of use, and reliable signal
Easy By Sell is a market indicator for opening and closing positions. It becomes easy to track market entries with alerts. It indicates trend reversal points when a price reaches extreme values ​​and the most favorable time to enter the market. it is as effective as a Fibonacci to find a level but it uses different tools such as an algorithm based on ATR indicators and Stochastic Oscillator. You can modify these two parameters as you wish to adapt the settings to the desired period. My othe
Top indicator for MT5   providing accurate signals to enter a trade without repainting! It can be applied to any financial assets:   forex, cryptocurrencies, metals, stocks, indices .  Watch  the video  (6:22) with an example of processing only one signal that paid off the indicator! MT4 version is here It will provide pretty accurate trading signals and tell you when it's best to open a trade and close it. Most traders improve their trading results during the first trading week with the help of
AW Trend Predictor MT5
AW Trading Software Limited
4.78 (58)
La combinazione di trend e livelli di rottura in un unico sistema. Un algoritmo di indicatore avanzato filtra il rumore del mercato, determina la tendenza, i punti di ingresso e i possibili livelli di uscita. I segnali indicatori sono registrati in un modulo statistico, che permette di selezionare gli strumenti più adatti, mostrando l'efficacia dello storico dei segnali. L'indicatore calcola i segni Take Profit e Stop Loss. Manuale e istruzioni ->   QUI   / versione MT4 ->   QUI Come fare tradi
FX Volume MT5
Daniel Stein
4.94 (17)
Ricevi il tuo aggiornamento quotidiano sul mercato con dettagli e schermate tramite il nostro Morning Briefing qui su mql5 e su Telegram ! FX Volume è il PRIMO e UNICO indicatore di volume che fornisce una visione REALE del sentiment del mercato dal punto di vista del broker. Fornisce informazioni straordinarie su come gli operatori di mercato istituzionali, come i broker, sono posizionati sul mercato Forex, molto più velocemente dei rapporti COT. Vedere queste informazioni direttamente sul vo
FX Trend MT5
Daniel Stein
4.68 (37)
Vuoi diventare un trader forex a 5 stelle costantemente redditizio? 1.   Leggi la descrizione di base del nostro semplice   sistema di   trading   e il  suo importante aggiornamento della strategia nel 2020 2.   Invia uno screenshot del tuo acquisto per ottenere il tuo invito personale alla nostra esclusiva chat di trading FX Trend   mostra la direzione della tendenza, la durata, l'intensità e la valutazione della tendenza risultante per tutti i time frame in tempo reale. Vedrai a colpo d'occ
Auto Order Block with break of structure based on ICT and Smart Money Concepts (SMC) Futures Break of Structure ( BoS )             Order block ( OB )            Higher time frame Order block / Point of Interest ( POI )    shown on current chart           Fair value Gap ( FVG ) / Imbalance   -  MTF      ( Multi Time Frame )    HH/LL/HL/LH  -  MTF      ( Multi Time Frame )  Choch  MTF      ( Multi Time Frame )  Volume Imbalance     ,  MTF          vIMB Gap’s Power of 3 Equal High
Presentazione       Quantum Breakout PRO   , l'innovativo indicatore MQL5 che sta trasformando il modo in cui scambi le zone di breakout! Sviluppato da un team di trader esperti con un'esperienza di trading di oltre 13 anni,       Quantum Breakout PRO       è progettato per spingere il tuo viaggio di trading a nuovi livelli con la sua strategia innovativa e dinamica della zona di breakout. Quantum Breakout Indicator ti fornirà frecce di segnalazione sulle zone di breakout con 5 zone target
Trend Forecaster
Alexey Minkov
5 (6)
The Trend Forecaster indicator utilizes a unique proprietary algorithm to determine entry points for a breakout trading strategy. The indicator identifies price clusters, analyzes price movement near levels, and provides a signal when the price breaks through a level. The Trend Forecaster indicator is suitable for all financial assets, including currencies (Forex), metals, stocks, indices, and cryptocurrencies. You can also adjust the indicator to work on any time frames, although it is recommen
Filtro:
Nessuna recensione
Rispondi alla recensione
Versione 1.1 2024.08.15
Otimização.