• Panoramica
  • Recensioni
  • Commenti

Better Volume for MT5

Migliora le Tue Performance di Trading con l'Indicatore "Better Volume"

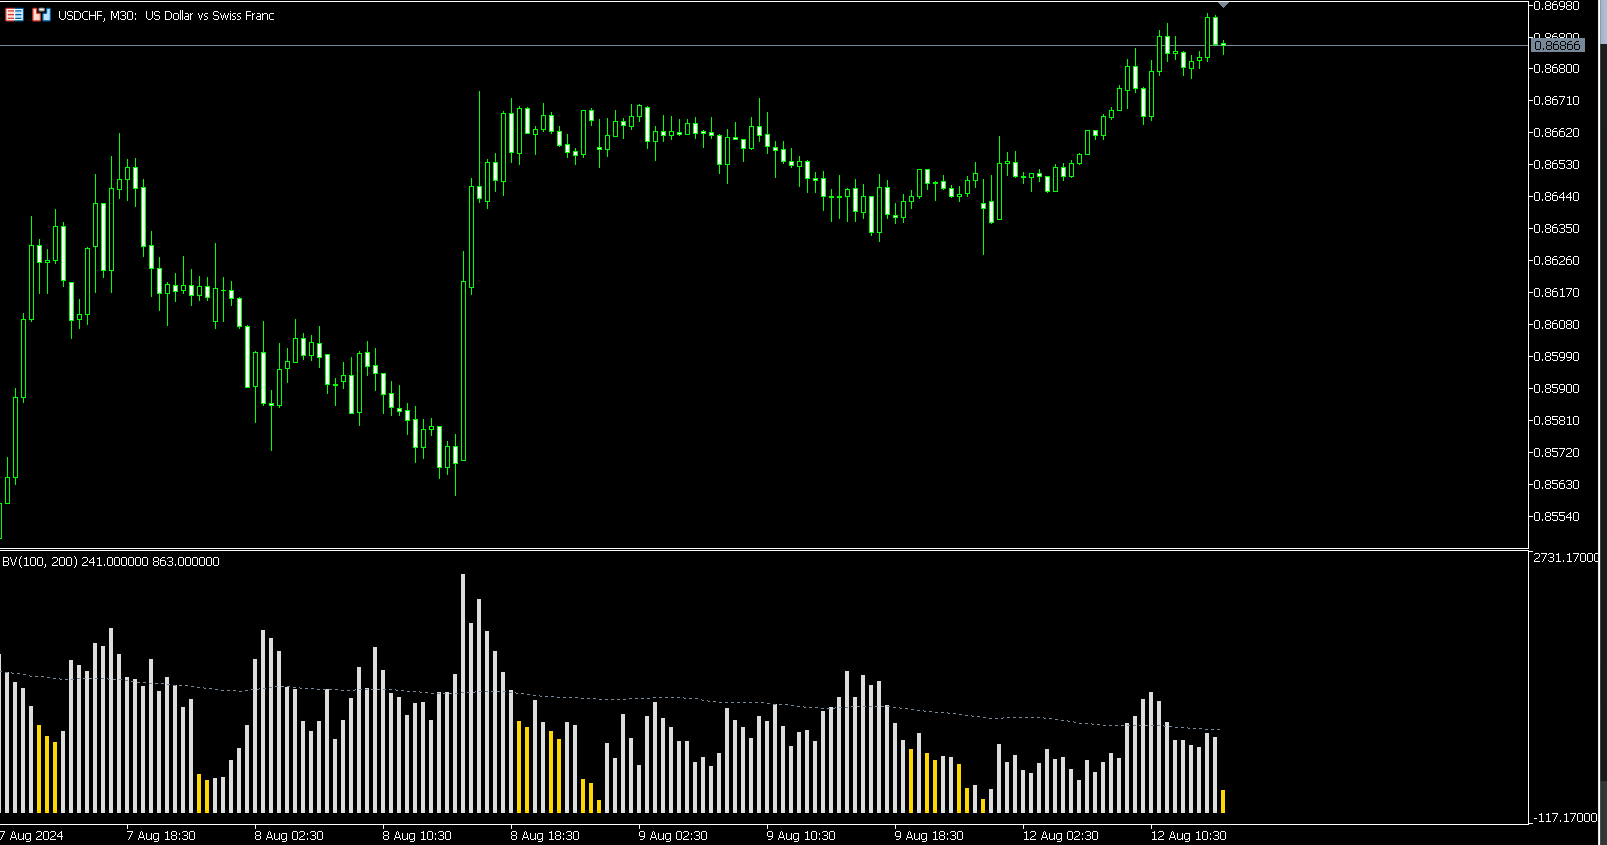
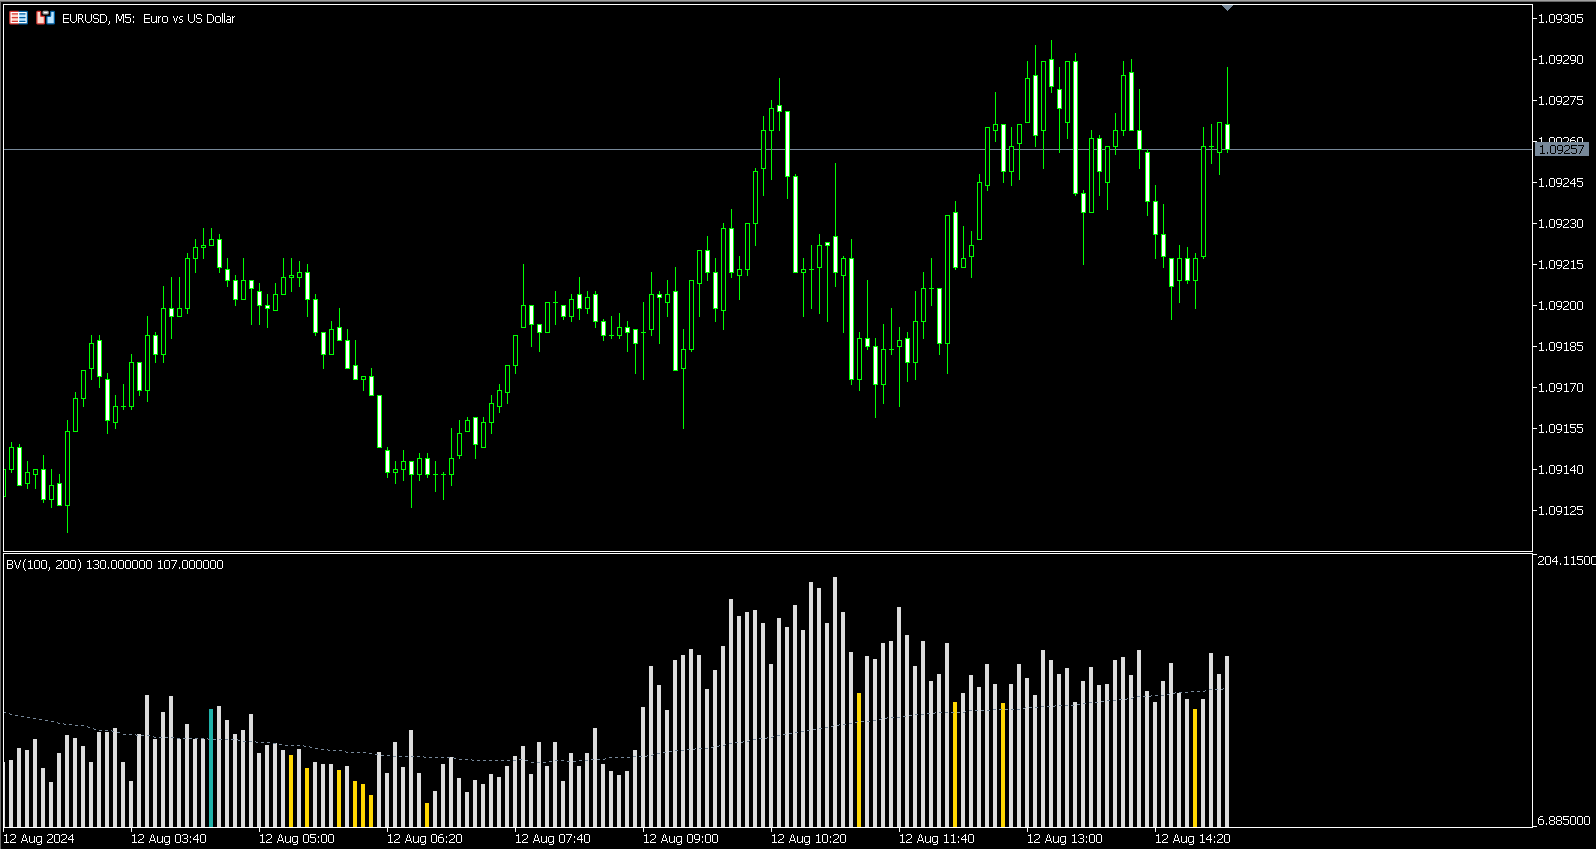
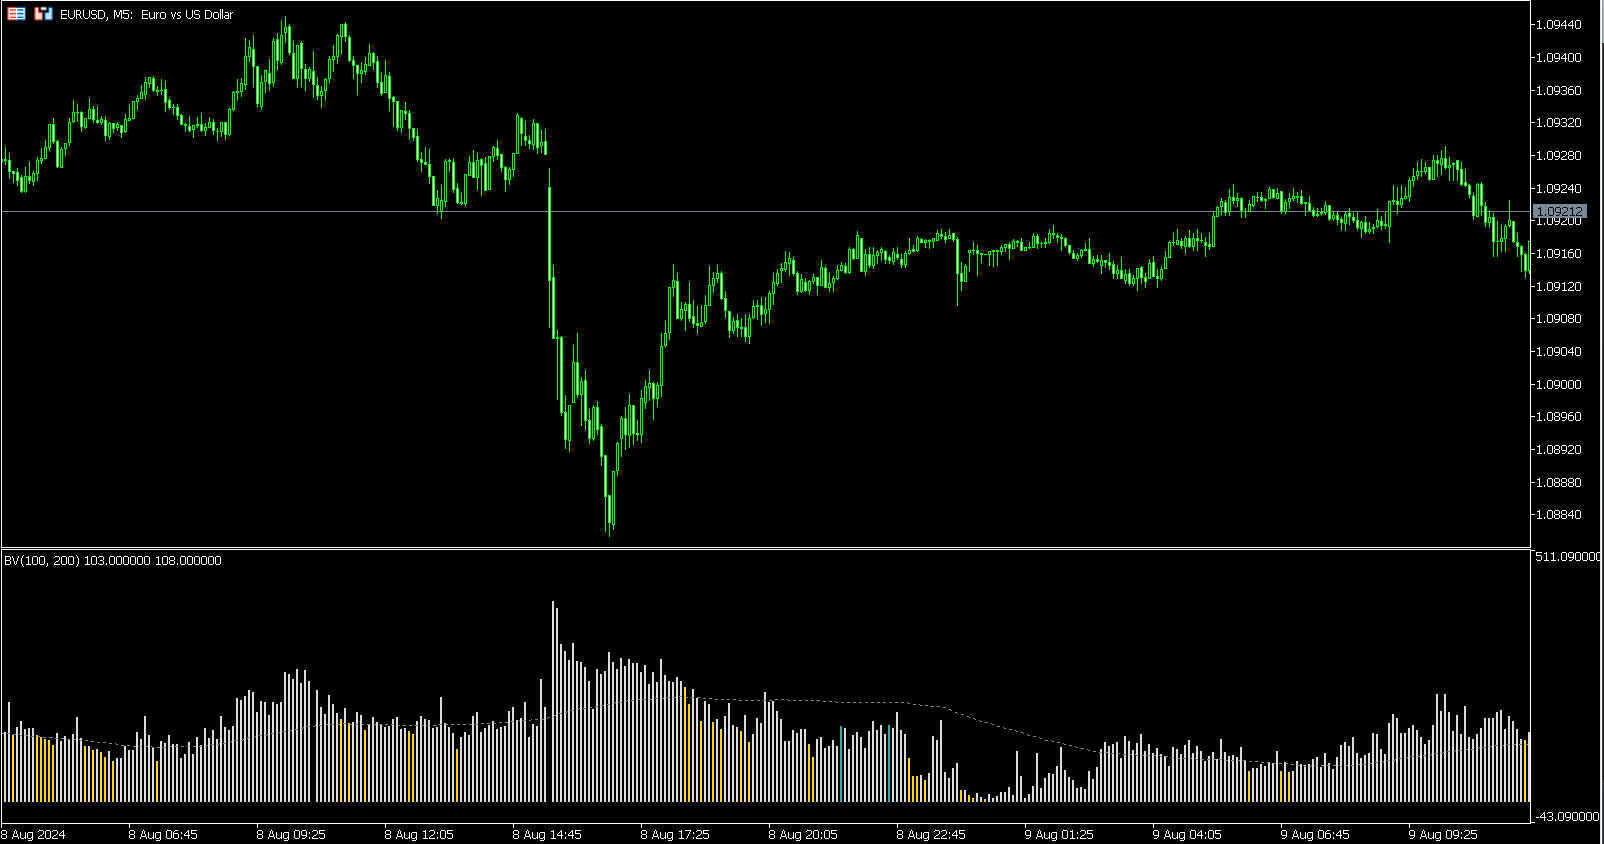
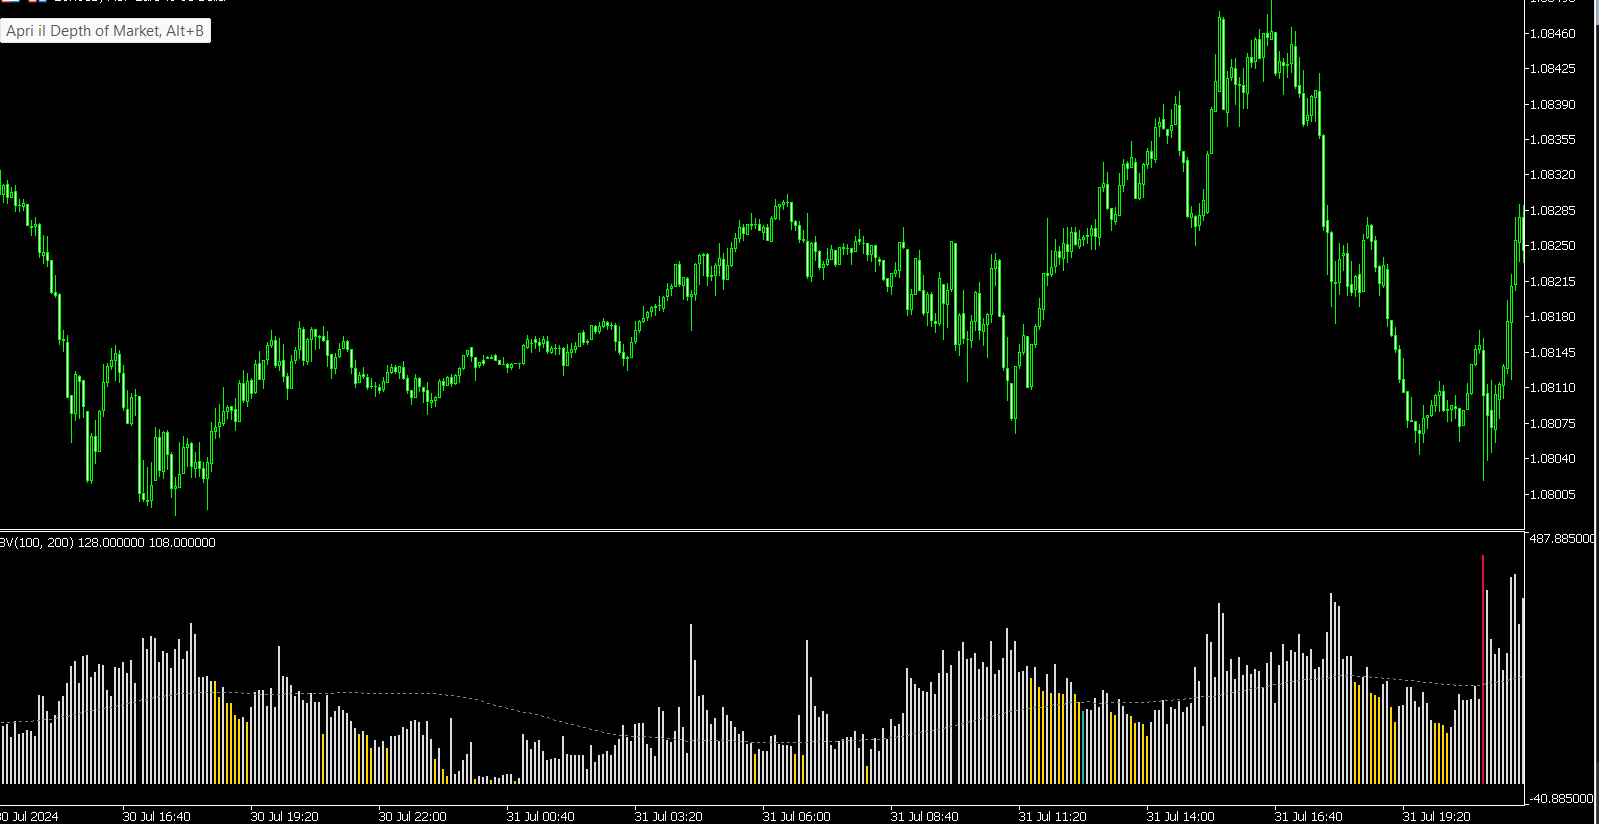
Scopri l'Indicatore "Better Volume": Il "Better Volume" è l'indispensabile strumento di analisi dei volumi di mercato per i trader che desiderano distinguersi. Analizza i volumi dei tick con una precisione senza precedenti, grazie alla sua funzione avanzata di media mobile (PERIOD_MA) e allerte personalizzabili per buy e sell.

Caratteristiche Principali:

  • Analisi Avanzata dei Volumi: Riconosci i picchi di volume che segnalano movimenti di prezzo cruciali.
  • Allerte Intuitive per Buy e Sell: Rimani sempre un passo avanti, con notifiche che ti segnalano le migliori opportunità di trading.
  • Personalizzazione Facile: Adatta l'indicatore alle tue esigenze con input semplici e intuitivi.

Perché "Better Volume"? Con "Better Volume" puoi:

  • Identificare con precisione i momenti migliori per entrare e uscire dal mercato.
  • Aumentare la tua efficacia nel trading grazie a segnali basati su volumi reali.
  • Adattarsi a qualsiasi strategia di trading, grazie alla flessibilità degli input configurabili.

Agisci Ora! Non perdere l'opportunità di migliorare il tuo trading. Visita la nostra pagina su MQL5 e scarica oggi stesso l'indicatore "Better Volume" per iniziare a fare trading con la conoscenza e la sicurezza che meriti!


Prodotti consigliati
MACD ponderato per volume Volume Weighted MACD (VW-MACD) è stato creato da Buff Dormeier e descritto nel suo libro Investing With Volume Analysis. Rappresenta la convergenza e la divergenza delle tendenze dei prezzi ponderate in base al volume. L'inclusione del volume consente al VW-MACD di essere generalmente più reattivo e affidabile rispetto al MACD tradizionale.   Che cos'è il MACD (Moving Average Convergence Divergence)? Moving Average Convergence Divergence è stato creato da Geral
Volume Breakout
Fernando Sanches
One of the Best Volume Indicators, with the addition of a Moving Average for weighting volume over time average. If the "Current Candle" Volume is X% greater than the Moving Average value, we will have a sign of increasing volume. It can be a sign of Beginning, Continuity, Reversal or Exhaustion of the Movement. Fully configurable and all options open, you can color and set ALL values as you see fit. The 'Volume Break' shows volume bars in the same color as the candlestick, in addition
WAPV Weis Wave Chart Forex
Eduardo Da Costa Custodio Santos
Il Weis Wave Chart Forex per MT5 è un indicatore di prezzo e volume. La lettura del prezzo e del volume è stata ampiamente diffusa tramite Richard Demille Wyckoff sulla base delle tre leggi da lui create: offerta e domanda, causa ed effetto e sforzo contro risultato. Già nel 1900 R.Wyckoff utilizzava la carta delle onde nelle sue analisi. Molti anni dopo, intorno al 1990, David Weis ha automatizzato il diagramma delle onde di R. Wyckoff e oggi vi portiamo l'evoluzione del diagramma delle onde di
Description The indicator uses market profile theory to show the most relevant trading zones, on a daily basis. The zones to be shown are LVN (low volume nodes) and POC (point of control). An LVN zone is one which represents price areas with the least time or volume throughout the day. Typically, these areas indicate a supply or demand initiative, and in the future, they can turn into important breakout or retracement zones. A POC zone is one which represents price areas with the most time or vo
The Volume+ and VSA Signals indicator for MT5 is based on the Volume Spread Analysis (VSA) methodology to provide the signals. The signals are displayed at closing of bars on the main window or subwindow in the form of symbols. The symbols are not repainting.  The indicator produces a signal on an individual bar and this signal is not buy or sell signal. When a minor trend goes in the opposite direction of a major trend, there are sequences of major trend-following signals that give a higher pro
Normalized Volume99% of indicators are based on price analysis. This indicator is based on volume. Volume is overlooked piece of information in most trading systems. And this is a big mistake since volume gives important information about market participants. Normalized Volume is an indicator that can be used to confirm reversal points. The indicator code volume with colors indicating high, normal and low volume. You could enhance dramatically your trading system using volume analysis. 
MACD Intraday Trend PRO è un indicatore sviluppato attraverso un adattamento del MACD originale creato da Gerald Appel negli anni '60. Attraverso anni di trading, è stato osservato che modificando i parametri del MACD con le proporzioni di Fibonacci otteniamo una migliore presentazione della continuità dei movimenti di tendenza, rendendo possibile rilevare in modo più efficiente l'inizio e la fine di un andamento di prezzo. Grazie alla sua efficienza nel rilevare l'andamento dei prezzi, è a
The Volume Spread Analysis indicator is based on the original Volume Spread Analysis method. It was designed for quick and easy recognition of VSA patterns. Even though this indicator looks very simple, it is the most sophisticated tool we've ever made. It is a really powerful analytical tool that generates very reliable trading signals. Because it is very user-friendly and understandable, it is suitable for every type of trader, regardless of his experience. What is VSA? VSA - Volume Spread
Mean Volume indicator for MT5
Renaud Herve Francois Candel
Mean Volume Most indicators are based on price analysis. This indicator is based on volume. Volume is overlooked piece of information in most trading systems. And this is a big mistake since volume gives important information about market participants. Mean Volume is an indicator that can be used to spot when volume is above average. It usually means that institutional traders are active. Peak in volume can be used to confirm an entry since increased volume can sustain the move in one or
Wapv Price and volume
Eduardo Da Costa Custodio Santos
L'indicatore di prezzo e volume WAPV per MT5 fa parte del set di strumenti (Wyckoff Academy Wave Market) e (Wyckoff Academy Price and Volume). L'indicatore di prezzo e volume WAPV per MT5 è stato creato per semplificare la visualizzazione del movimento del volume sul grafico in modo intuitivo. Con esso puoi osservare i momenti di picco del volume e i momenti in cui il mercato non ha interesse professionale Identifica i momenti in cui il mercato si muove per inerzia e non per movimento di "denaro
Market Marker MT5
Evgeny Shevtsov
3.8 (5)
The indicator displays peak levels of activity formed by the maximum volume, tracks the correlation of the candles on all timeframes (from the highest to the lowest one). Each volume level is a kind of key trading activity. The most important cluster is inside a month, week, day, hour, etc. Indicator operation features A volume level receives Demand status if the nearest volume level located to the left and above has been broken upwards. A volume level receives Supply status if the nearest vol
Chaikin Money Flow
Jose Miguel Soriano
This indicator incorporates the volume to inform the market trend. A warning system (chart, SMS and e-mail) is incorporated for warning when a certain level is exceeded. Developed by Marc Chaikin, Chaikin Money Flow (CMF) measures the amount of Money Flow Volume (MFV) over a specific period. Money Flow Volume forms the basis for the Accumulation Distribution Line. Instead of a cumulative total of Money Flow Volume, Chaikin Money Flow simply sums Money Flow Volume for a specific look-back period.
PTS Demand Index MT5
PrecisionTradingSystems
Codice PTS Demand Index di Precision Trading Systems Il Demand Index è stato creato da James Sibbet e utilizza un codice complesso per semplificare l'interpretazione del volume e del prezzo come combinazione. Comprendere i volumi non è mai un compito facile, ma questo bellissimo pezzo di programmazione certamente rende tutto più facile. Ci sono diversi modi in cui questo indicatore può essere vantaggioso per trader e investitori. Divergenze (Come indicatore principale) Dopo aver stu
VolaMetrics VSA
Thalles Nascimento De Carvalho
VolaMetrics VSA è un indicatore tecnico avanzato che combina la metodologia Volume Spread Analysis (VSA) con un'analisi dettagliata del volume delle negoziazioni. Questo indicatore è stato sviluppato per identificare e tracciare i movimenti significativi dei prezzi sul mercato, utilizzando l'interazione tra volume e variazione dei prezzi. Fondamenti della Volume Spread Analysis (VSA) La VSA è una metodologia che analizza la relazione tra il volume delle negoziazioni, la variazione dei prezzi (sp
When looking at the volume information that moves the market, a question arises: is it a strong or weak movement? Should it be compared with previous days? These data should be normalized to always have a reference. This indicator reports the market volume normalized between 0-100 values. It has a line that smoothes the main signal (EMA). The normalization of values occurs within an interval defined by user (21 bars on default). User can also define any relative maximum, timeframe and number of
Reverse side scalper is the manual trading system, that works on choppy(anti-trend) market. As a rule markets are on 80% choppy and only 20% is trend phase. System is based on custom step Moving and RSI and reverse pattern. System defines up movement, down movement, trend / choppy phases. Indicator plots Buy signal arrow when current direction is down and phase is trend, Sell signal arrow is plotted when currently is up movement and phase is trend. As a rule it allows to "catch" local maximum/mi
A countdown timer for the  Volume bar chart generator  and  Tick chart generator  products, which are available for download from the MQL5 Market: Tick chart generator: https://www.mql5.com/en/market/product/29215 Volume bar chart generator: https://www.mql5.com/en/market/product/47197 The counter conveniently displays the number of ticks or transactions (depending on the chart) that need to pass for a new bar to start printing. The user can set the following indicator inputs. Volume type
FREE
Normalized OBV
Jose Miguel Soriano
When looking at the information of On Balance Volume indicator, a question arises: is it a strong or weak movement? Should it be compared with previous days? These data should be normalized to always have a reference. This indicator presents the followings parameters: Normalization period (Max-Mins absolute) Smoothing period (-1 off) Tick/Real Volume Maximum number of bars to calculate (-1 off) Upper value normalization Lower value normalization Calculation: normOBV = (value - absMin) * (relMa
Segmented Volume MT5
Eduardo Da Costa Custodio Santos
L'indicatore MT5 Segmented Volume è stato creato per facilitare coloro che fanno trading utilizzando l'analisi dei prezzi e dei volumi, VSA, VPA, metodo Wyckoff e Smart Money System. Il volume segmentato funziona su qualsiasi mercato (Crypto, CFD, Forex, Futures, Azioni...) e funziona in qualsiasi momento del grafico. Guarda quanto è facile la tua interpretazione: #Green: Volume molto più alto della media del mercato #Rosa scuro: volume più grande della media #Blu: volume normale positivo #Rosso
Market Momentum PRO
Flavio Javier Jarabeck
The Market Momentum indicator is based on the Volume Zone Oscillator (VZO), presented by Waleed Aly Khalil in the 2009 edition of the International Federation of Technical Analysts journal, and presents a fresh view of this market valuable data that is oftenly misunderstood and neglected: VOLUME. With this new approach of "seeing" Volume data, traders can infer more properly market behavior and increase their odds in a winning trade. "The VZO is a leading volume oscillator; its basic usefulnes
Waves PRO
Flavio Javier Jarabeck
For those who appreciate Richard Wyckoff approach for reading the markets, we at Minions Labs designed a tool derived - yes, derived, we put our own vision and sauce into this indicator - which we called Waves PRO . This indicator provides a ZigZag controlled by the market volatility (ATR) to build its legs, AND on each ZigZag leg, we present the vital data statistics about it. Simple and objective. This indicator is also derived from the great book called " The Secret Science of Price and Volum
Do you use volume in your reading of the market? Certainly many traders use it, and do not imagine operating without it. The Color Histogram Volume Set indicator allows the user to choose the value that he considers interesting to monitor. When you pass this you will have visual confirmation and if you want you will also have the audible alert that is given by the indicator. Of course, there are other ways to try to find a high volume, such as assessing whether the volume
KT Renko Patterns MT5
KEENBASE SOFTWARE SOLUTIONS
KT Renko Patterns scans the Renko chart brick by brick to find some famous chart patterns that are frequently used by traders across the various financial markets. Compared to the time-based charts, patterns based trading is easier and more evident on Renko charts due to their uncluttered appearance. KT Renko Patterns features multiple Renko patterns, and many of these patterns are extensively explained in the book titled Profitable Trading with Renko Charts by Prashant Shah. A 100% automate
Hello Traders I have created this indicator to Catch SPIKES on Crash1000, Crash500 and Crash300. Follow the below mention instruction for better Result 1. When Red arrow pop up on the Chart, Take a Sell entry 2. Stay in trade until price break below from entry 3. Do not hold trades after all trades went in Blue 4. Keep adding position until spike cross below from intial entry See Example for more assistance
Indicatore di livello superiore dei prezzi esatti di acquisto e vendita. Adatto a tutti i simboli, devi solo scegliere un'attività di trading conveniente. L'indicatore mostra i livelli di rimbalzo del prezzo con gli obiettivi per entrare e uscire da una posizione. Il commento ad ogni livello afferma: cosa fare a livello (ACQUISTA/VENDI); prezzo d'ingresso; prezzo di uscita obiettivo. Nei parametri devi selezionare la tua attività di trading: Investitore a lungo termine Investitore a medio t
Wolfe Wave Scanner MT5
Reza Aghajanpour
5 (4)
**  All Symbols  x  All Timeframes  scan just by pressing scanner button ** *** Contact me after the purchase to send you instructions and add you in "Wolfe Wave Scanner group" for sharing or seeing experiences with other users. Introduction: A Wolfe Wave is created with five-wave patterns in price. It shows supply and demand and a fight towards a balance price. T hese waves of price actions can help traders identify the boundaries of   the trend . Also  It helps forecast how the price will mo
Volumes Direction MT5
William Oswaldo Mayorga Urduy
DIREZIONE VOLUMI MT5 Normalmente l'indicatore del volume ha un cambio di colore predefinito quando il volume corrente è più alto del precedente, è importante ma non molto utile. Per questo motivo è stato creato questo indicatore che oltre al volume normale, quando la candela è rialzista o ribassista, le dipinge di un colore diverso, di default è blu per rialzista e rosso per ribassista, ma questi colori possono essere personalizzati al Il gusto del commerciante. Non dimenticare di con
White Weis Volume Ticks
Ricardo Almeida Branco
5 (3)
White Weis Volume This indicator shows the sum of the volume in each wave, bulish or bearish, as idealized by David Weis , but it brings an important addition , which is the marking of the bar with the highest volume of the wave (White Bar)! In coding the indicator, it was sought to optimize the code to require minimal processing during use and not to overload mt5. The indicator can be used for pre-trading analysis and study, where the trader analyzes possible points of support and resi
Introduction to Chart Pattern MT Chart Pattern MT is a chart pattern scanner to detect the triangle pattern, falling wedge pattern, rising wedge pattern, channel pattern and so on. Chart Pattern MT uses highly sophisticated chart pattern detection algorithm. However, we have designed it in the easy to use with intuitive user interface. Chart Pattern MT will show all the patterns in your chart in the most efficient format for your trading. You do not have to do tedious manual pattern detection an
This simple, yet powerful indicator is very good way to determine actual S/R levels. It's main purpose is making your overview on markets much better.It has built-in arrow signal system, which should be used along with MT indicators for best results.Just try it. Recommended MT indicators to use along: Bollinger Bands (default) RSI (period 3, levels 10/90)
Gli utenti di questo prodotto hanno anche acquistato
Atomic Analyst MT5
Issam Kassas
4.78 (18)
Innanzitutto, vale la pena sottolineare che questo indicatore di trading non è repaint, non è ridisegno e non presenta ritardi, il che lo rende ideale sia per il trading manuale che per quello automatico. Manuale utente: impostazioni, input e strategia. L'Analista Atomico è un indicatore di azione del prezzo PA che utilizza la forza e il momentum del prezzo per trovare un miglior vantaggio sul mercato. Dotato di filtri avanzati che aiutano a rimuovere rumori e segnali falsi, e aumentare il pote
Innanzitutto è importante sottolineare che questo sistema di trading è un indicatore Non-Repainting, Non-Redrawing e Non-Lagging, il che lo rende ideale sia per il trading manuale che per quello automatico. Corso online, manuale e download di preset. Il "Sistema di Trading Smart Trend MT5" è una soluzione completa pensata sia per i trader principianti che per quelli esperti. Combina oltre 10 indicatori premium e offre più di 7 robuste strategie di trading, rendendolo una scelta versatile per div
Gold Stuff mt5
Vasiliy Strukov
4.9 (182)
Gold Stuff mt5 è un indicatore di tendenza progettato specificamente per l'oro e può essere utilizzato anche su qualsiasi strumento finanziario. L'indicatore non ridisegna e non è in ritardo. Periodo consigliato H1. Contattami subito dopo l'acquisto per avere le impostazioni e un bonus personale!   I risultati in tempo reale possono essere visualizzati qui.  Puoi ottenere una copia gratuita del nostro indicatore Strong Support e Trend Scanner, per favore scrivi in ​​privato. M   IMPOSTAZION
Quantum Trend Sniper
Bogdan Ion Puscasu
4.92 (48)
Presentazione       Quantum Trend Sniper Indicator   , l'innovativo indicatore MQL5 che sta trasformando il modo in cui identifichi e scambi le inversioni di tendenza! Sviluppato da un team di trader esperti con un'esperienza di trading di oltre 13 anni,       Indicatore Quantum Trend Sniper       è progettato per spingere il tuo viaggio di trading verso nuove vette con il suo modo innovativo di identificare le inversioni di tendenza con una precisione estremamente elevata. *** Acquista Quant
TPSproTREND PrO MT5
Roman Podpora
4.89 (9)
TPSpro TREND PRO  - is a trend indicator that automatically analyzes the market and provides information about the trend and each of its changes, as well as giving signals for entering trades without redrawing! The indicator uses each candle, analyzing them separately. referring to different impulses - up or down impulse. Exact entry points into transactions for currencies, crypto, metals, stocks, indices!  Version MT4               DETAILED DESCRIPTION               R ecommended to use with an
TPSpro RFI Levels MT5
Roman Podpora
4.67 (9)
Reversal First Impulse levels (RFI)      INSTRUCTIONS        RUS       -       ENG              R ecommended to use with an indicator   -   TPSpro  TREND PRO -  Version MT4                 A key element in trading is zones or levels from which decisions to buy or sell a trading instrument are made. Despite attempts by major players to conceal their presence in the market, they inevitably leave traces. Our task was to learn how to identify these traces and interpret them correctly. Main functi
Trend Screener Pro MT5
STE S.S.COMPANY
4.88 (67)
Indicatore di tendenza, soluzione unica rivoluzionaria per il trading di tendenze e il filtraggio con tutte le importanti funzionalità di tendenza integrate in un unico strumento! È un indicatore multi-timeframe e multi-valuta al 100% non ridipingibile che può essere utilizzato su tutti i simboli/strumenti: forex, materie prime, criptovalute, indici e azioni. Trend Screener è un indicatore di tendenza che segue un indicatore efficiente che fornisce segnali di tendenza a freccia con punti nel gra
Innanzitutto, vale la pena sottolineare che questo Strumento di Trading è un Indicatore Non-Ridipingente, Non-Ridisegnante e Non-Laggante, il che lo rende ideale per il trading professionale. Corso online, manuale utente e demo. L'Indicatore Smart Price Action Concepts è uno strumento molto potente sia per i nuovi che per i trader esperti. Racchiude più di 20 utili indicatori in uno solo, combinando idee di trading avanzate come l'Analisi del Trader del Circolo Interno e le Strategie di Trad
Questo cruscotto mostra gli ultimi   pattern armonici   disponibili per i simboli selezionati, in modo da risparmiare tempo ed essere più efficienti /   versione MT4 . Indicatore gratuito:   Basic Harmonic Pattern Colonne dell'indicatore Symbol :   vengono visualizzati i simboli selezionati Trend:   rialzista o ribassista Pattern:   tipo di pattern (gartley, butterfly, bat, crab, shark, cypher o ABCD) Entry:   prezzo di ingresso SL:   prezzo di stop loss TP1:   1 prezzo di take profit TP
FX Power MT5 NG
Daniel Stein
5 (6)
Ricevi il tuo aggiornamento quotidiano sul mercato con dettagli e schermate tramite il nostro Morning Briefing qui su mql5 e su Telegram ! FX Power MT5 NG è la nuova generazione del nostro popolare misuratore di forza delle valute, FX Power. Cosa offre questo misuratore di forza di nuova generazione? Tutto ciò che avete amato dell'FX Power originale IN PIÙ Analisi della forza di ORO/XAU Risultati di calcolo ancora più precisi Periodi di analisi configurabili individualmente Limite di calcolo pe
IX Power MT5
Daniel Stein
4.17 (6)
IX Power   porta finalmente l'imbattibile precisione di FX Power ai simboli non-Forex. Determina con precisione l'intensità delle tendenze a breve, medio e lungo termine dei vostri indici preferiti, azioni, materie prime, ETF e persino criptovalute. Potete   analizzare tutto ciò che   il vostro terminale ha da offrire. Provatelo e sperimentate come   il vostro tempismo migliori significativamente   durante il trading. Caratteristiche principali di IX Power Risultati di calcolo precisi al
XQ Indicator MetaTrader 5
Marzena Maria Szmit
5 (1)
Step into the realm of Forex trading with confidence and precision using XQ, a cutting-edge Forex indicator designed to elevate your trading game to unprecedented heights. Whether you're a seasoned trader or just stepping into the world of currency exchange, XQ Forex Indicator empowers you with the insights and signals needed to make informed trading decisions. The signal conditions are a combination of three indicators, and XQ Forex Indicator only display  medium and long-term trends . The ind
AW Trend Predictor MT5
AW Trading Software Limited
4.78 (58)
La combinazione di trend e livelli di rottura in un unico sistema. Un algoritmo di indicatore avanzato filtra il rumore del mercato, determina la tendenza, i punti di ingresso e i possibili livelli di uscita. I segnali indicatori sono registrati in un modulo statistico, che permette di selezionare gli strumenti più adatti, mostrando l'efficacia dello storico dei segnali. L'indicatore calcola i segni Take Profit e Stop Loss. Manuale e istruzioni ->   QUI   / versione MT4 ->   QUI Come fare tradi
Gartley Hunter Multi
Siarhei Vashchylka
5 (8)
Gartley Hunter Multi - An indicator for searching for harmonic patterns simultaneously on dozens of trading instruments and on all possible timeframes. Manual (Be sure to read before purchasing) | Version for MT4 Advantages 1. Patterns: Gartley, Butterfly, Shark, Crab. Bat, Alternate Bat, Deep Crab, Cypher 2. Simultaneous search for patterns on dozens of trading instruments and on all possible timeframes 3. Search for patterns of all possible sizes. From the smallest to the largest 4. A
Top indicator for MT5   providing accurate signals to enter a trade without repainting! It can be applied to any financial assets:   forex, cryptocurrencies, metals, stocks, indices .  Watch  the video  (6:22) with an example of processing only one signal that paid off the indicator! MT4 version is here It will provide pretty accurate trading signals and tell you when it's best to open a trade and close it. Most traders improve their trading results during the first trading week with the help of
PZ Swing Trading MT5
PZ TRADING SLU
5 (4)
Protect against whipsaws: revolutionize your swing trading approach Special Offer: Purchase now to receive free bonuses worth $159! (Read more for details) Swing Trading is the first indicator designed to detect swings in the direction of the trend and possible reversal swings. It uses the baseline swing trading approach, widely described in trading literature. The indicator studies several price and time vectors to track the aggregate trend direction and detects situations in which the market i
Bill Williams Advanced
Siarhei Vashchylka
5 (7)
Bill Williams Advanced is designed for automatic chart analysis using Bill Williams' "Profitunity" system. The indicator analyzes four timeframes at once. Manual (Be sure to read before purchasing) Advantages 1. Automatically analyzes the chart using the "Profitunity" system of Bill Williams. The found signals are placed in a table in the corner of the screen. 2. Equipped with a trend filter based on the Alligator indicator. Most of the system signals are recommended to be used only accordi
ICT, SMC, SMART MONEY CONCEPTS, SMART MONEY, Smart Money Concept, Support and Resistance, Trend Analysis, Price Action, Market Structure, Order Blocks, BOS/CHoCH,   Breaker Blocks ,  Momentum Shift,   Supply&Demand Zone/Order Blocks , Strong Imbalance,   HH/LL/HL/LH,    Fair Value Gap, FVG,  Premium  &   Discount   Zones, Fibonacci Retracement, OTE, Buy Side Liquidity, Sell Side Liquidity, BSL/SSL Taken, Equal Highs & Lows, MTF Dashboard, Multiple Time Frame, BigBar, HTF OB, HTF Market Structure
Blahtech Supply Demand MT5
Blahtech Limited
4.54 (13)
Was: $299  Now: $99   Supply Demand uses previous price action to identify potential imbalances between buyers and sellers. The key is to identify the better odds zones, not just the untouched ones. Blahtech Supply Demand indicator delivers functionality previously unavailable on any trading platform. This 4-in-1 indicator not only highlights the higher probability zones using a multi-criteria strength engine, but also combines it with multi-timeframe trend analysis, previously confirmed swings
Trend Forecaster
Alexey Minkov
5 (6)
The Trend Forecaster indicator utilizes a unique proprietary algorithm to determine entry points for a breakout trading strategy. The indicator identifies price clusters, analyzes price movement near levels, and provides a signal when the price breaks through a level. The Trend Forecaster indicator is suitable for all financial assets, including currencies (Forex), metals, stocks, indices, and cryptocurrencies. You can also adjust the indicator to work on any time frames, although it is recommen
AT Forex Indicator MT5
Marzena Maria Szmit
5 (4)
The AT Forex Indicator MT5 is a sophisticated trading tool designed to provide traders with a comprehensive analysis of multiple currency pairs. This powerful indicator simplifies the complex nature of the forex market, making it accessible for both novice and experienced traders. AT Forex Indicator uses advanced algorithms to detect trends, patterns and is an essential tool for traders aiming to enhance their forex trading performance. With its robust features, ease of use, and reliable signal
Advanced Supply Demand MT5
Bernhard Schweigert
4.53 (15)
La migliore soluzione per qualsiasi principiante o trader esperto! Questo indicatore è uno strumento di trading unico, di alta qualità e conveniente perché abbiamo incorporato una serie di funzionalità proprietarie e una nuova formula. Con questo aggiornamento, sarai in grado di mostrare fusi orari doppi. Non solo potrai mostrare una TF più alta, ma anche entrambe, la TF del grafico, PIÙ la TF più alta: SHOWING NESTED ZONES. Tutti i trader di domanda di offerta lo adoreranno. :) Informazioni imp
Easy By Sell is a market indicator for opening and closing positions. It becomes easy to track market entries with alerts. It indicates trend reversal points when a price reaches extreme values ​​and the most favorable time to enter the market. it is as effective as a Fibonacci to find a level but it uses different tools such as an algorithm based on ATR indicators and Stochastic Oscillator. You can modify these two parameters as you wish to adapt the settings to the desired period. My othe
Trend Sensor MT5
Yuriy Lyachshenko
L'indicatore mostra i punti di entrata e di uscita più appropriati. Inoltre, visualizza dati statistici su tutti i segnali per una migliore analisi del trading. Con l'aiuto di questo indicatore sarete in grado di comprendere meglio il mercato. Non appena la forza della tendenza inizia a indebolirsi (questo verrà mostrato sul pannello), la linea di tendenza graviterà verso la posizione orizzontale - questo è il segnale per uscire dal trade. Oppure si può uscire quando si raggiunge il livello
Il profitto dalla struttura del mercato cambia quando il prezzo si inverte e si ritira. L'indicatore di avviso di inversione della struttura del mercato identifica quando una tendenza o un movimento di prezzo si sta avvicinando all'esaurimento e pronto a invertire. Ti avvisa dei cambiamenti nella struttura del mercato che in genere si verificano quando stanno per verificarsi un'inversione o un forte pullback. L'indicatore identifica inizialmente i breakout e lo slancio del prezzo, ogni volta
FX Volume MT5
Daniel Stein
4.94 (17)
Ricevi il tuo aggiornamento quotidiano sul mercato con dettagli e schermate tramite il nostro Morning Briefing qui su mql5 e su Telegram ! FX Volume è il PRIMO e UNICO indicatore di volume che fornisce una visione REALE del sentiment del mercato dal punto di vista del broker. Fornisce informazioni straordinarie su come gli operatori di mercato istituzionali, come i broker, sono posizionati sul mercato Forex, molto più velocemente dei rapporti COT. Vedere queste informazioni direttamente sul vo
IVISTscalp5
Vadym Zhukovskyi
5 (5)
What's new about iVISTscalp5 forecast indicator (Version 10)? iVISTscalp5 is a unique nonlinear forecasting for a week ahead system for any financial instrument which executes fast scalping using time levels. iVISTscalp5 is a tool for easy study and understanding of financial market. 1) iVISTscalp5 forecast indicator has been completely rewritten into another programming language (C++), which has accelerated data loading and processing. As a result, a different graphical display of forecast
Legacy of Gann for MT5
Pavel Zamoshnikov
5 (6)
The indicator very accurately determines the levels of the possible end of the trend and profit fixing. The method of determining levels is based on the ideas of W.D.Gann, using an algorithm developed by his follower Kirill Borovsky. Extremely high reliability of reaching levels (according to K. Borovsky  - 80-90%) Indispensable for any trading strategy – every trader needs to determine the exit point from the market! Precisely determines targets on any timeframes and any instruments (forex, met
Presentazione       Quantum Breakout PRO   , l'innovativo indicatore MQL5 che sta trasformando il modo in cui scambi le zone di breakout! Sviluppato da un team di trader esperti con un'esperienza di trading di oltre 13 anni,       Quantum Breakout PRO       è progettato per spingere il tuo viaggio di trading a nuovi livelli con la sua strategia innovativa e dinamica della zona di breakout. Quantum Breakout Indicator ti fornirà frecce di segnalazione sulle zone di breakout con 5 zone target
Volatility Trend System - è un sistema di trading che fornisce segnali per le entrate. Il sistema di volatilità fornisce segnali lineari e puntuali nella direzione del trend, nonché segnali per uscirne, senza ridisegnare o ritardi. L'indicatore di tendenza monitora la direzione del trend a medio termine, mostra la direzione e il suo cambiamento. L'indicatore del segnale si basa sui cambiamenti della volatilità e mostra gli ingressi nel mercato. L'indicatore è dotato di diversi tipi di avvi
Altri dall’autore
Potenzia le Tue Strategie di Trading con l'Indicatoare "Order Block" per MT4 Scopri l'Indicatatore "Order Block": L'Indicatoare "Order Block" per MT4 è progettato per aiutarti a identificare con precisione i blocchi d'ordine nel mercato, segnalando i massimi e i minimi delle candele dell'order block. Questo potente strumento ti consente di capire dove le grandi istituzioni posizionano i loro ordini, migliorando la tua capacità di prevedere i movimenti del mercato. Caratteristiche Principali: Ril
IMPORTANTE: L'indicatore rimarrà al prezzo di 34.90$ fino all'uscita dell'update previsto per il 16 luglio 2024. Il Nuovo Prezzo sarà di 49.90$ (tasse escluse) Indicatore di FVG. Sei sei un SMC trader questo indicatore ti sarà molto utile, individua in automatico i FVG a grafico distinguendoli in 2 tipi:FVG ribassisti e FVG rialzisti(guarda le foto per capire meglio). Questo idicatore funziona a qualsiasi Timeframe e su qualsiasi mercato tu lo voglia usare. Se sei interessato a questo indicatore
FREE Spread indicator for MetaTrader 4 this indicator includes: -average spread -current spread -minimum spread -maximum spread If you are interested in my products I recommend you visit my page where you can find: Experts Advisors:  https://www.mql5.com/it/market/product/119456?source=Site+Profile indicators:  https://www.mql5.com/it/market/product/120038?source=Site+Profile I hope the spread indicator will be useful to you. https://www.mql5.com/it/users/kappa05
FREE
Indicatore Volume Profile per MT4 Ottieni un vantaggio nel trading con l'indicatore "Volume Profile" per MetaTrader 4 (MT4). Questo strumento avanzato di analisi tecnica ti permette di identificare con precisione i livelli chiave di supporto e resistenza basati sul volume delle transazioni. Visualizza facilmente le aree di maggiore interesse del mercato, dove i volumi di scambio sono più alti, e sfrutta queste informazioni per prendere decisioni di trading più informate. Caratteristiche principa
Il "Color Range Indicator" è un potente strumento di analisi tecnica progettato per la piattaforma MT4, ideale per i trader che desiderano avere una visione chiara e immediata delle tendenze di mercato. Questo indicatore disegna una linea colorata in funzione del trend corrente, facilitando l'interpretazione del movimento dei prezzi. Descrizione dell'indicatore: Linea verde : Indica un trend rialzista. Utilizzare questa segnalazione per considerare opportunità di acquisto. Linea rossa : Indica u
OB Indicator
Nicola Capatti
Indicatore di Order Block, massimi e minimi; l'indicatore si concentra principalmente sugli OB,a grafico sono rappresentati con una linea orizzontale sul minimo e sul massimo di quella candela. Mentre per i massimi e minimi viene segnata solo una linea(guarda le immagini per capire meglio). L'indicatore è per MT5, funziona su tutti i Timeframe, su qualsiasi Coppia Forex, su qualsiasi indice e sui mercati cripto. (Per qualsiasi informazione sull'indicatore non esitate a contattarmi). sconto a tem
Expert Advisor for scalping; This EA was built for monthly profitability. Works on any asset: Forex, Indices, Crypto and Stocks. Perfectly usable in MT5 tester and usable on any TimeFrame. The EA has various inputs available to customize operations: -Lots -Risk% (0 = Fix) -OrderDist (the distance between one order and another, the distance is calculated in points not pips) -TP (in points) -Sl (in points) -TrailingStopTrigger(the trailing stop trigger point in points) -TrailingStop(distance from
Indicatore di massimi, minimi e Bos per MT5; L'indicatore funziona su qualsiasi tipo di mercato e su tutti i TimeFrame. Funziona anche sul Tester di MetaTrader5. la funzione principale dell'indicatore è individuare i massimi e i minimi segnandoli con un punto sopra/sotto la candela, poi con una linea orizzontale va a segnare i Bos. E' molto semplice ed intuitivo, sono presenti solo 2 input: -il colore dei massimi -il colore dei minimi Per qualsiasi altra informazione non esitare a contattarmi.
Panel Info Trade For  MT5; L'indicatore ha 2 oggetti principali: -Un grafico icona a cui puoi cambiare Timeframe, zoomare, Coppia Forex, cripto....la posizione del grafico è modificabile tramite gli input (x;y). Il grafico è perfettamente utilizzabile nel tester di MT5. Se il grafico non fa per te e non ti aiuta in niente, puoi premere il guadrato in altro a destra per rimpicciolirlo. -il secondo oggetto è un pannello di controllo dinamico in cui puoi cambiare ilotti, piazzare sl e tp, BE, close
Indicatore di Forza della Valuta (Currency Strength Index - CSI) PRIMA DI ATTIVARE L'INDICATORE RICORDA DI METTERE "TRUE" PER VISUALIZZARE LE COPPIE L'indicatore di Forza della Valuta (Currency Strength Index - CSI) è uno strumento potente utilizzato nel trading forex per misurare la forza relativa delle principali valute. Questo indicatore aiuta i trader a identificare le valute più forti e più deboli in un dato momento, permettendo di prendere decisioni di trading più informate. Caratteristic
Nel mondo del trading, la chiave per il successo si trova nell'avere gli strumenti giusti al momento giusto. Il nostro innovativo indicatore di Volume Profile è stato sviluppato con un unico obiettivo in mente: fornire ai trader un accesso senza precedenti alle informazioni vitali sulle attività di mercato. Questo strumento all'avanguardia ti permette di vedere non solo dove e quando si scambiano i volumi, ma anche di comprendere la profondità del mercato con una chiarezza mai vista prima. Carat
Massimizza le Tue Opportunità di Trading con l'Indicatore "Auto Trendlines" Scopri l'Indicatore "Auto Trendlines": "Auto Trendlines" è lo strumento essenziale per ogni trader tecnico. Questo indicatore traccia automaticamente le linee di tendenza, identificando i livelli di supporto e resistenza con precisione chirurgica. È ideale per coloro che cercano di capitalizzare sui breakout e sui movimenti di inversione del mercato. Caratteristiche Principali: Tracciamento Automatico delle Linee di Tend
Ottimizza le Tue Decisioni di Trading con l'Indicatore "autoFibo" Scopri l'Indicatore "autoFibo": "autoFibo" è l'indispensabile strumento di analisi per i trader che vogliono sfruttare al massimo i livelli di Fibonacci senza il fastidio di tracciare manualmente. Questo indicatore automatizza il processo di ritracciamento di Fibonacci, offrendo un immediato accesso visivo a supporti e resistenze chiave. Caratteristiche Principali: Ritracciamento Automatico di Fibonacci: Traccia automaticamente i
Filtro:
Nessuna recensione
Rispondi alla recensione