SolarTrade Suite Venus Market Indicator
- Indicatori
- Adam Gerasimov
- Versione: 1.0
- Attivazioni: 5
SolarTrade Suite Financial Indicator: Venus Market Indicator - La tua guida affidabile nel mondo dei mercati finanziari!
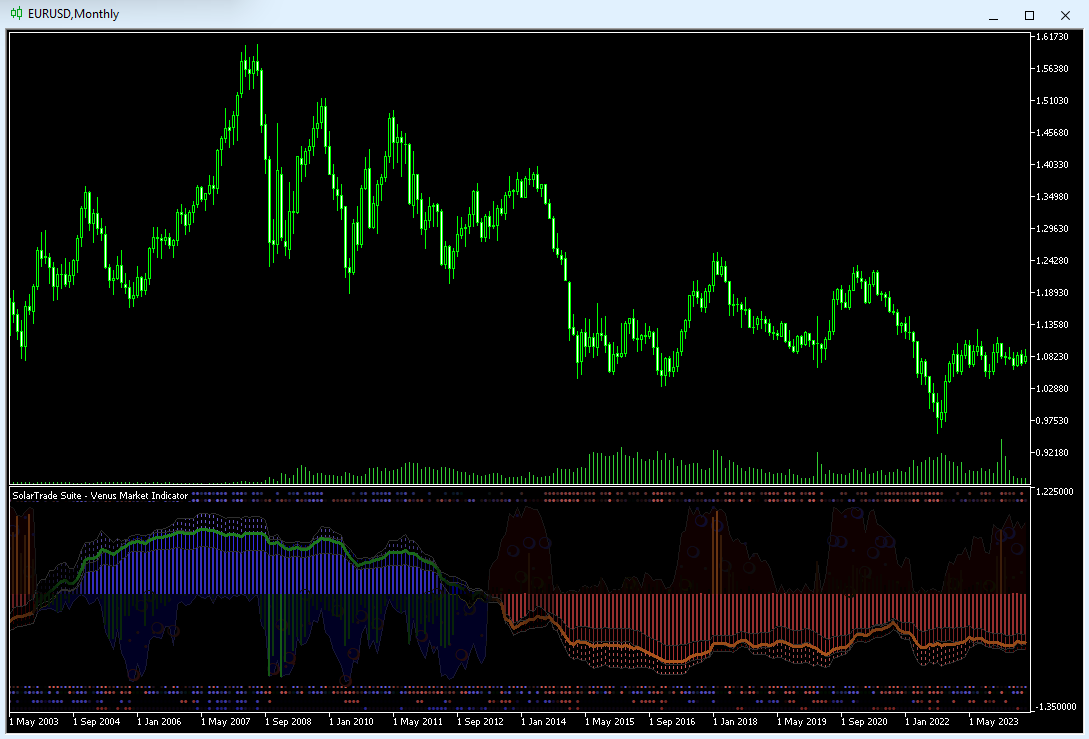
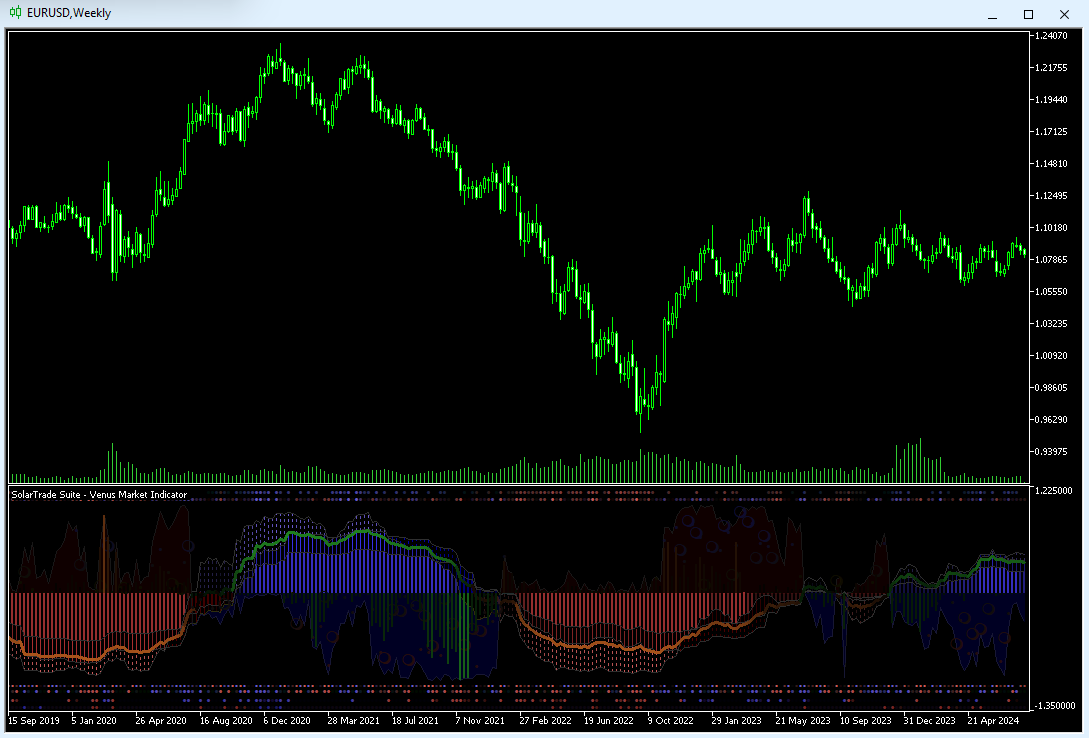
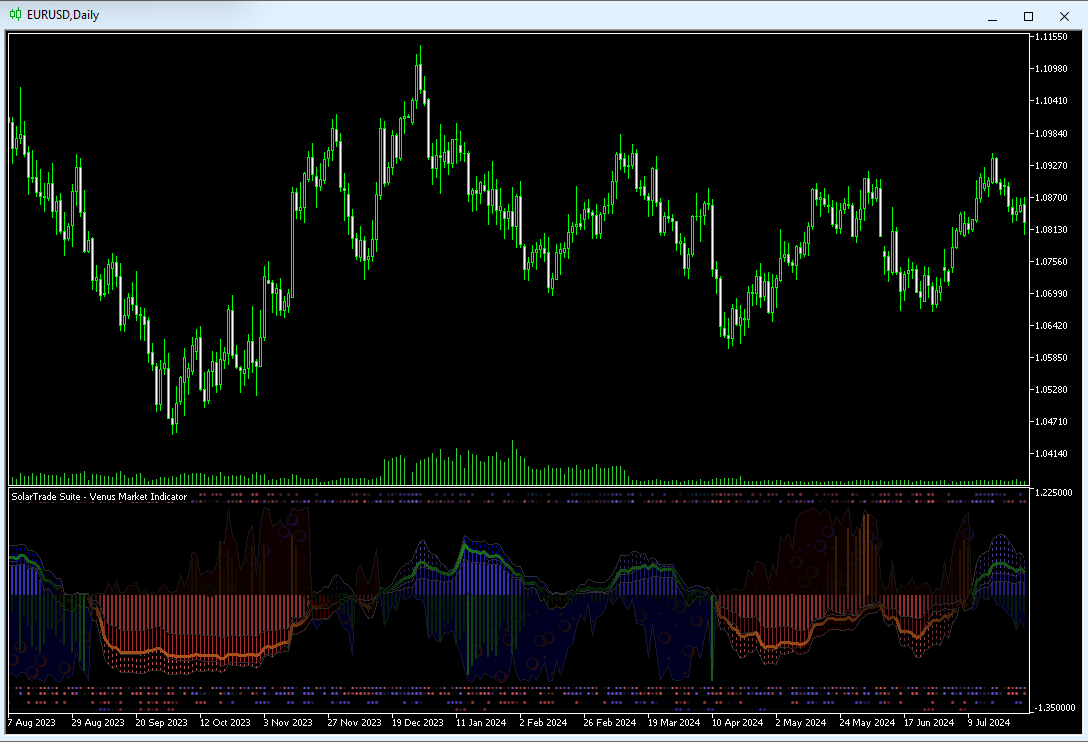
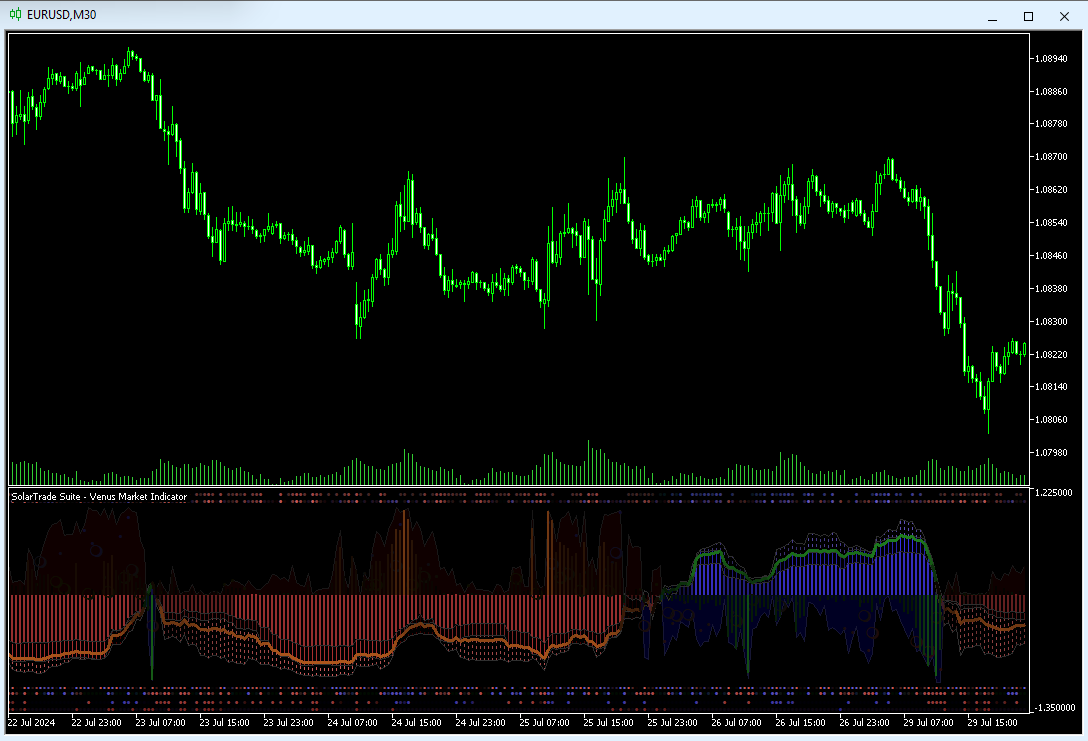
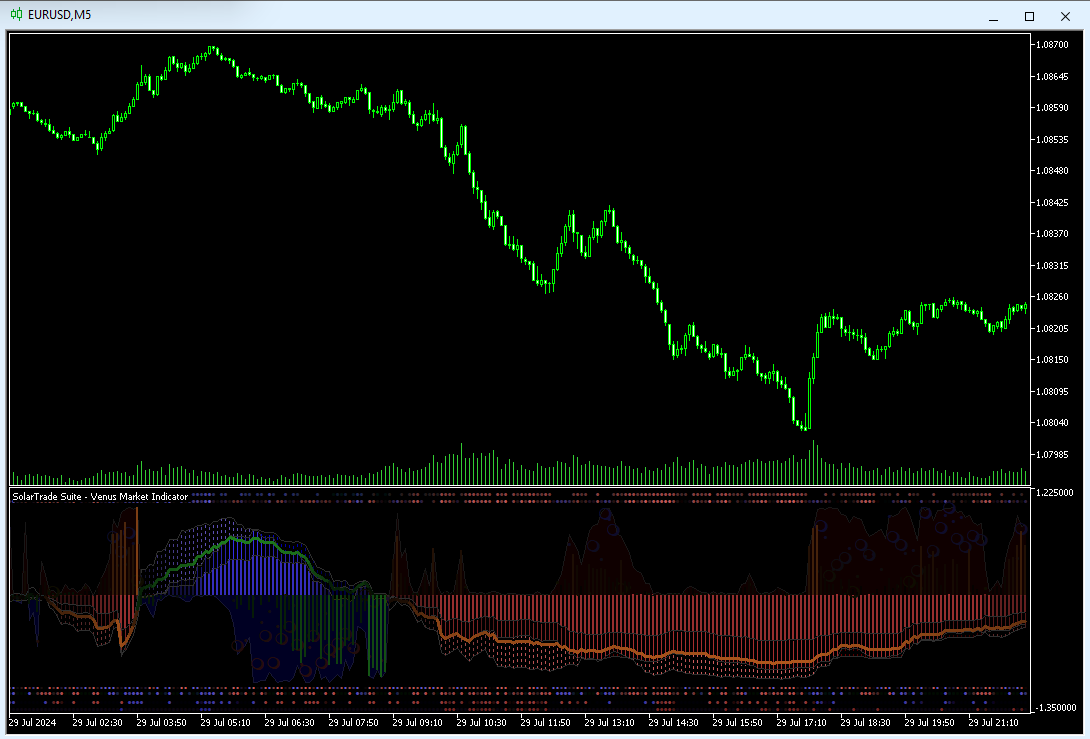
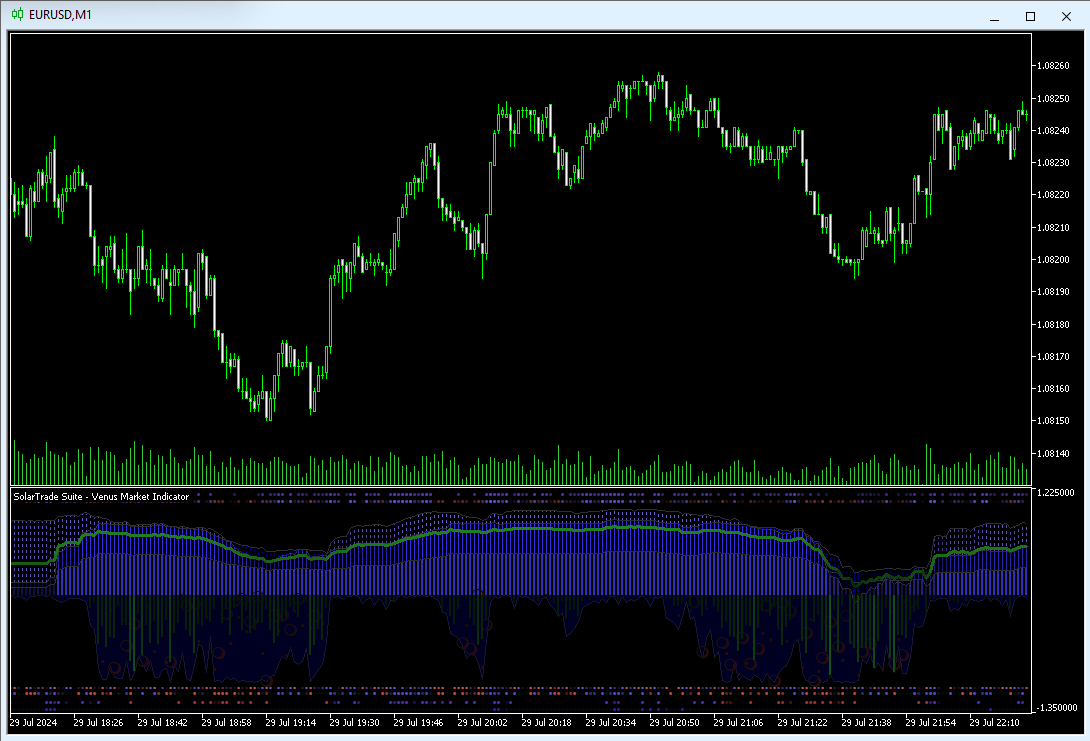
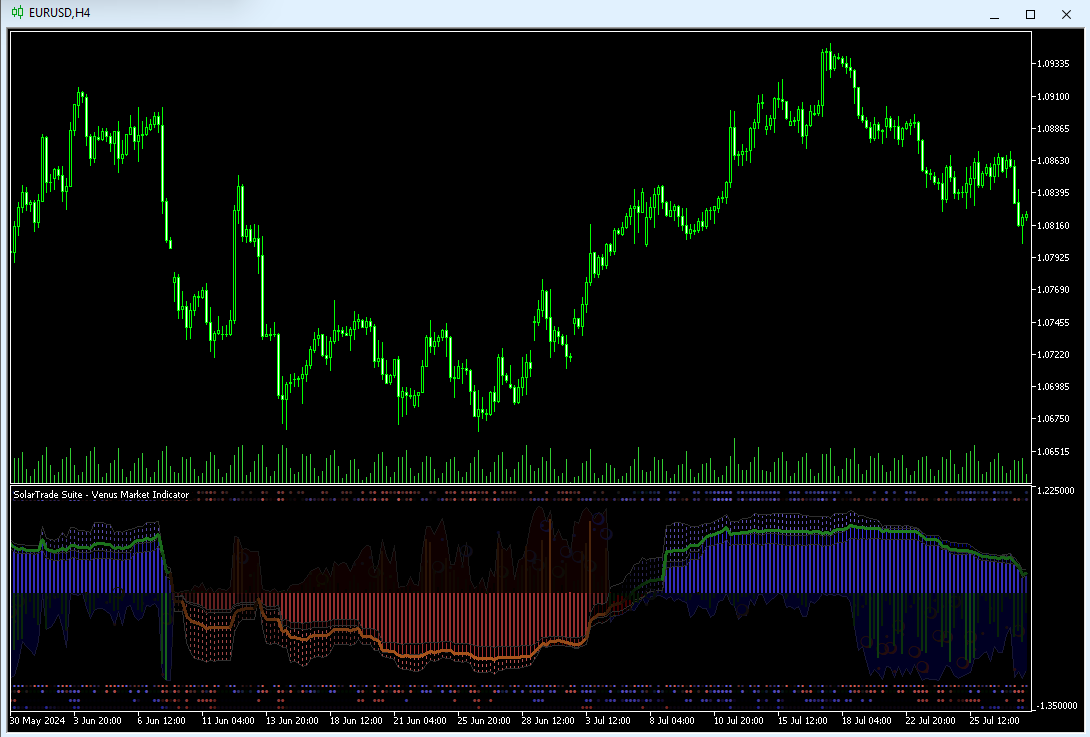
Questo è un oscillatore che utilizza speciali algoritmi innovativi e avanzati per calcolare il suo valore e ha anche un design gradevole alla vista.
È molto facile capire le letture di questo indicatore: colore blu - acquisto, rosso - vendita.
Più luminoso è il colore, più forte è il segnale.
Dai un'occhiata agli altri nostri prodotti della serie SolarTrade Suite in fondo alla descrizione.
Vuoi navigare con sicurezza nel mondo degli investimenti e dei mercati finanziari? SolarTrade Suite Financial Indicator: Venus Market Indicator è un software innovativo progettato per aiutarti a prendere decisioni di investimento informate e aumentare i tuoi profitti.
Vantaggi di SolarTrade Suite Financial Indicator: Venus Market Indicator:
- Previsioni accurate: il nostro indicatore utilizza algoritmi avanzati e metodi analitici per prevedere con precisione i movimenti del mercato.
Ricevi segnali sui momenti migliori per acquistare e vendere asset.
- Interfaccia intuitiva: l'interfaccia intuitiva ti consentirà di padroneggiare facilmente il programma e iniziare a utilizzare i suoi vantaggi subito dopo l'installazione. Dalle impostazioni, puoi cambiare il colore, lo spessore e lo stile delle linee, e tutte le altre impostazioni vengono effettuate automaticamente.
Supporto esperto: il nostro team di professionisti è sempre pronto ad aiutarti con qualsiasi domanda e a fornire consigli sull'utilizzo del programma.
Perché scegliere SolarTrade Suite Financial Indicator: Venus Market Indicator?
- Affidabilità e accuratezza: il programma si è dimostrato uno strumento affidabile e accurato per l'analisi dei mercati finanziari.
- Crescita del tuo capitale: con SolarTrade Suite Financial Indicator: Venus Market Indicator, sarai in grado di prendere decisioni più accurate, che porteranno a un aumento dei tuoi profitti.
Prova subito SolarTrade Suite Financial Indicator: Venus Market Indicator e sentiti sicuro delle tue decisioni di investimento!
Serie di programmi SolarTrade Suite:
- SolarTrade Suite: Mercury Market Indicator.
- SolarTrade Suite Venus Market Indicator.
- SolarTrade Suite Mars Market Indicator.
- SolarTrade Suite: Jupiter Market Indicator.
- SolarTrade Suite: Saturn Market Indicator.
- SolarTrade Suite Uranus Market Indicator.
- SolarTrade Suite Neptune Market Indicator.
- SolarTrade Suite Pluto Market Indicator.
- SolarTrade Suite: Comet Market Indicator.
- SolarTrade Suite: LaunchPad Market Expert.