Flag Pattern Scanner v5
- Indicatori
- Elif Kaya
- Versione: 1.0
- Attivazioni: 20
Introduction
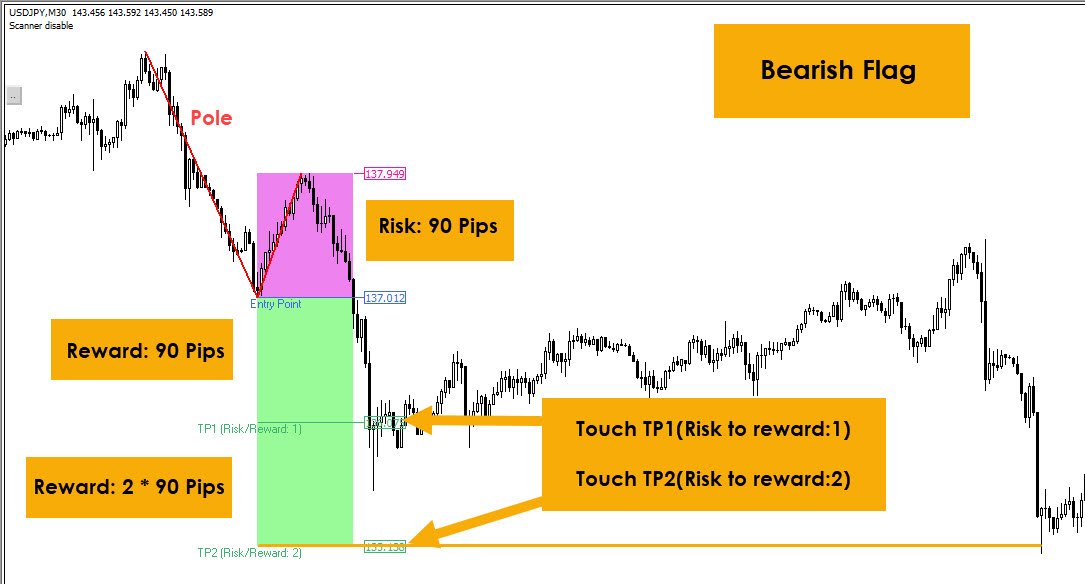
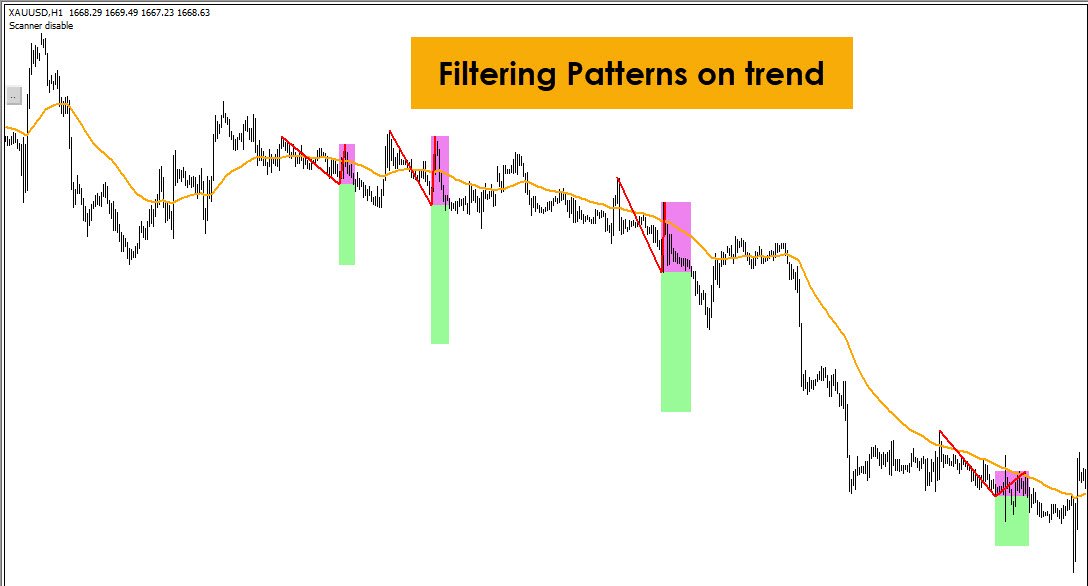
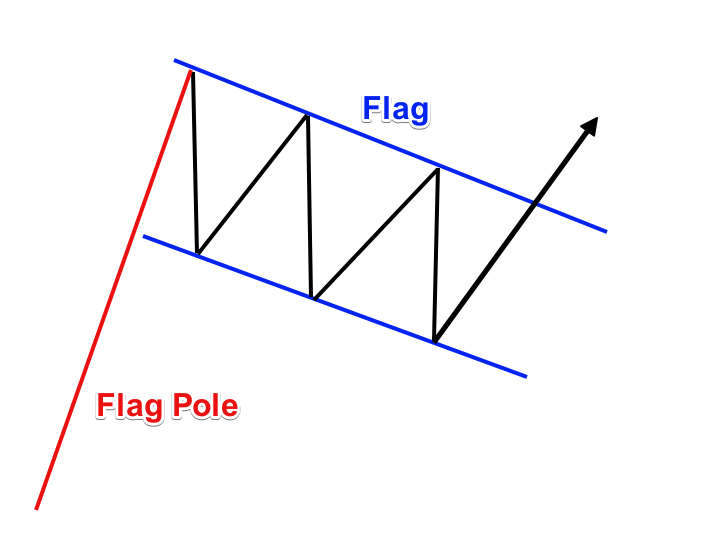
A flag can be used as an entry pattern for the continuation of an established trend. The formation usually occurs after a strong trending move. The pattern usually forms at the midpoint of a full swing and shows the start of moving. Bullish flags can form after an uptrend, bearish flags can form after a downtrend.
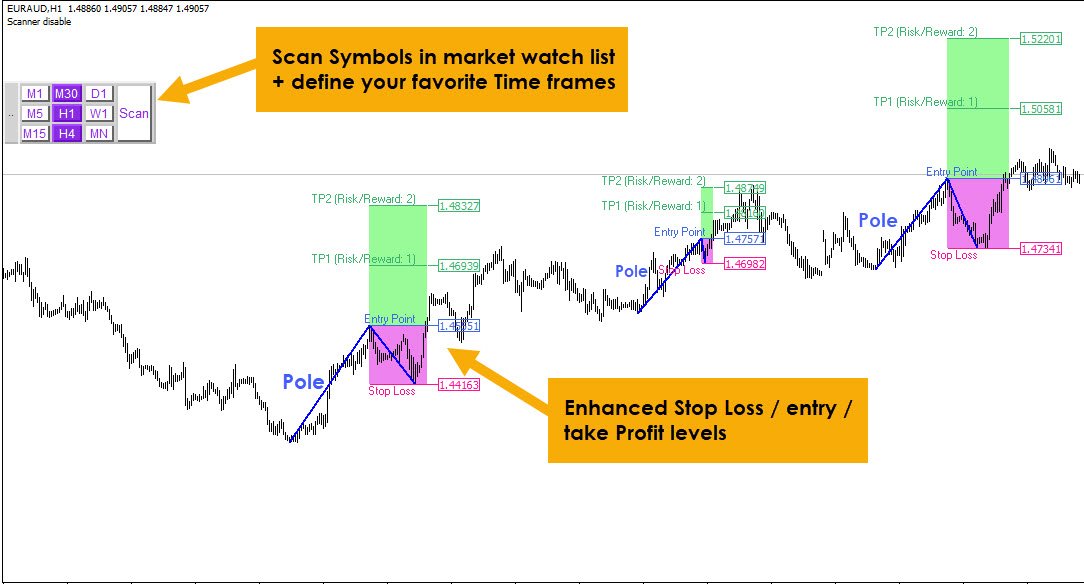
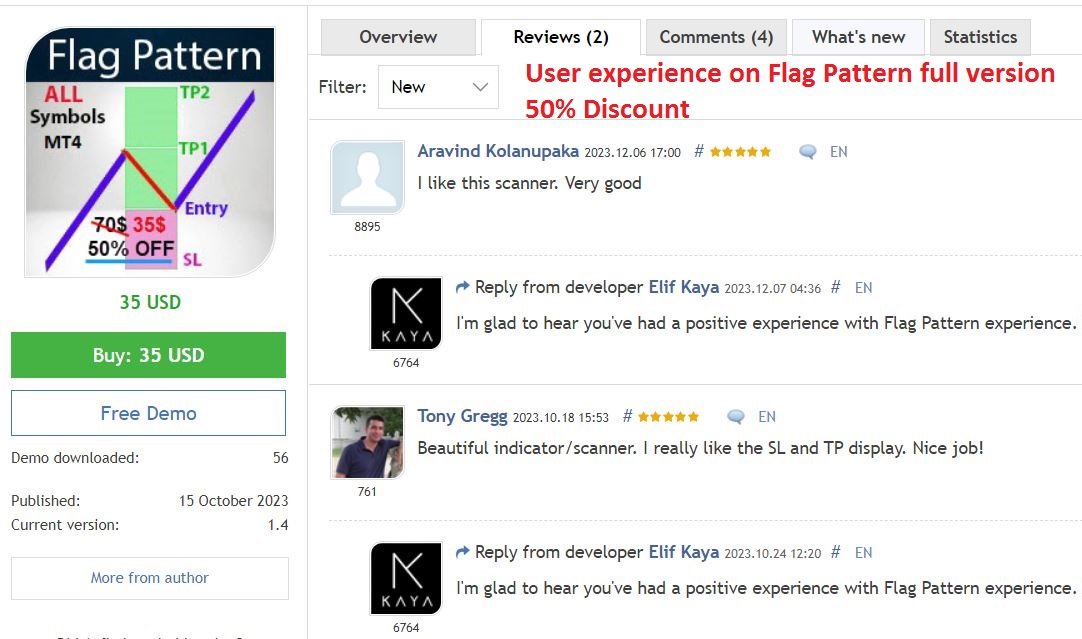
Flag Pattern Scanner Indicator
It is usually difficult for a trader to recognize classic patterns on a chart, as well as searching for dozens of charts and time frames will take time, and there is also a possibility of a trader's mistake in calculations. This indicator can automatically search all charts and time frames to find possible patterns in in one chart.
Searching, Fibonacci calculations and pattern recognition are completely the responsibility of the indicator; All you have to do is "press the scan button".
How To Trade?
All parameters necessary to enter the trade are calculated, such as entry point, stop-loss, and take-profit.
By observing the signal and deciding to trade, we enter the trade with the "set and forget" method.