• Panoramica
  • Recensioni
  • Commenti (3)

Multi Timeframe Moving Averages

L'indicatore MTFMA (Medie Mobili Multi-Temporali) utilizza più medie mobili (MA) in diversi intervalli di tempo per fornire segnali di acquisto e vendita (che non ridisegnano) in una finestra separata dal grafico principale. È versatile e facile da interpretare, adatto sia per lo scalping in intervalli di tempo più piccoli sia per il trading a lungo termine in intervalli di tempo maggiori.

Perché è Multi-Temporale?

Il termine multi-temporale si riferisce alla capacità dell'indicatore di utilizzare e combinare dati provenienti da più intervalli di tempo. L'MTFMA calcola e visualizza segnali basati su quattro medie mobili (MA) configurabili. Ogni MA può essere regolata per periodi, metodi di calcolo e tipi di prezzo diversi, permettendo ai trader di vedere una combinazione di tendenze a breve e lungo termine su un unico grafico.

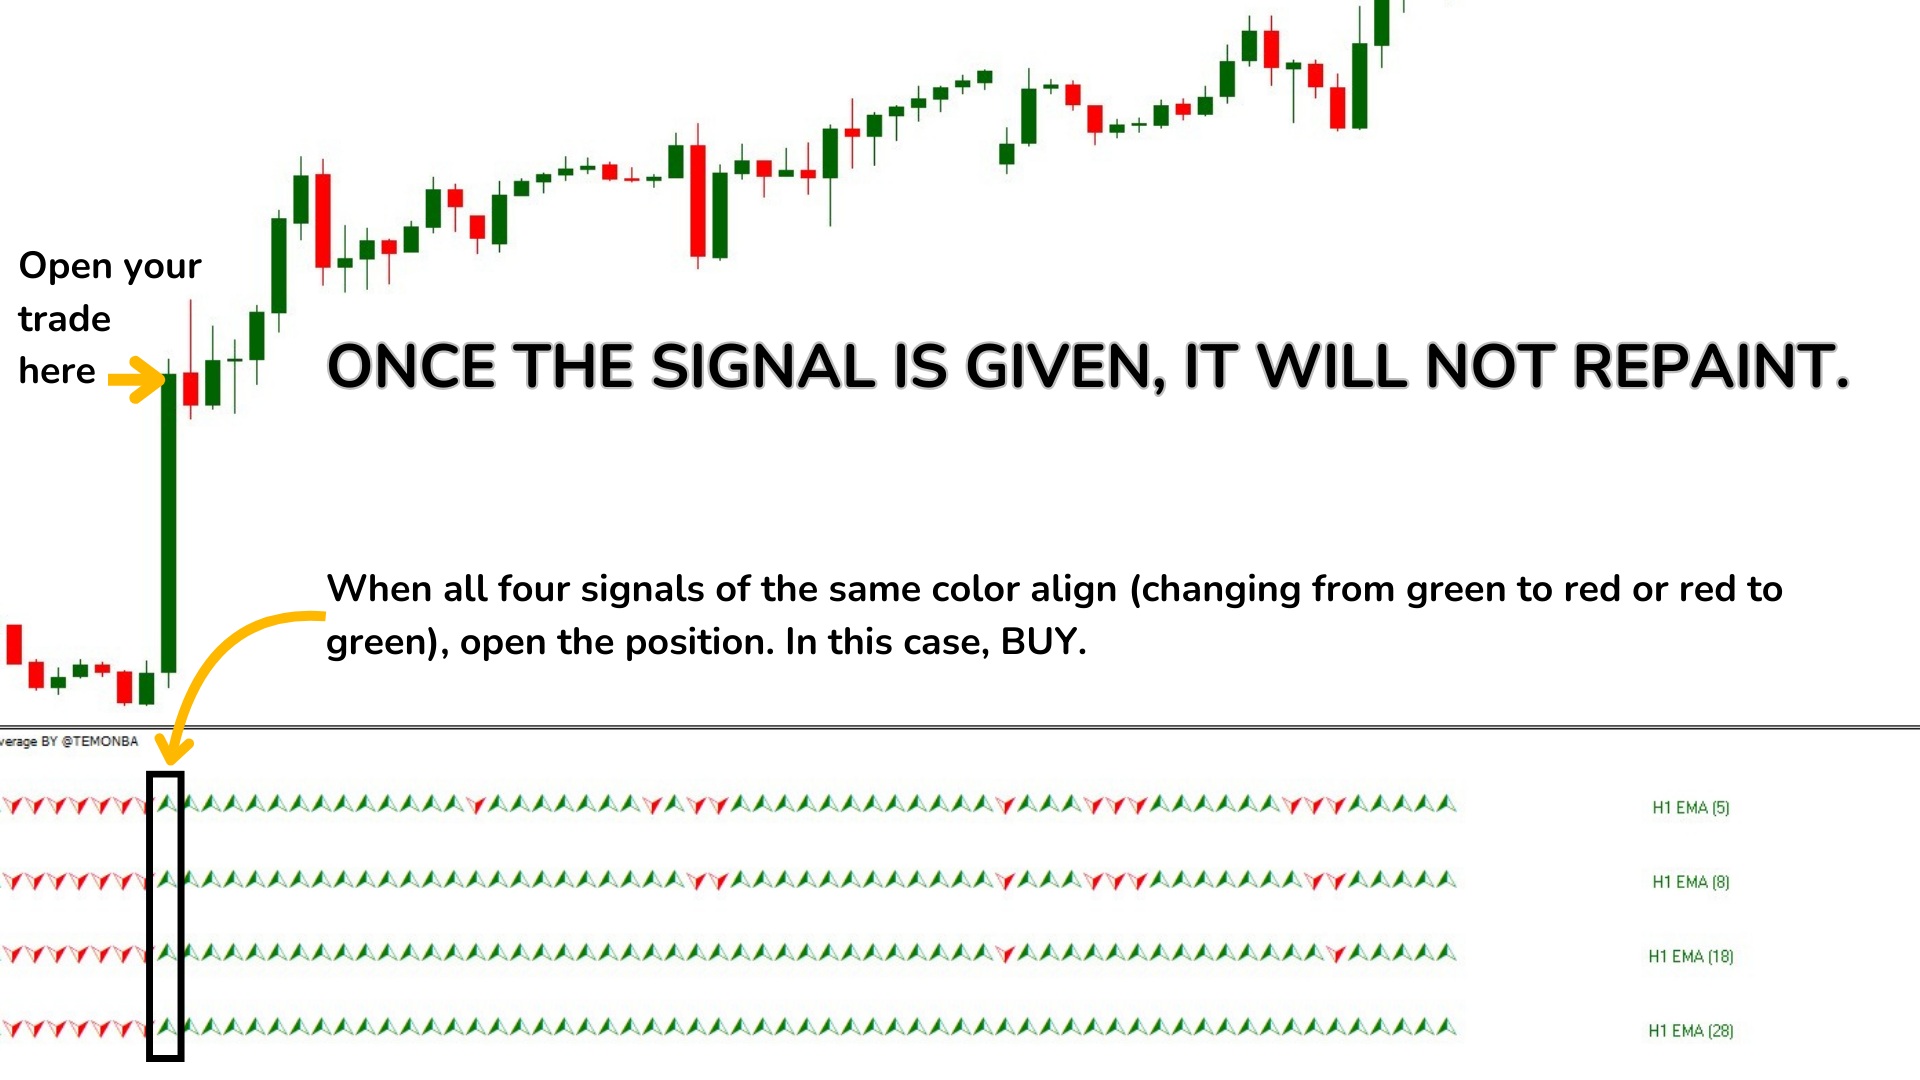
Punti Importanti: Versatilità: Utilizzabile in qualsiasi intervallo di tempo, dai minuti ai mesi, adatto sia per lo scalping sia per il trading a lungo termine. Non ridisegna: Una volta che un segnale (freccia verso l'alto o verso il basso) viene generato, non cambia colore, permettendo ai trader di affidarsi ai segnali generati per prendere decisioni di trading. Facile interpretazione: I segnali di acquisto e vendita sono chiaramente visualizzati con frecce verdi e rosse nell'indicatore inferiore, eliminando la necessità di analisi complesse. Configurabilità: Gli utenti possono regolare i parametri delle medie mobili per adattarsi alle loro strategie di trading specifiche.

Strategia Migliorata: Per effettuare ingressi sicuri, è consigliabile attendere che tutte e quattro le EMA cambino colore allo stesso tempo. Il miglior ingresso si fa sulla prima o seconda candela in cui le quattro EMA cambiano colore.

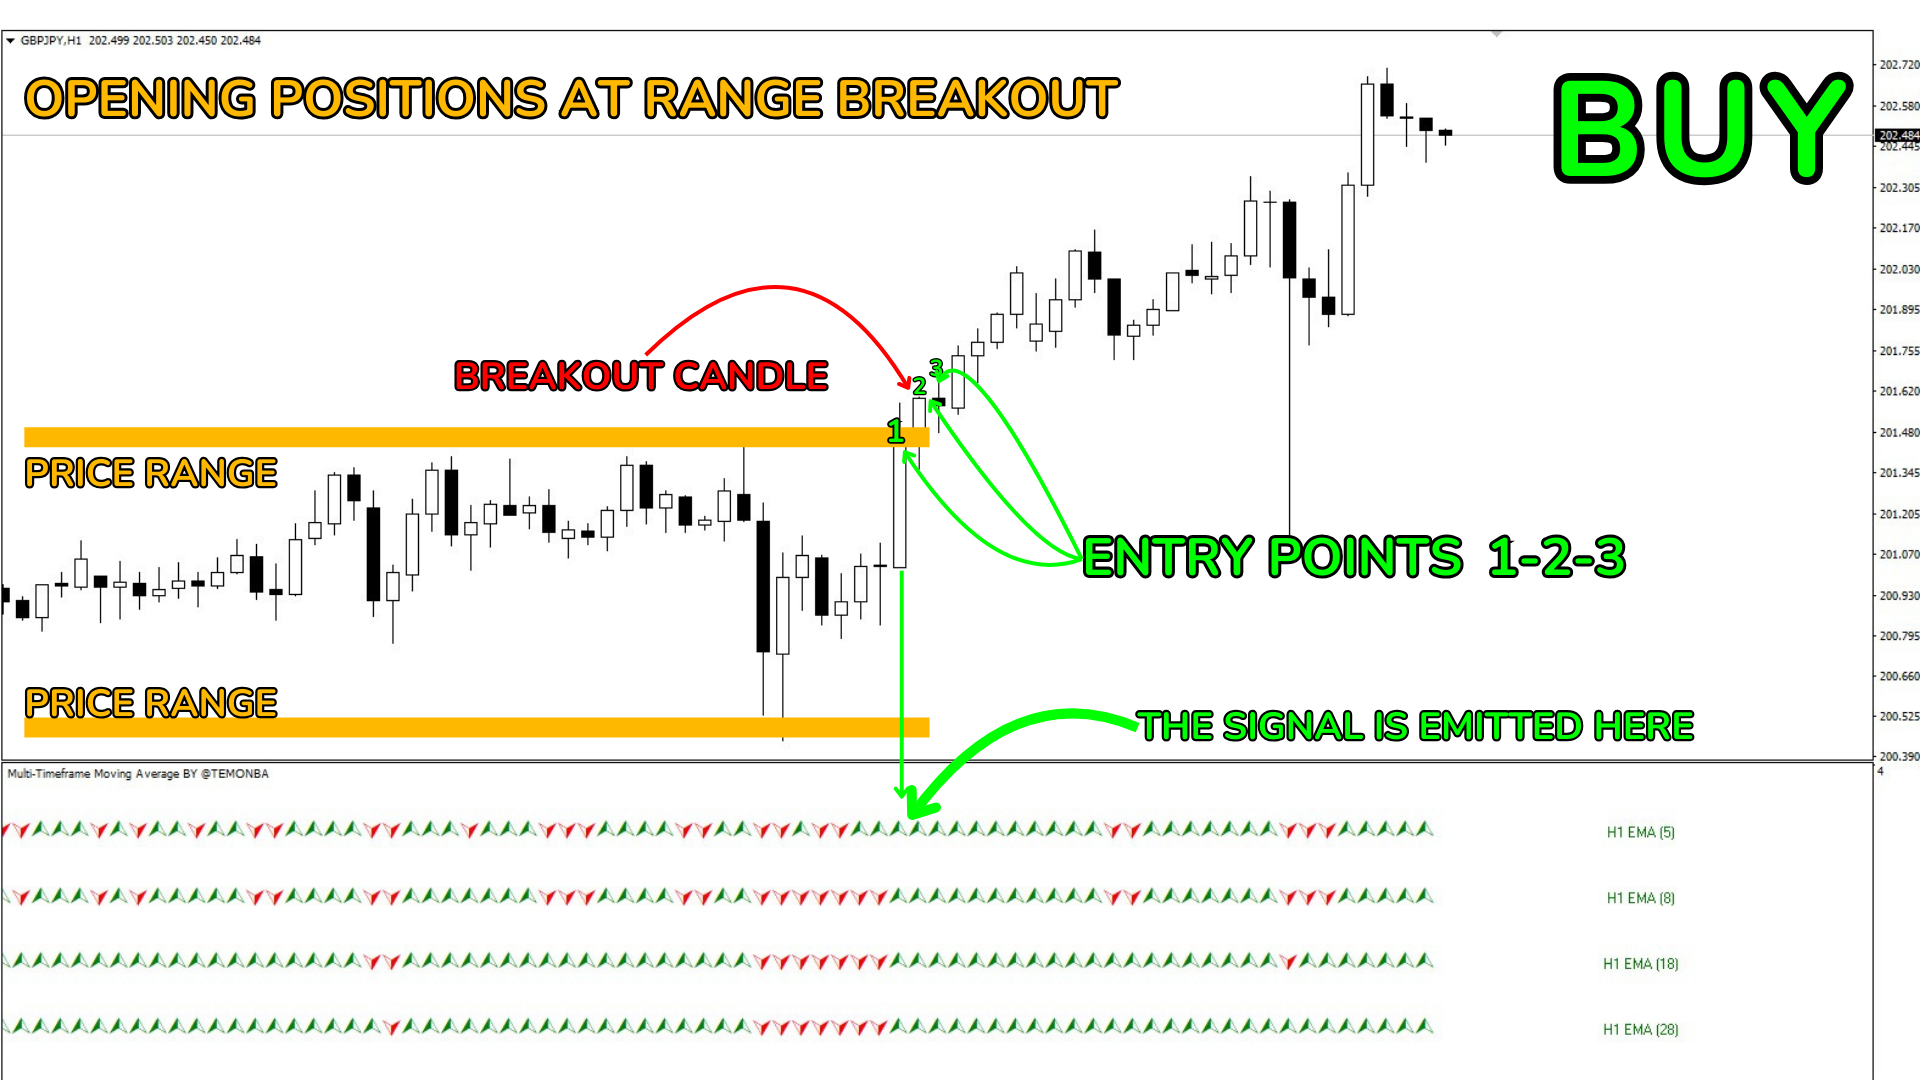
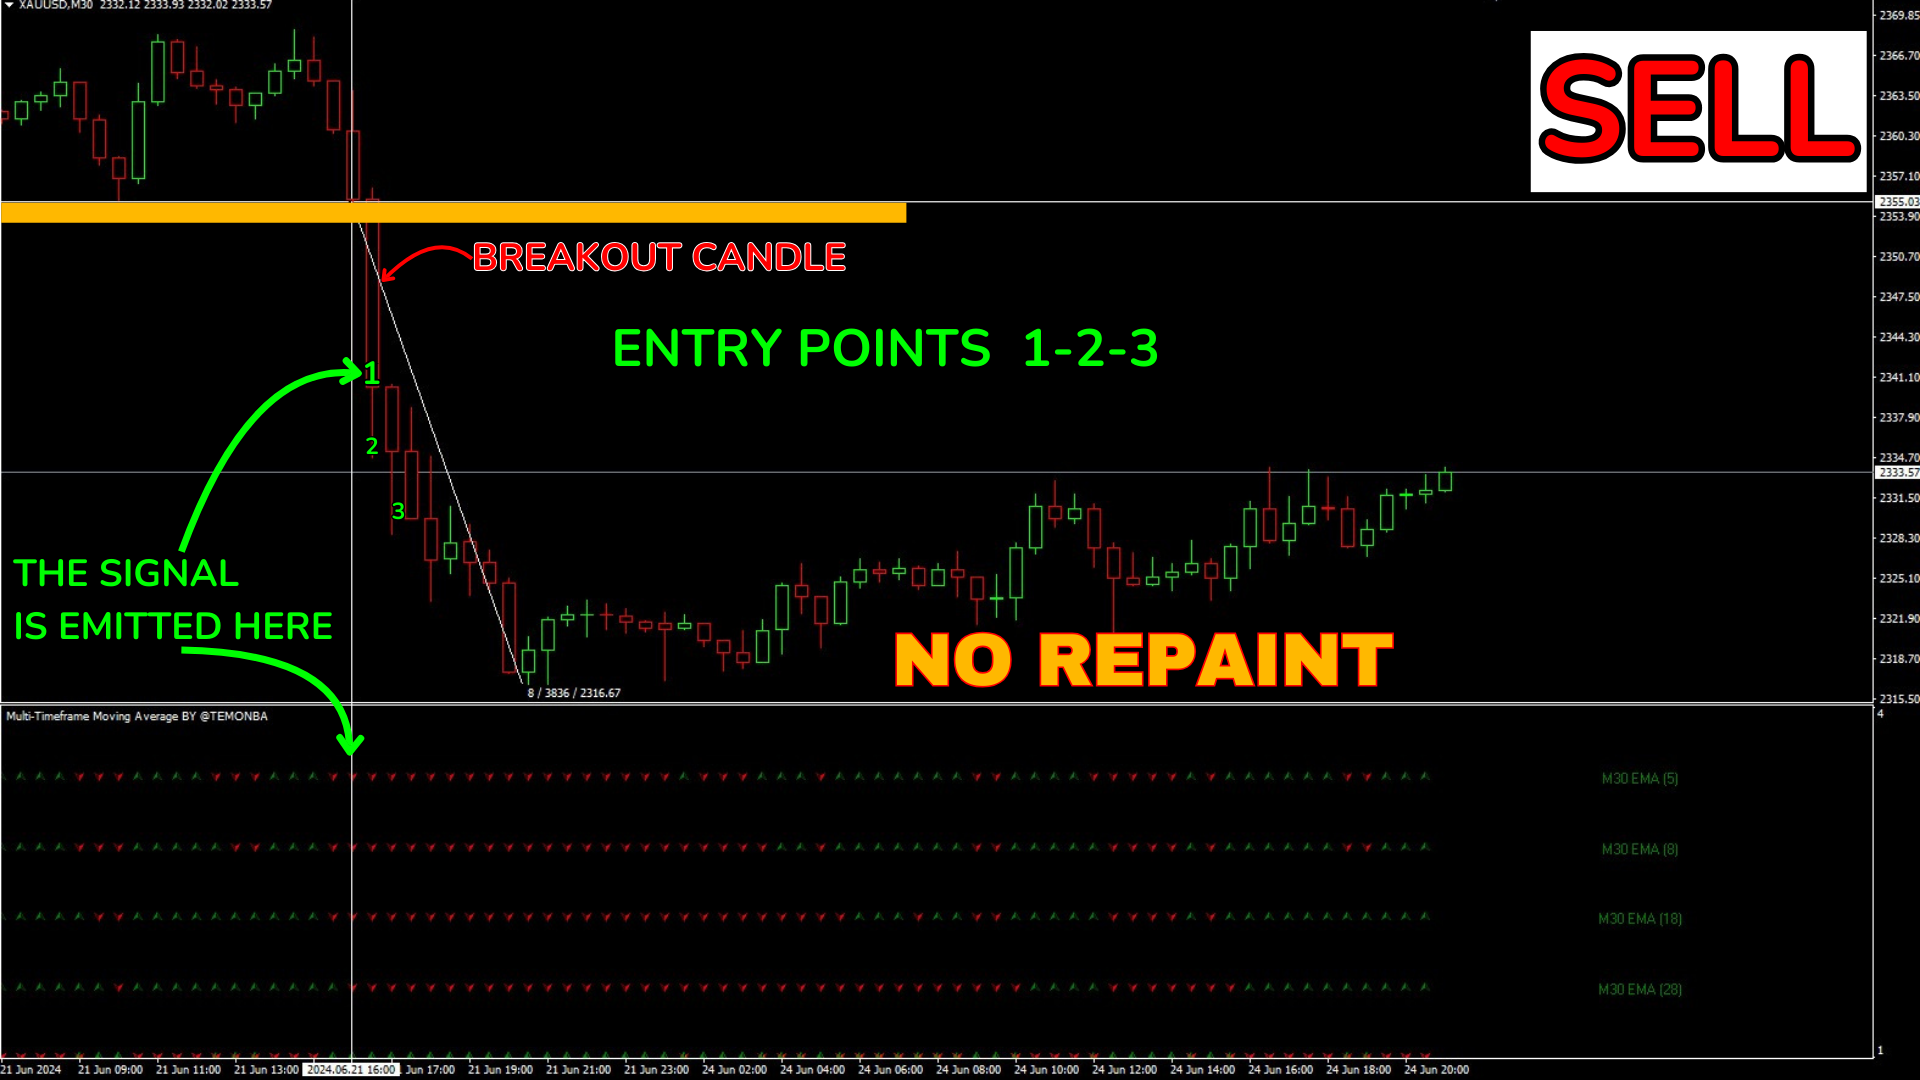
Solo se coincide con una rottura del range, è possibile aprire la posizione fino a 4 o anche 5 candele dopo la corrispondenza dei colori nelle 4 EMA. Voglio sottolineare che questo tipo di ingresso tardivo può essere effettuato solo se c'è stata una chiara rottura del range dei prezzi. Se non sei in grado di rilevarla, limitati a prendere i trade sulla prima o seconda candela.

In tutti i casi, evita di prendere trade in tendenze già avanzate (ad esempio, se sono passate 10 candele dello stesso colore), poiché le probabilità che la tendenza continui sono minori.

Quindi:

Acquisto: Tutte le EMA cambiano in verde. Vendita: Tutte le EMA cambiano in rosso.

Come Utilizzare l'Indicatore:

Per lo Scalping (Intervalli di Tempo Piccoli come M1, M5, M15):

Segnale di Acquisto e Segnale di Vendita: L'apertura deve essere effettuata a favore della tendenza delle EMA "candela per candela", aprendo trade brevi e ottenendo rapidamente pochi pips. Ovviamente, per eseguire questa tecnica è necessario avere un account di Scalping. Cioè, se vuoi fare scalping con un account Standard o Cent, capisci che non funzionerà, poiché alcune coppie hanno uno spread elevato. Usa solo account specifici per lo scalping (ECN o Zero Spread).

Per il Trading a Lungo Termine (Intervalli di Tempo Maggiori come H1, H4, D1):

Segnale di Acquisto: Tutte le EMA cambiano in verde. Effettua l'ingresso sulla prima candela in cui tutte e quattro le EMA sono verdi. Segnale di Vendita: Tutte le EMA cambiano in rosso. Effettua l'ingresso sulla prima candela in cui tutte e quattro le EMA sono rosse. Negli intervalli di tempo maggiori, i segnali saranno meno frequenti ma più significativi, permettendo di catturare movimenti di mercato più grandi e mantenere le posizioni per un periodo più lungo.

Come Prendere Trade se non Hai Esperienza:

Acquisto:

Aspetta che tutte le quattro EMA cambino in verde. Apri una posizione di acquisto (Buy) sulla prima candela in cui tutte le quattro EMA sono verdi. Imposta uno stop loss sotto l'ultimo supporto significativo. Chiudi la posizione o considera una vendita quando tutte le quattro EMA cambiano in rosso. Vendita:

Aspetta che tutte le quattro EMA cambino in rosso. Apri una posizione di vendita (Sell) sulla prima candela in cui tutte le quattro EMA sono rosse. Imposta uno stop loss sopra l'ultima resistenza significativa. Chiudi la posizione o considera un acquisto quando tutte le quattro EMA cambiano in verde. In sintesi, l'MTFMA è un indicatore potente e versatile. Sia per trader inesperti sia avanzati, è configurabile al 100% dai parametri esterni dell'indicatore.

Perché l'MTFMA non ridisegna? Calcolo basato su barre chiuse:

L'indicatore MTFMA calcola i suoi valori basandosi su barre chiuse e non su barre che si stanno formando attualmente. Nel codice interno, il calcolo viene effettuato in un ciclo che va da limit - 1 a 0, assicurando di lavorare con dati storici che non cambieranno.

Buffer di uscita e valori vuoti:

L'indicatore utilizza buffer (MA1_UP_Buffer, MA1_DN_Buffer, ecc.) per memorizzare i valori calcolati. Questi buffer vengono aggiornati ad ogni iterazione del ciclo e i valori vengono impostati solo se soddisfano determinate condizioni (ad esempio, se l'EMA attuale è maggiore o minore dell'EMA precedente). Una volta che un valore viene inserito nel buffer, non cambia, garantendo che i segnali generati in passato rimangano costanti.

Confronto dei valori delle medie mobili:

I segnali di acquisto e vendita vengono calcolati in base al confronto dei valori delle medie mobili nella barra attuale e nella barra precedente. Questi confronti vengono effettuati una volta che la barra si chiude, assicurando che i valori utilizzati per il confronto non cambino.

Assegnazione dei colori in base a condizioni fisse:

I colori delle etichette e dei segnali vengono assegnati in base a condizioni fisse (ad esempio, se l'EMA attuale è maggiore della precedente, viene impostato un valore specifico nel buffer del segnale). Queste assegnazioni non cambiano una volta effettuate, garantendo la coerenza dei segnali.

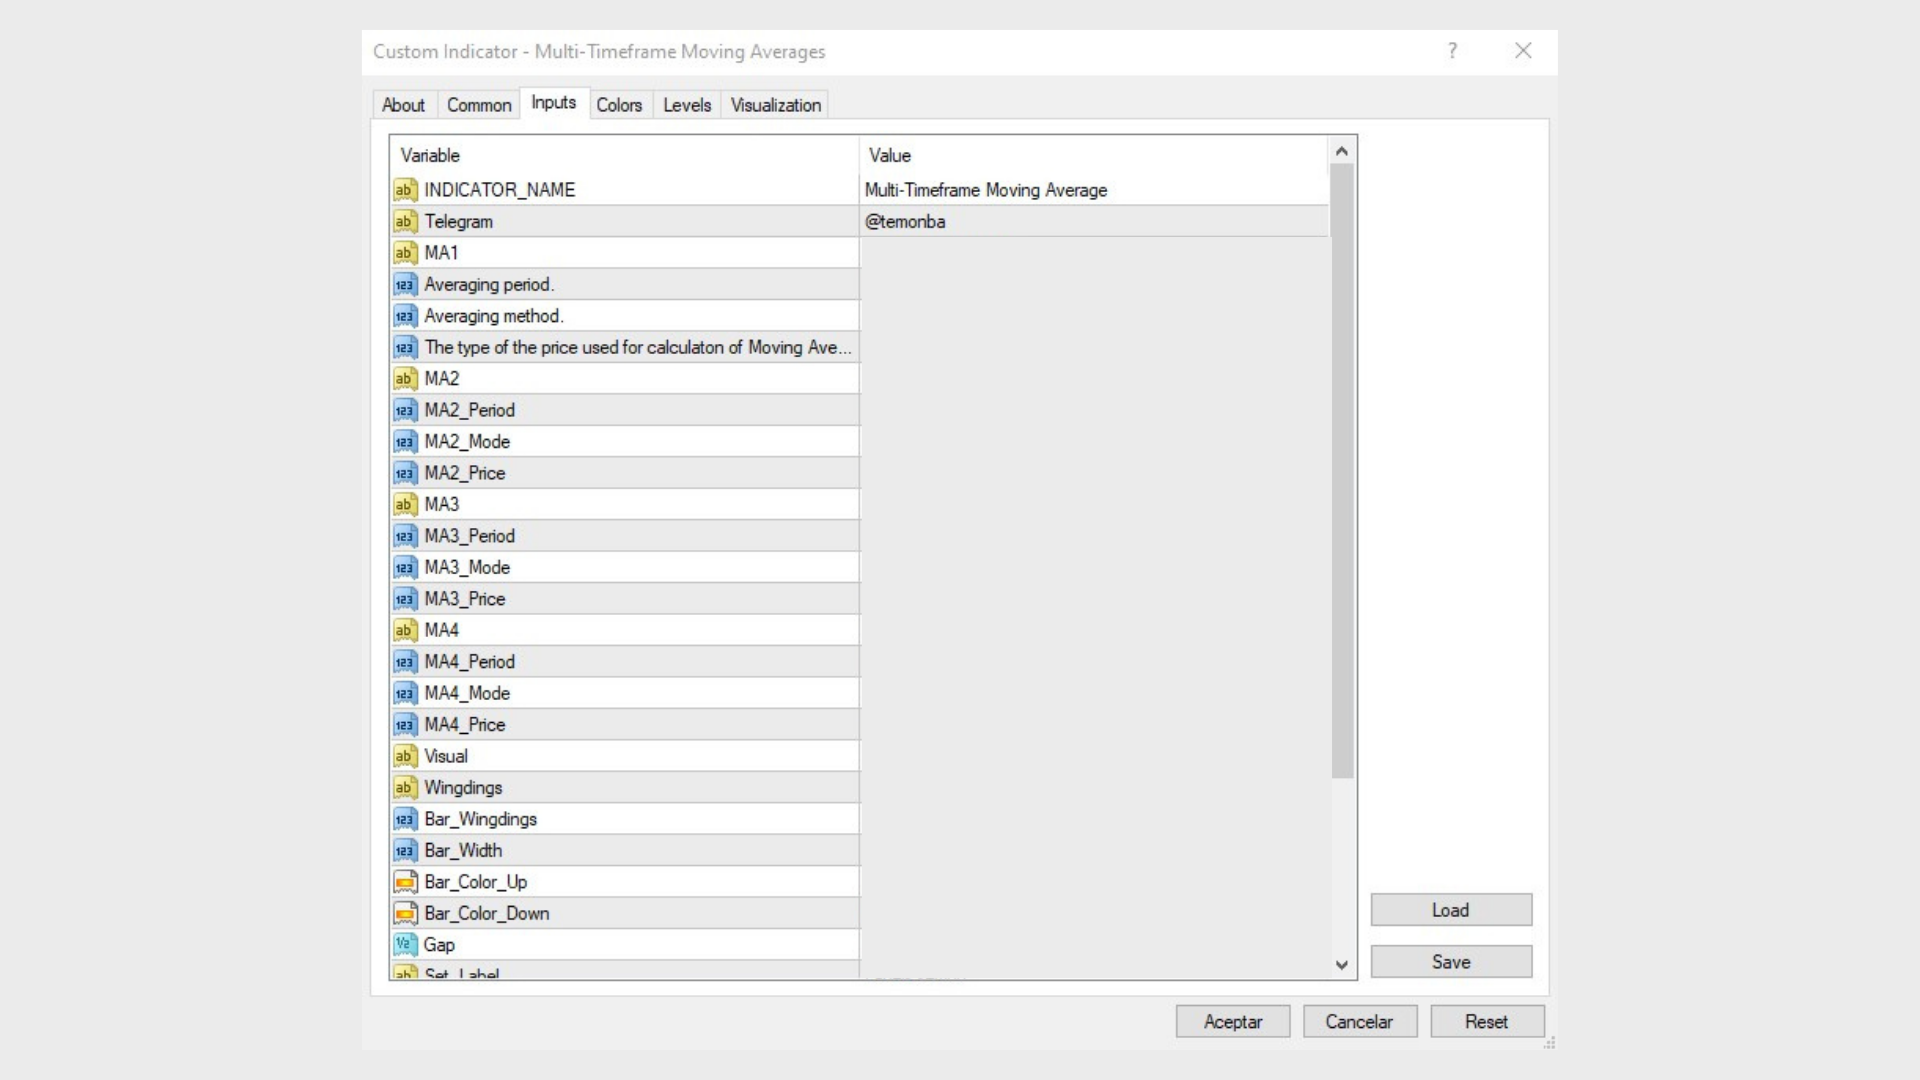
Parametri di Configurazione:

  1. MA1 (1ª Media Mobile) Periodo di media (MA1_Period): Il periodo di media per la prima media mobile. Questo parametro determina quanti periodi di dati verranno utilizzati per calcolare la media mobile. In questo caso, è 5. Metodo di media (MA1_Mode): Il metodo di media utilizzato per calcolare la media mobile. I valori tipici possono essere: 0: Media Mobile Semplice (SMA) 1: Media Mobile Esponenziale (EMA) 2: Media Mobile Semplice Smussata (SSMA) 3: Media Mobile Ponderata Lineare (LWMA) Il tipo di prezzo utilizzato per il calcolo della Media Mobile (MA1_Price): Il tipo di prezzo utilizzato per calcolare la media mobile. I valori tipici possono essere: 0: Prezzo di chiusura (Close) 1: Prezzo di apertura (Open) 2: Massimo (High) 3: Minimo (Low) 4: Prezzo medio (Median) 5: Prezzo tipico (Typical) 6: Prezzo ponderato (Weighted)
  2. MA2 (2ª Media Mobile) MA2_Period: Il periodo di media per la seconda media mobile. In questo caso, è 8. MA2_Mode: Il metodo di media utilizzato per calcolare la seconda media mobile. In questo caso, è EMA (1). MA2_Price: Il tipo di prezzo utilizzato per calcolare la seconda media mobile. In questo caso, è il prezzo ponderato (6).
  3. MA3 (3ª Media Mobile) MA3_Period: Il periodo di media per la terza media mobile. In questo caso, è 18. MA3_Mode: Il metodo di media utilizzato per calcolare la terza media mobile. In questo caso, è EMA (1). MA3_Price: Il tipo di prezzo utilizzato per calcolare la terza media mobile. In questo caso, è il prezzo ponderato (6).
  4. MA4 (4ª Media Mobile) MA4_Period: Il periodo di media per la quarta media mobile. In questo caso, è 28. MA4_Mode: Il metodo di media utilizzato per calcolare la quarta media mobile. In questo caso, è EMA (1). MA4_Price: Il tipo di prezzo utilizzato per calcolare la quarta media mobile. In questo caso, è il prezzo ponderato (6).
  5. Visuale (Parametri di visualizzazione) Wingdings: Selezione del tipo di simboli per le frecce che indicano i segnali di acquisto e vendita. 0: Rettangoli. 1: Frecce. Bar_Wingdings: Il tipo specifico di simbolo utilizzato. Bar_Width: La larghezza delle frecce o dei simboli visualizzati sul grafico. Bar_Color_Up: Il colore utilizzato per le frecce o i simboli verso l'alto (indicando acquisto). In questo caso, è verde. Bar_Color_Down: Il colore utilizzato per le frecce o i simboli verso il basso (indicando vendita). In questo caso, è rosso. Gap: La distanza verticale tra le frecce o i simboli sul grafico.
  6. Set_Label (Impostazioni delle etichette) Show_Label: Parametro booleano per mostrare o nascondere le etichette di testo. V_Label: Offset verticale per le etichette di testo. V_Shift: La quantità specifica di offset verticale. H_Label: Offset orizzontale per le etichette di testo. H_Shift: La quantità specifica di offset orizzontale. UP_DN (Colore della media mobile SU/GIÙ) Text_Color_UP: Il colore del testo quando le medie mobili indicano una tendenza rialzista. In questo caso, è verde. Text_Color_Down: Il colore del testo quando le medie mobili indicano una tendenza ribassista. In questo caso, è rosso.


Prodotti consigliati
ZhiBi Fast Scalp is a good fast scalping index system. The signal is oscillated according to the trend, and the Buy and Sell signals are frequently given. Suitable for all market varieties and time periods. The up arrow appears to place the order Buy; the down arrow appears to place the order Sell; Parameter setting description: [Signal_line_period]: The average period of the small cycle signal line. [Trend_line_period]: The average period of the large cycle trend line. [Alert_No_Off]: Open
"Adjustable Fractals" - is an advanced version of fractal indicator, very useful trading tool! As we know   Standard fractals mt4 indicator does not have settings at all   - this is very inconvenient for traders Adjustable Fractals has resolved that issue - it has all necessary settings: Adjustable period   of indicator (recommended values - above 7) Adjustable distance   from Highs/Lows of price Adjustable design   af fractal arrows // More great Expert Advisors and Indicators are available he
TrendWave Oscillator is an advanced MT4 oscillator that not only identifies the trend direction but also provides visual and audio alerts to enhance trading strategies. Key Features: - Color-coded trend indication:   - Blue : Indicates an uptrend, signaling potential price growth.   - Orange : Indicates a downtrend, suggesting possible price decline.   - Gray : Represents a flat market or lack of clear entry signals. - Graphical signals on the chart :   - Aqua : Highlights an uptrend, empha
This indicator Super Neuro Trend indicator.Indicator displays trend movement. Indicator helps to buy and sell. Features FiltPer- displays indicator period. deviation - displaus indicator deviation. Trend - displaus indicator trend.( true,false) Rectangle - displaus indicator rectangle. (true,false)  How to understand the status: If the trend color is green, trend is up. I f the trend color is red, trend is down. I f the trend waiting,trend waiting.     /////////////////////////////////////////
Boba Binary
Anthonius Soruh
5 (1)
Result look on  https://t.me/BonosuProBinary Pair : All Forex Pairs Time Frame : M1 Expaired : 1-2 Minutes Trade Time Once Time a Day Backtester, Alert Avaliable Average Signals Generate 5 - 20 Signals All Pair A Day Broker Time Zone GMT+3 Default Setting [Example Broker GMT+3 : Alpari, FBS, XM] Support Broker : Deriv, IQOption, Alpari, Binomo, Olymtrade, Qoutex, GCoption, etc Support Auto Trading : MT2 Trading, Binary Bot, Intrade Bot, Binomo Bot, Olymptrad Bot, MX2 trading, Price Pro, etc Ind
Cota Binary
Anthonius Soruh
5 (2)
Result look on  https://t.me/BonosuProBinary Pair : All Forex Pairs Time Frame : M1 Expaired : 1-2 Minutes Trade Time Once Time a Day Backtester, Alert Avaliable Average Signals Generate 5 - 20 Signals All Pair A Day Broker Time Zone GMT+3 Default Setting [Example Broker GMT+3 : Alpari, FBS, XM] Support Broker : Deriv, IQOption, Alpari, Binomo, Olymtrade, Qoutex, GCoption, etc Support Auto Trading : MT2 Trading, Binary Bot, Intrade Bot, Binomo Bot, Olymptrad Bot, MX2 trading, Price Pro, etc Ind
Adjustable Consecutive Fractals  looks for 2 or more fractals in one direction and sends out a on screen alert, sound alert and push notification, for strong reversal points . Adjustable Consecutive Fractals, shows the fractals on chart along with a color changing text for buy and sell signals when one or more fractals appear on one side of price. Adjustable Consecutive Fractals is based Bill Williams Fractals . The standard Bill Williams fractals are set at a non adjustable 5 bars, BUT withe
Buy and sell zones
Evgeniy Zhdan
5 (2)
Indicator for determining flat and trend. If the price is below any of the two histograms and two lines (red and blue), this is a sell zone. When purchasing this version of the indicator, MT5 version for one real and one demo account - as a gift (to receive, write me a private message)! If the price is above any of the two histograms and two lines (red and blue), this is a buy zone. MT5 version:  https://www.mql5.com/en/market/product/70409 If the price is between two lines or in the zone
Indicador Taurus All4
Fabio Oliveira Magalhaes
Taurus All4 Taurus All4 is a high-performance indicator, it will tell you the strength of the trend, and you will be able to observe the strength of the candle. Our indicator has more than 4 trend confirmations. It is very simple and easy to use. Confirmation Modes Candle Trend Confirmations: When the candle switches to light green the trend is high. When the candle switches to light red the trend is reverting down. When the candle changes to dark red the trend is low. Trendline Trend Conf
Champio
Ivan Simonika
It is extremely important for any trader to correctly determine the direction and strength of the trend movement. Unfortunately, the only true solution to this problem is missing. Many traders trade at various time intervals. For this reason, the received signals are perceived subjectively. Trend indicators provide an opportunity to classify the direction of price movement, determining its strength. Solving this problem helps investors to enter the market on time and get a good return. The
Provides Regression Channel on the current chart. Combined by Trend of Moving Averages and Multi timeframes Oscillator Indicators: CCI, RSI, Stochastic, and MACD with specific working logic . It could make us easier to identify swing high-low as an entry point, the retracement area while following the current trend. Consists of 2 types of signal, main and secondary. The main signal will draw very clearly triangle and lines on the chart with the word " BUY" or 'SELL'. and the secondary is the sta
The indicator automatically adjusts itself to any trading instrument and determines basic market conditions, such as: Flet, Trend, Overbought and Oversold Works on all timeframes, all currency pairs, metals and cryptov currencies Can be used when working with binary options Distinctive features It's not redrawn; Fast filtering of basic market conditions; Easy and clear settings; Works on all timeframes and all symbols; Suitable for trading currencies, metals, options and crypt currencies (B
About
Tatiana Savkevych
About - Forex indicator. This trend indicator is used to determine the current trend in price movement, making it clear in which direction it is better to open a position: buy or sell. The About trend indicator is displayed on the chart and moves in parallel with the price. The Forex About trend indicator allows you to determine in time a change in the direction of price movement, thereby minimizing the likelihood of capital loss. In trading practice, various combinations of About and other ind
GeoWprPro
Georgij Komarov
WPR by Profile, or WPR for Professionals Geo_WprPro is one of the well-known currency profile indicators. It simultaneously displays two WPR indicators with different parameters in the matrix form on all timeframes of multiple currency pairs forming the currency profile . As follows from the description, " WPR is a leading indicator that often goes ahead of the price chart. The oscillator frequently reaches extreme values before the price reversal as if anticipating that event: it almost always
ADR Alert Dashboard
LEE SAMSON
3.83 (12)
Il dashboard di avviso ADR ti mostra a colpo d'occhio dove il prezzo è attualmente scambiato in relazione al suo normale intervallo medio giornaliero. Riceverai avvisi istantanei tramite pop-up, e-mail o push quando il prezzo supera la sua gamma media e livelli superiori a tua scelta in modo da poter saltare rapidamente a pullback e inversioni. Il trattino è progettato per essere posizionato su un grafico vuoto e semplicemente sedersi in background e avvisarti quando i livelli vengono raggiunti
RoyalPrince Fibo
Richard Louis Pastor
4.88 (16)
Royal Prince Fibonacci , has the most advance Trend detection algorithm built into its Alert system combined with the RoyalPrince Non-repaint Arrows with it's own alert system you will never miss the opportunity of the trade.  2nd picture is how to use Guide on how i use it to Scalp or take long trades. works on all Charts and all Timeframe on mt4. ︎Best Timeframe M15 for scalping  H1 for Day Trading Options: • Fibonacci days High and Lows  • Fibonacci Targets • Fibonacci Alert System • Tren
[ZhiBiCCI] indicators are suitable for all cycle use, and are also suitable for all market varieties. [ZhiBiCCI] Green solid line is a reversal of bullish divergence. The green dotted line is a classic bullish divergence. [ZhiBiCCI] The solid line to the red is a reverse bearish divergence. The red dotted line is a classical bearish divergence. [ZhiBiCCI] can be set in the parameters (Alert, Send mail, Send notification), set to (true) to send instant signals to the alarm window, email, in
Supplement for Alpha Trend Spotter (ATS) Indicator: https://www.mql5.com/en/market/product/8590 This indicator acts by price action. Use it when ATS shows clear Bullish or Bearish Trend for finding the strongest trend each day. Suitable for timeframes M5, H1, H4 and D1. Suitable for Binary Option 5 minutes signal. How to Use: RED Arrow means Sell GREEN Arrow means Buy
HMA Trend Professional MT4
Pavel Zamoshnikov
4.57 (7)
Improved version of the free HMA Trend indicator (for MetaTrader 4) with statistical analysis. HMA Trend is a trend indicator based on the Hull Moving Average (HMA) with two periods. HMA with a slow period identifies the trend, while HMA with a fast period determines the short-term movements and signals in the trend direction. The main differences from the free version: Ability to predict the probability of a trend reversal using analysis of history data. Plotting statistical charts for analyz
Night ghost
Dmitriy Kashevich
Night Ghost - Indicatore a freccia per opzioni binarie. Questo è un assistente affidabile per te in futuro! - Nessun ridisegno sul grafico -Funziona alla grande su tutte le coppie di valute! -Precisione dell'indicatore fino al 90% (soprattutto di notte) -Non c'è bisogno di impostare per molto tempo (impostato perfettamente per le opzioni binarie) - Segnali non in ritardo - La comparsa di un segnale sulla candela corrente -Perfetto per il periodo M1 (non più!) - Colore della
TrendySignalMt4
Andrey Spiridonov
TrendySignalMt4l is a trend-following indicator that quickly responds to a trend change. The indicator forms the line so that it is always located above or below the chart depending on a trend. This allows using the indicator both for a trend analysis and setting stop loss and take profit. The indicator should be attached in the usual way. It works on any timeframe from M1 to MN and with any trading symbols. The indicator has no configurable inputs. Recommendations on working with the indicato
Free Lotus
Christophe Godart
Due to the huge success of the limited free version, the now low priced LOTUS version will continue being updated in the future. Optimal for Binary Options and Forex. For beginners and intermediates. Lotus is 100% non repaint. The strategy is based on 4 ADX parameters, including pivot points and candle patterns.  It is recommendable to combine the arrow with an moving average, Elliot waves indicator or Parabolic SAR. The main goal was to  keep it as simple as possible ! No useless oscillators
Gioteen Volatility Index (GVI)   - your ultimate solution to overcoming market unpredictability and maximizing trading opportunities. This revolutionary indicator helps you in lowering your losing trades due to choppy market movements. The GVI is designed to measure market volatility, providing you with valuable insights to identify the most favorable trading prospects. Its intuitive interface consists of a dynamic red line representing the volatility index, accompanied by blue line that indicat
Professional histogram (PH) è uno strumento altamente efficiente e affidabile per il trading di forex, CFD e opzioni binarie. Il PH è facile da usare e configura sia per principianti che per trader esperti. A differenza della maggior parte degli indicatori, Professional Histogram trova tendenze più lunghe e fornisce meno segnali falsi. Quando appare un segnale di acquisto o di vendita, viene attivato un avviso che consente di aprire una posizione in modo tempestivo ed evitare di sederti s
Forex Indicator " CCI with Dynamic OverSold/OverBought zones " for MT4. C ommodity Channel Index (CCI)   is excellent for   Momentum trading   into the trend direction. It   is great to take   Sell   entries from   dynamic OverBought zone and   Buy   entries from dynamic OverSold zone into the direction of main trend T his indicator is excellent to combine   with Price Action entries as well . D ynamic   OverBought zone - above yellow line Dynamic   OverSold zone - below blue line CCI oscill
This is a breakout Indicator for MT4 where you can open trades after a breakout has occurred. This indicator will draw blue boxes on the chart. You simply have to follow price until it breaks out of the box and make sure that the candle had closed above the breakout if its a buy trade and the candle must close below if its a sell trade. An alert will now pop up with suggested price entry and TP of 15 pips default. You can change TP Pis depending on your choice The indicator can trade almost any
XOatrline
Ainur Sharipov
5 (2)
The indicator is based on crosses of zeros, but their period is equated to the indicator ATR. An alternative to the XOATRHIST indicator with the channel display on the chart. More informative.  Closing a bar outside the channel forms an x or O. The indicator turns on the Alert option. Options: ATRPeriod  - period ATR for the calculation of steps. XOPips    - manual pips XOalert  - output of the signal to the terminal. XOnotification  - sending a signal to the mobile terminal. XOmail  -  send a
Others
Tatiana Savkevych
The Others indicator is a trend-type indicator. In those moments when you need to make a decision to enter a position and give the trader a direction. The indicator gives the trader the opportunity to visually determine which trend will be present at a particular time interval. These are auxiliary tools for technical analysis of the market. Recommended for use in conjunction with any of the oscillators. The main application of the Others indicator is to generate buy and sell signals. Determin
Gartley Projection D
Oleksandr Medviediev
3.71 (7)
The indicator identifies the harmonic patterns (XABCD) according to developments of H.M.Gartley ( "Profits in the Stock Market" , 1935г). It projects D-point as a point in the perspective projection (specify ProjectionD_Mode = true in the settings). Does not redraw. When a bar of the working timeframe closes, if the identified pattern point has not moved during Patterns_Fractal_Bars bars, an arrow appears on the chart (in the direction of the expected price movement). From this moment on, the ar
VR Cub
Vladimir Pastushak
VR Cub è un indicatore per ottenere punti di ingresso di alta qualità. L'indicatore è stato sviluppato per facilitare i calcoli matematici e semplificare la ricerca dei punti di ingresso in una posizione. La strategia di trading per la quale è stato scritto l'indicatore ha dimostrato la sua efficacia per molti anni. La semplicità della strategia di trading è il suo grande vantaggio, che consente anche ai trader alle prime armi di commerciare con successo con essa. VR Cub calcola i punti di apert
Gli utenti di questo prodotto hanno anche acquistato
FX Volume
Daniel Stein
4.58 (33)
Ricevi il tuo aggiornamento quotidiano sul mercato con dettagli e schermate tramite il nostro Morning Briefing qui su mql5 e su Telegram ! FX Volume è il PRIMO e UNICO indicatore di volume che fornisce una visione REALE del sentiment del mercato dal punto di vista del broker. Fornisce informazioni straordinarie su come gli operatori di mercato istituzionali, come i broker, sono posizionati sul mercato Forex, molto più velocemente dei rapporti COT. Vedere queste informazioni direttamente sul vo
Enigmera
Ivan Stefanov
5 (3)
ENIGMERA: Il cuore del mercato https://www.enigmera.com Introduzione Questo indicatore e sistema di trading rappresenta un approccio straordinario ai mercati finanziari. ENIGMERA utilizza i cicli frattali per calcolare con precisione i livelli di supporto e resistenza. Mostra l'autentica fase di accumulazione e fornisce direzione e obiettivi.  Un sistema che funziona sia in un trend che in una correzione.  Come funziona? ENIGMERA è composto da tre linee: la linea di supporto/resistenza, la
Atomic Analyst
Issam Kassas
5 (2)
Innanzitutto, vale la pena sottolineare che questo indicatore di trading non è repaint, non è ridisegno e non presenta ritardi, il che lo rende ideale sia per il trading manuale che per quello automatico. Manuale utente: impostazioni, input e strategia. L'Analista Atomico è un indicatore di azione del prezzo PA che utilizza la forza e il momentum del prezzo per trovare un miglior vantaggio sul mercato. Dotato di filtri avanzati che aiutano a rimuovere rumori e segnali falsi, e aumentare il pote
FX Power MT4 NG
Daniel Stein
5 (13)
Ricevi il tuo aggiornamento quotidiano sul mercato con dettagli e schermate tramite il nostro Morning Briefing qui su mql5 e su Telegram ! FX Power MT4 NG è la nuova generazione del nostro popolare misuratore di forza delle valute, FX Power. Cosa offre questo misuratore di forza di nuova generazione? Tutto ciò che avete amato dell'FX Power originale IN PIÙ Analisi della forza di ORO/XAU Risultati di calcolo ancora più precisi Periodi di analisi configurabili individualmente Limite di calcolo pe
Gann Swing Structure
Kirill Borovskii
5 (1)
This indicator is based on the mathematics of the great trader W.D. Ganna. With its help, you can easily find strong levels by analyzing swings to find the optimal entry point. The indicator works on all instruments and all timeframes. The indicator is fully manual and has control buttons. All you need to do is press the NEW button, a segment will appear, which you can place on any movement, swing or even 1 candle that you want to analyze. By placing the segment, press the OK button. A grid (th
Scalper Inside PRO
Alexey Minkov
4.73 (56)
An exclusive indicator that utilizes an innovative algorithm to swiftly and accurately determine the market trend. The indicator automatically calculates opening, closing, and profit levels, providing detailed trading statistics. With these features, you can choose the most appropriate trading instrument for the current market conditions. Additionally, you can easily integrate your own arrow indicators into Scalper Inside Pro to quickly evaluate their statistics and profitability. Scalper Inside
Dynamic Forex28 Navigator
Bernhard Schweigert
5 (1)
Dynamic Forex28 Navigator - Lo strumento di trading Forex di nuova generazione. ATTUALMENTE SCONTATO DEL 49%. Dynamic Forex28 Navigator è l'evoluzione dei nostri indicatori popolari di lunga data, che combinano la potenza di tre in uno: Advanced Currency Strength28 Indicator (695 recensioni) + Advanced Currency IMPULSE con ALERT (520 recensioni) + CS28 Combo Signals (Bonus). Dettagli sull'indicatore https://www.mql5.com/en/blogs/post/758844 Cosa offre l'indicatore di forza di nuova generazion
Attualmente 20% di sconto! La soluzione migliore per ogni principiante o trader esperto! Questo software per cruscotti funziona su 28 coppie di valute. Si basa su 2 dei nostri indicatori principali (Advanced Currency Strength 28 e Advanced Currency Impulse). Offre un'ottima panoramica dell'intero mercato Forex. Mostra i valori di forza delle valute avanzate, la velocità di movimento delle valute e i segnali per 28 coppie Forex in tutti i (9) timeframe. Immaginate come migliorerà il vostro t
TPSproTREND PrO
Roman Podpora
4.79 (19)
TPSpro TREND PRO   è un indicatore di tendenza che analizza automaticamente il mercato, fornisce informazioni sulla tendenza e sui rispettivi cambiamenti e fornisce segnali per entrare nelle operazioni senza ridisegnare. L'indicatore utilizza ciascuna candela e la analizza separatamente. Si riferisce a vari shock al rialzo o al ribasso. Punto di ingresso preciso per il trading di valute, criptovalute, metalli, azioni e indici! Versione MT5                   Descrizione completa dell'indicatore
Vi presentiamo ON Trade Waves Patterns Harmonic Elliot Wolfe, un indicatore avanzato progettato per rilevare vari tipi di pattern sul mercato utilizzando metodi sia manuali che automatici. Ecco come funziona: Pattern Armonici: Questo indicatore è in grado di individuare pattern armonici che appaiono sul vostro grafico. Questi pattern sono fondamentali per i trader che praticano la teoria del trading armonico, come descritta nel libro di Scott Carney "Harmonic Trading vol 1 & 2". Che li disegniat
TPA True Price Action indicator reveals the true price action of the market makers through 100% non-repainting signals (except early signals mode) strictly at the close of a candle! TPA shows entries and re-entries, every time the bulls are definitely stronger than the bears and vice versa. Not to confuse with red/green candles. The shift of power gets confirmed at the earliest stage and is ONE exit strategy of several. There are available now two free parts of the TPA User Guide for our custo
TPSpro RFI Levels
Roman Podpora
4.82 (22)
ISTRUZIONI       RUS   -   INGLESE       Si   consiglia di utilizzare con un indicatore       -       TPSpro   TENDENZA PRO -   Versione MT4         Un elemento chiave nel trading sono le zone o i livelli da cui vengono prese le decisioni di acquisto o vendita di uno strumento di trading. Nonostante i tentativi dei principali attori di nascondere la loro presenza sul mercato, lasciano inevitabilmente delle tracce. Il nostro compito era imparare a identificare queste tracce e interpretarle corre
Currency Strength Exotics
Bernhard Schweigert
4.87 (30)
ATTUALMENTE SCONTATO DEL 20%! La soluzione migliore per qualsiasi principiante o trader esperto! Questo indicatore è specializzato nel mostrare la forza della valuta per qualsiasi simbolo come coppie esotiche, materie prime, indici o futures. È il primo nel suo genere, qualsiasi simbolo può essere aggiunto alla nona riga per mostrare la vera forza della valuta di Oro, Argento, Petrolio, DAX, US30, MXN, TRY, CNH ecc. Si tratta di uno strumento di trading unico, di alta qualità e conveniente
MetaBands M4
Vahidreza Heidar Gholami
5 (2)
MetaBands uses powerful and unique algorithms to draw channels and detect trends so that it can provide traders with potential points for entering and exiting trades. It’s a channel indicator plus a powerful trend indicator. It includes different types of channels which can be merged to create new channels simply by using the input parameters. MetaBands uses all types of alerts to notify users about market events. Features Supports most of the channel algorithms Powerful trend detection algorith
Gold Channel is a volatility-based indicator, developed with a specific timing algorithm for the XAUUSD pair, which consists of finding possible corrections in the market. This indicator shows two outer lines, an inner line (retracement line) and an arrow sign, where the theory of the channel is to help identify overbought and oversold conditions in the market. The market price will generally fall between the boundaries of the channel. If prices touch or move outside the channel it is a tra
Automated Trendlines
Georgios Kalomoiropoulos
5 (16)
Le linee di tendenza sono lo strumento più essenziale di analisi tecnica nel forex trading. Sfortunatamente, la maggior parte dei trader non li disegna correttamente. L'indicatore automatizzato delle linee di tendenza è uno strumento professionale per i trader seri che ti aiuta a visualizzare il movimento di tendenza dei mercati. Esistono due tipi di linee di tendenza, linee di tendenza rialziste e linee di tendenza ribassiste. Nella tendenza rialzista, la linea di tendenza Forex viene t
Reversal Sniper is designed to find the extreme reversals of the price. Indicator collects data of Cycle Sniper Indicator. NOTE: REVERSAL SNIPER Indicator is made for Cycle Sniper Users as an additional tool.  However, it can be used by the traders who look for finding out strong reversal levels. Indicator works on all timeframes and all instruments. Reversal  Sniper  Checks: Harmonic Patterns RSI Zig Zag and Harmonic Swings Cycle Sniper Indicator's Buy / Sell Signals The complex algo i
SI PREGA DI LEGGERE LE INFORMAZIONI QUI SOTTO PRIMA DI ACQUISTARE IL PRODOTTO! Apollo Pips PLUS SP è un prodotto unico! È PER CHI VUOLE OTTENERE IL MIO NUOVO INDICATORE "APOLLO PIPS" PIÙ IL BONUS "SUPER PACK" CON ACCESSO A TUTTI I MIEI INDICATORI DI TRADING! Acquistando il prodotto Apollo Pips PLUS SP stai effettivamente acquistando una versione assolutamente nuova del mio indicatore Apollo Pips. Questa versione dell'indicatore ha un algoritmo migliorato e un parametro facile da usare che ti dà
Introducing the South African Sniper indicator created by a small group of traders with a few years trading trading the financial market profitably . This is a plug and play indicator that provides you with  BUY and SELL (SNIPER ENTRY) signals with TARGET and trail stops. The indicator Works with all MT4 trading instruments. The indicator uses previous  chart data as receipt to speculate on future market moves.
Questo cruscotto mostra gli ultimi pattern armonici disponibili per i simboli selezionati, in modo da risparmiare tempo ed essere più efficienti / versione MT5 . Indicatore gratuito: Basic Harmonic Pattern Colonne dell'indicatore Symbol : vengono visualizzati i simboli selezionati Trend: rialzista o ribassista Pattern: tipo di pattern (gartley, butterfly, bat, crab, shark, cypher o ABCD) Entry: prezzo di ingresso SL: prezzo di stop loss TP1: 1 prezzo di take profit TP2: 2 prezzo di take
Ultimate Gold Advisor per MetaTrader 4 L'Ultimate Gold Advisor è uno strumento tecnologico avanzato progettato per ottimizzare l'esperienza di trading su MetaTrader 4. Progettato per rispondere alle esigenze dei trader più esperti, questo indicatore combina precisione, analisi sofisticata e funzionalità versatili, offrendo supporto per decisioni di trading informate. Ideale per il trading sull'oro, ma utilizzabile anche su una vasta gamma di asset, l'Ultimate Gold Advisor può aiutarti a miglior
Order Block Hunter
Noha Mohamed Fathy Younes Badr
5 (6)
Order block hunter indicator is the best indicator for  hunt the order blocks that area where there has been a large concentration of limit orders waiting to be executed Order blocks are identified on a chart by observing previous price action and looking for areas where the price experienced significant movement or sudden changes in direction .This indicator does that for you by using very complicated codes and helps you to take the best areas To buy and sell because it make marks at the best a
Sneaky Busters 4
Mushfiq Faysal
5 (2)
Previous Price : $323.00 Current Price: $359.00 Future Price: Will increase soon NOTICE Please DO NOT buy this indicator if you are just learning about smart money movement . You need to have some experience with accumulation and distribution to fully grasp the gravity of this indicator. Since smart money does not play by the book , so this indicator was only developed to find their trail that they did not bother to hide . If the signals do not correspond to your trading style, this is not the
Cycle Sniper
Elmira Memish
4.39 (36)
NEW YEAR SALE PRICE FOR LIMITED TIME!!! Please contact us after your purchase and we will send you the complimentary indicators to complete the system Cycle Sniper is not a holy grail but when you use it in a system which is explained in the videos, you will feel the difference. If you are not willing to focus on the charts designed with Cycle Sniper and other free tools we provide, we recommend not buying this indicator. We recommend watching the videos about the indiactor and system before pu
ATTUALMENTE SCONTATO DEL 26% La soluzione migliore per ogni principiante o trader esperto! Questo indicatore è uno strumento di trading unico, di alta qualità e conveniente perché abbiamo incorporato una serie di caratteristiche proprietarie e una nuova formula. Con un solo grafico è possibile leggere la forza delle valute per 28 coppie Forex! Immaginate come migliorerà il vostro trading perché sarete in grado di individuare l'esatto punto di innesco di una nuova tendenza o di un'opportunit
Advanced Supply Demand
Bernhard Schweigert
4.91 (295)
CURRENTLY 26% OFF !! Best Solution for any Newbie or Expert Trader! This indicator is a unique, high quality and affordable trading tool because we have incorporated a number of proprietary features and a new formula. With this update, you will be able to show double timeframe zones. You will not only be able to show a higher TF but to show both, the chart TF, PLUS the higher TF: SHOWING NESTED ZONES. All Supply Demand traders will love it. :) Important Information Revealed Maximize the potenti
TrendMaestro
Stefano Frisetti
5 (3)
nota: questo indicatore e' per METATRADER4, se vuoi la versione per  METATRADER5 questo e' il link:  https://www.mql5.com/it/market/product/108123 TRENDMAESTRO ver 2.4 TRENDMAESTRO riconosce un nuovo TREND sul nascere, non sbaglia mai. La sicurezza di identificare un nuovo TREND non ha prezzo. DESCRIZIONE TRENDMAESTRO identifica un nuovo TREND sul nascere, questo indicatore prende in esame la volatilita' i volumi ed il momentum per identificare il momento in cui c'e' un'esplosione di uno 
Up down v6T
Guner Koca
5 (2)
Thise indicator is up down v6  comes with tradingwiev pinescript. purchased people, after installed on terminal ,contact me on mql5  to get BONUS  TradingView pinescript. up-down indicator is no repaint and works all pairs and lower than weekly time frames charts. it is suitable also 1 m charts for all pairs. and hold long way to signal. dont gives too many signals. when red histogram cross trigger line that is up signal.and price probably will down when blue histogram cross trigger line that
A top and bottom indicator that can intuitively identify the trend of the band. It is the best choice for manual trading, without redrawing or drifting. How to get this indicator for free: Learn more Price increase of $20 every 3 days, price increase process: 79--> 99 --> 119...... Up to a target price of $1000. For any novice and programming trading friend, you can write the signal into the EA to play freely. Array 3 and array 4, for example, 3>4 turns green, 3<4 turns red. If you don't underst
Ranging Market Detector
Innovicient Limited
5 (2)
Ranging Market Detector scans the market for momentum and price to check whether the price is range- bound and the direction to which it will breakout.  It works with all the  all assets and visually shows you the instances when the market is either ranging or trending. Informs when the price has finished a retracement, an opportune time to re-enter the trend early. This will help you in position management.  It works very well for Scalping, Day trading, and Swing trading. Helpful in all timefra
Altri dall’autore
Pairs and TF Changer
Martin Alejandro Bamonte
Sei stanco di passare da un grafico all'altro per monitorare diverse coppie di valute e timeframe? L'indicatore Pairs and TF Changer è qui per rivoluzionare la tua esperienza di trading! Una volta caricati tutti gli indicatori per la tua strategia, aggiungi Pairs and TF Changer al grafico. Se necessario, puoi quindi regolare la sua posizione, i colori o il numero di colonne visualizzate! Caratteristiche principali: Integrazione senza soluzione di continuità: Integra facilmente questo indicatore
NextCandlePredictor No Repaint
Martin Alejandro Bamonte
1 (1)
Indicatore NextCandlePredictor NextCandlePredictor, un indicatore di segnale con allerta che non ridisegna, non cambia colore, non si muove, non scompare e non ha ritardi. Ti aiuterà a identificare la direzione delle prossime candele in qualsiasi timeframe. Altamente raccomandato per i mercati ad alta volatilità come New York, Londra o anche la sovrapposizione di entrambi. Caratteristiche Principali: Versatilità nei Timeframe: Fornisce segnali rapidi e precisi in qualsiasi timeframe, da M1 a H1
Clear Breakout
Martin Alejandro Bamonte
5 (1)
L'indicatore "Breakout Buy-Sell" è progettato per identificare e evidenziare potenziali opportunità di acquisto e vendita basate su breakout di prezzo durante diverse sessioni di mercato (Tokyo, Londra e New York). Questo indicatore aiuta i trader a visualizzare chiaramente le zone di acquisto e vendita, nonché i livelli di take-profit (TP) e stop-loss (SL). Strategia di utilizzo L'indicatore può essere utilizzato come segue: Impostazione iniziale : Seleziona la sessione di mercato e regola il G
BullsEye Signal NoRepaint
Martin Alejandro Bamonte
3 (2)
BullseyeSignal – NoRepaint è un segnale che, come suggerisce il nome, non si ridisegna mai in nessuna circostanza. Il segnale viene emesso sulla stessa candela osservata nell'immagine. È ideale per mercati altamente volatili come il forex, le criptovalute, le azioni, gli indici e i futures. Vedrai solo una freccia verde per l'acquisto e una freccia rossa per la vendita, ma ci sono molti indicatori che lavorano insieme dietro di essi per fornire un'esperienza di trading più semplificata. È specif
L'indicatore "MultiSymbol & TF Chart Integrated" è progettato per fornire una visione completa del mercato rapidamente, permettendoti di monitorare fino a 60 coppie di valute nei timeframe preferiti su un unico grafico (modalità multipla) o visualizzare la coppia che stai negoziando su tutti i TF (modalità semplice). Vantaggi Principali: Monitoraggio Completo: Permette di monitorare in tempo reale tutte le coppie desiderate su un unico grafico a colpo d'occhio. Risparmio di Tempo: Evita la nece
Aurum Apex Mt4 EA
Martin Alejandro Bamonte
5 (1)
Descrizione di Aurum Apex EA Aurum Apex EA è un potente strumento di trading automatico al 100% progettato per la piattaforma MT4. Analizza il mercato in tempo reale e rileva varie opportunità di trading. Adatto a tutti i livelli di trader, Aurum Apex EA offre tre modalità di rischio regolabili tramite il parametro di Rischio: Rischio = 0.1 (Basso Rischio): Ideale per i nuovi trader poco familiari con i movimenti dell'oro. Questa impostazione minimizza le sorprese mentre aumenta la fiducia. Ris
Scalping Signal NO Repaint NO Lag
Martin Alejandro Bamonte
5 (1)
"Scalping Signal No Repaint No Lag" è l'unico indicatore sul mercato che, quando trascinato su qualsiasi grafico, carica automaticamente tutti gli indicatori necessari senza la necessità di caricare alcun template o altri indicatori. Configura automaticamente il grafico in modo che appaia esattamente come nell'immagine fornita. Questo indicatore garantisce segnali senza ridisegno né ritardo, rendendolo ideale per strategie di scalping su tutte le coppie di valute e su tutti i timeframe (TF). Fun
GbpUsd Pip Hunter EA
Martin Alejandro Bamonte
GBPUSD Pip Hunter EA Caratteristiche principali: Ottimizzato per GBPUSD su M15: Progettato e testato specificamente per la coppia GBPUSD su un grafico a 15 minuti. Dimensione minima del conto consigliata: Richiede un saldo minimo del conto di $1000 per garantire drawdown bassi. Compatibilità degli spread: Miglior utilizzato con conti a spread basso o ECN per massimizzare la redditività. Gestione del rischio: Include un'opzione per disattivare la funzione di Lotto Esponenziale impostandola a 1.0,
GO Trend MultiTimeFrame
Martin Alejandro Bamonte
Indicatore GoTrend Multi-Timeframe L'indicatore "GoTrend Multi-Timeframe" è uno strumento essenziale per i trader che cercano un modo rapido ed efficiente per valutare le tendenze generali e specifiche di una coppia di valute su diversi timeframe. Questo indicatore consente ai trader di ottenere una visione chiara e completa della direzione del mercato a colpo d'occhio, ottimizzando il processo decisionale e migliorando l'efficacia delle loro strategie di trading. Caratteristiche Principali: Ana
Gold Vertex EA
Martin Alejandro Bamonte
Gold Vertex EA is a reliable and stable option for those looking to automate their trading in the gold market. With a robust system based on one of the most effective indicators and a solid trend-following strategy, Gold Vertex EA is a powerful tool for traders who want precise, worry-free trading. Requirements Platform : MetaTrader 4 Supported Instruments : Specifically developed and configured for Gold (XAUUSD) Recommended Account Type : ECN or low spread Minimum Deposit Recommended : $100 Tim
Filtro:
Nessuna recensione
Rispondi alla recensione