Multi timeframe moving average EVWMA by William210
- Indicatori
- Gerard Willia G J B M Dinh Sy
- Versione: 1.1
- Attivazioni: 5
=== > Cosa fa questo indicatore?
Come molti dei miei codici, è multi timeframe.
Traccia una singola media EVWMA con la scelta dell'intervallo temporale
Fornisco gratuitamente i codici per avere più EVWMA in un unico script con icustom se necessario su richiesta
L'EVWMA, o media mobile del periodo elastico ponderato per il volume, è un indicatore tecnico che aiuta a identificare le tendenze del mercato regolando automaticamente il periodo della media mobile in base al volume degli scambi.
Metti questo indicatore sui tuoi grafici tutte le volte che ti servono per calcolare la media.
Scegli i parametri e le caratteristiche della tua media e il gioco è fatto!!!
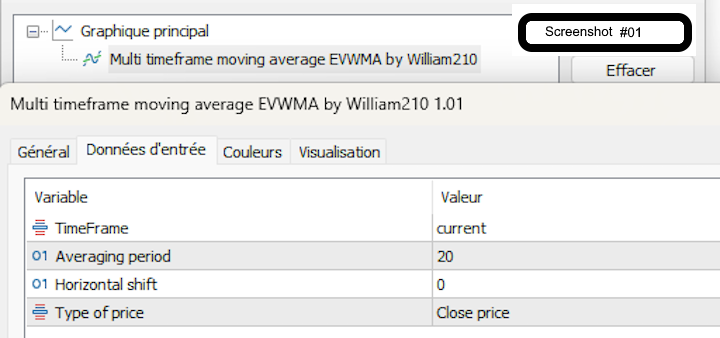
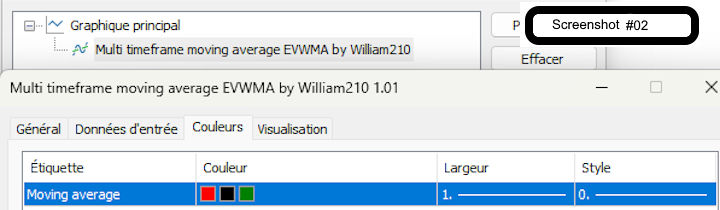
**** Vedi screenshot da 01 a 02
Quando si tratta di dati ricchi, verranno codificati, altri indicatori o EA
Scegliere
La cornice temporale bersaglio
Il nome del periodo
È decalcomania
Il design dell'OHLC
Colora la tendenza
Per non parlante di "William210".
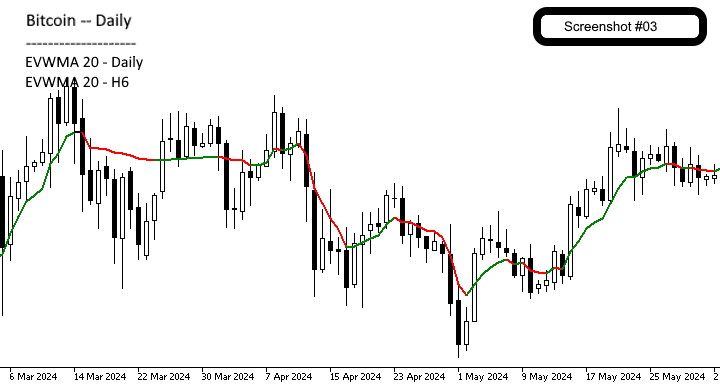
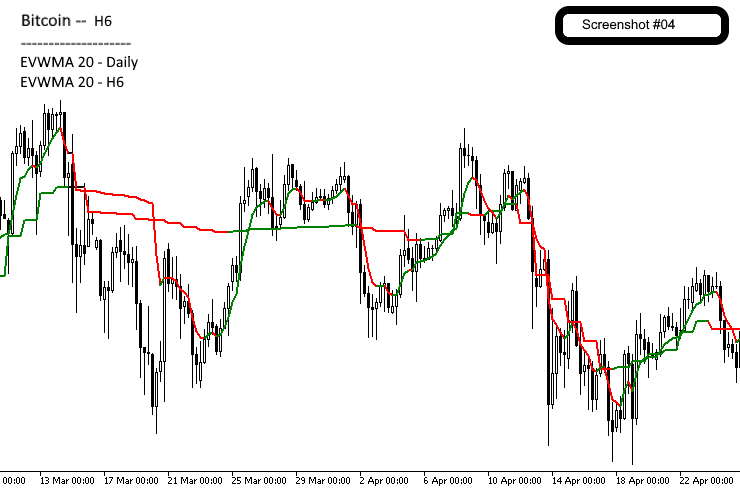
=== > Alcuni esempi
Inoltre, è semplice utilizzare la media mobile multi-intervallo temporale
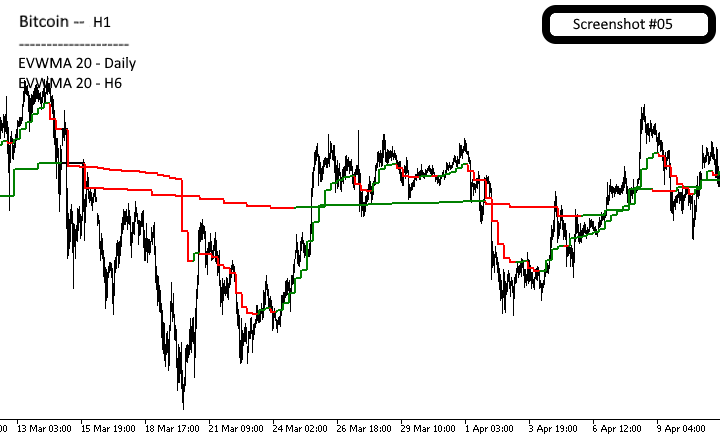
Esempio di Bitcoin
Aggiungi 2 mesi di cellulare 20, uno sulla fascia oraria giornaliera e uno sull'H6 e custodisci l'H1
**** Vedi screenshot da 3 a 5
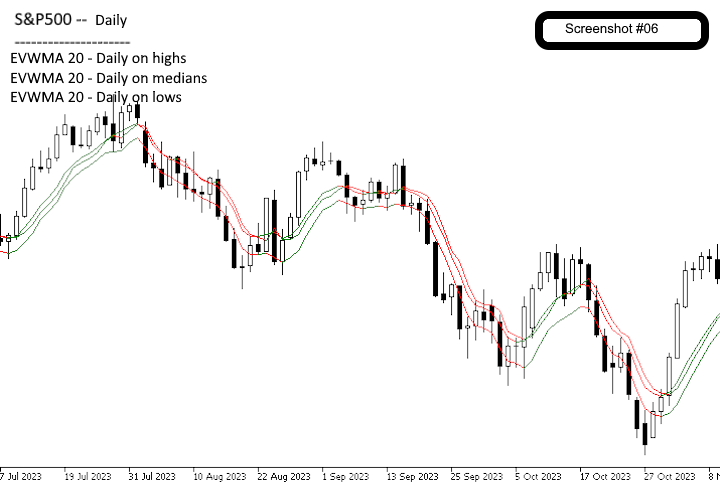
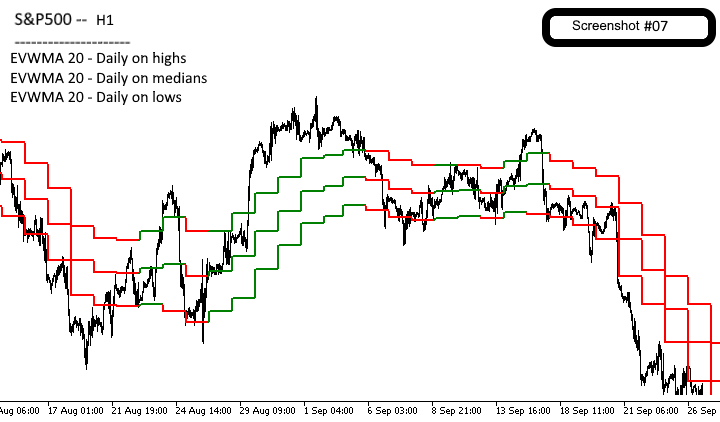
Esempio di S&P500
Aggiungi 3 mesi di tempo cellulare per 20 periodi di applicazioni giornaliere al massimo livello e considera H1
**** Vedi screenshot da 6 a 7
Il tuo
Condividi i tuoi ametri di utilizzo e scoprii i commenti di altri trader che sfruttano questo indicatore per ottimizzare le loro strategie!
=== > Per chi?
Se sei un trader discreto, un trader algoritmico o un trader intelligente, l'indicatore è pensato per rispondere alle tue esigenze specifiche. Comprendo l'importanza dell'affidabilità e dell'efficienza quando ho soldi in tasca e mi assumo questa responsabilità molto importante.
L'indicatore consuma le tue tasche sul tuo PC o VPS. Per gli algoritmi di trading e le informazioni utili, hai accesso completo al buffer: buffer 1 per il valore del mercato e buffer 2 per l'orientamento del mercato.
=== > Appollaiato?
Le medie cellulari sono utilizzate da molto tempo. Utilizzato principalmente per definire la tendenza e l'intervallo.
Per i tuoi Expert Advisor (EA), vedi, puoi prendere la decisione più facilmente e nel miglior modo possibile.
=== > Le regole dello sviluppo applicate
Denominazione delle variabili => Tutte le variabili hanno nomi coerenti e descrittivi, rendendo il codice più facile da comprendere e mantenere.
Utilizzo minimo di variabili globali => Vengono utilizzate pochissime variabili globali.
Basso consumo di memoria => L'indicatore è progettato per consumare poca memoria, garantendo prestazioni ottimali.
Inizializzazione delle variabili => Tutte le variabili vengono inizializzate, il che riduce al minimo comportamenti imprevisti e rafforza la stabilità del codice.
Ottimizzazione dei loop => Tutti i loop sono ottimizzati per garantire un attraversamento efficiente, aumentando così la velocità dei calcoli.
Limitazione del numero di loop =>: Il numero di loop è stato ridotto combinando più trattamenti.
Gestione degli errori => Tutti i ritorni delle funzioni sono gestiti attentamente per rilevare e gestire possibili errori, garantendo la massima affidabilità.
Limitazione della dimensione del log => Una procedura limita la scrittura di messaggi ripetitivi, evitando così il sovraccarico del log e facilitando il debug.
=== > Decodifica robusta
È essenziale disporre di un codice robusto che funzioni in modalità permanente. In caso di problemi, potrebbe non essere visualizzato un messaggio di errore. Anche se il sistema è controllato, l'indicatore rimarrà attivo in modo rapido e automatico.
=== > Come è stato fatto?
Non basato sulla funzione nativa ima(): l'indicatore è indipendente dalla funzione nativa ima().
Principio dell'applicazione OOP: Tuttavia, non è scritto in OOP, il principio del programma è diretto alla programmazione della sua applicazione nell'ambito dell'applicazione delle sue funzioni.
Funzione per la finestra di trasferimento: funziona anche su simboli fuori mercato. Potrebbe essere necessario fare clic in un altro intervallo di tempo per aggiornare l'immagine.
Gestione delle interruzioni: In caso di interruzione di Internet o di problema del server, l'indicatore del segnale mostra tutti gli orologi e tutti i calcoli.
Riattivazione: Molto reattivo, senza ridistribuzione, l'indicatore è aggiornato al tick, cruciale per la criptovalute o i simboli molto volatili.