Power of 3 ICT Series
- Indicatori
- Juan Pablo Castro Forero
- Versione: 1.2
- Aggiornato: 6 agosto 2024
- Attivazioni: 20
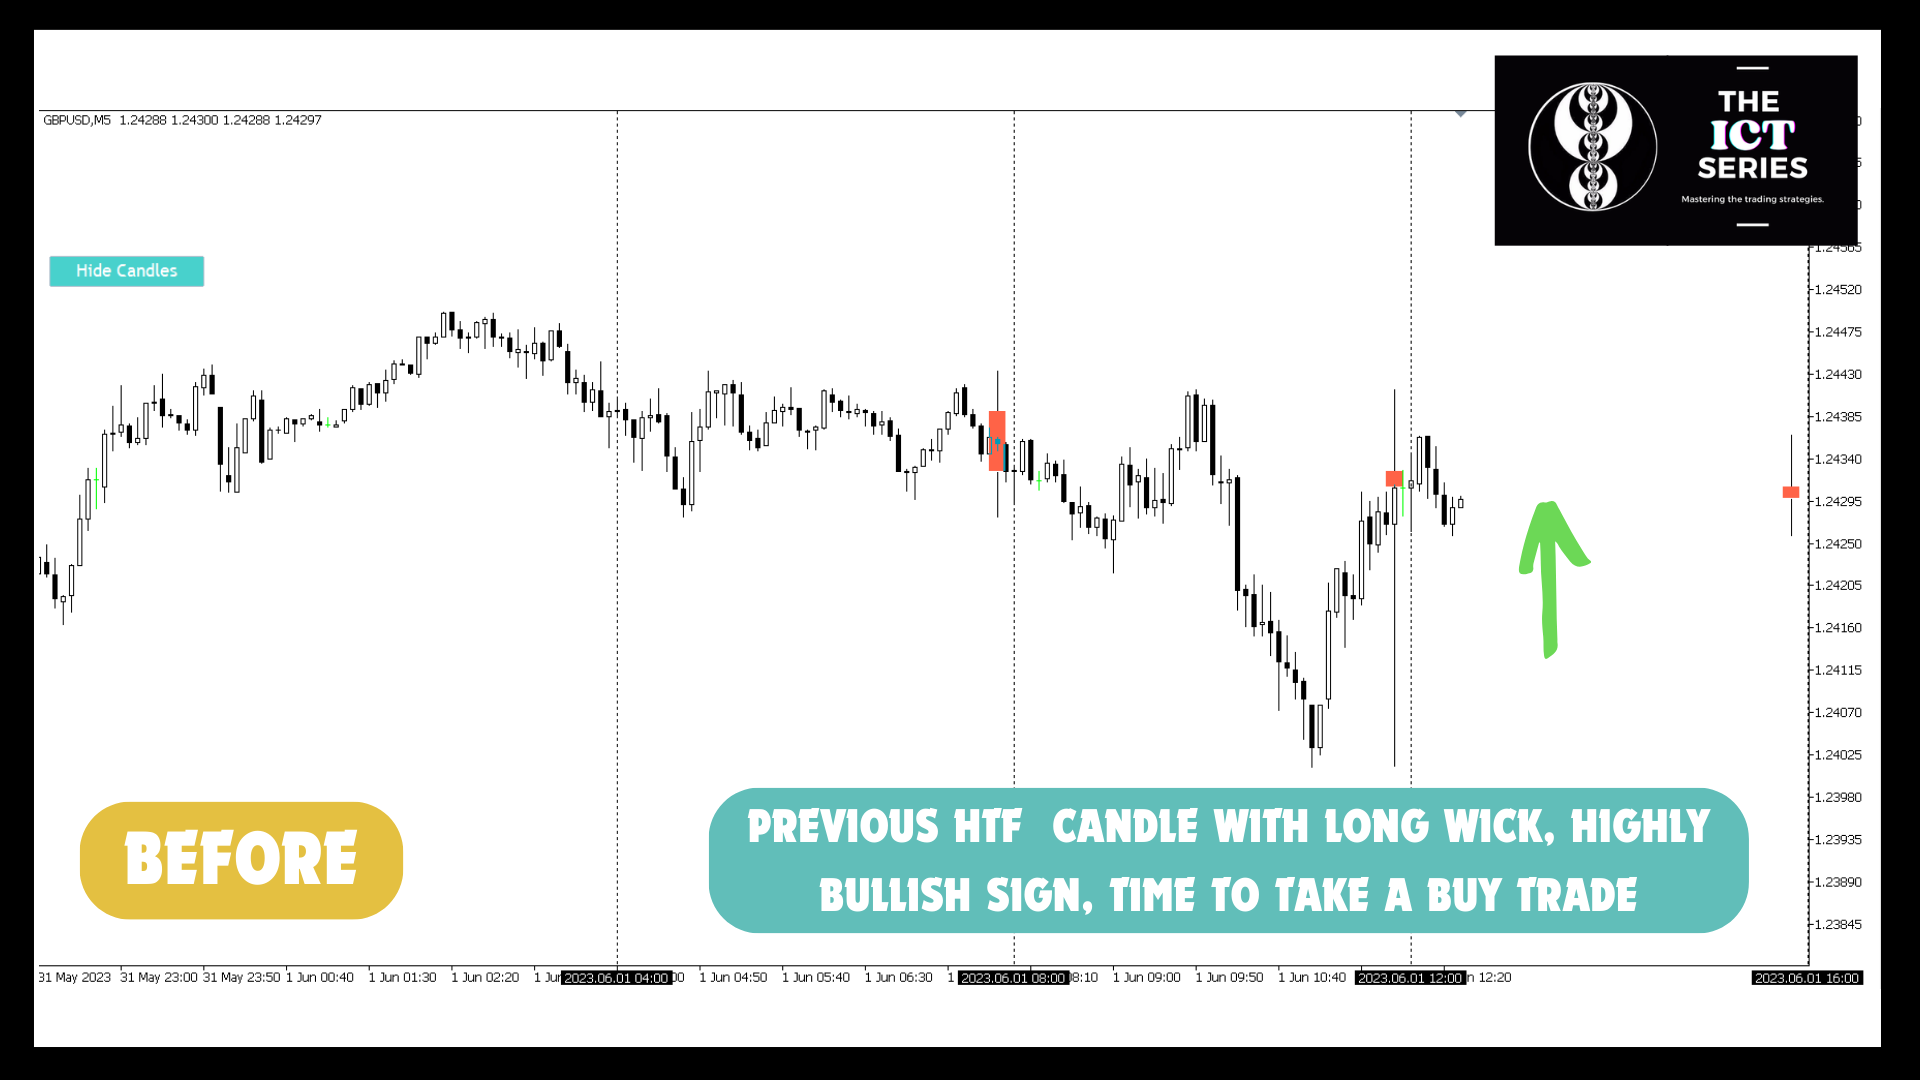
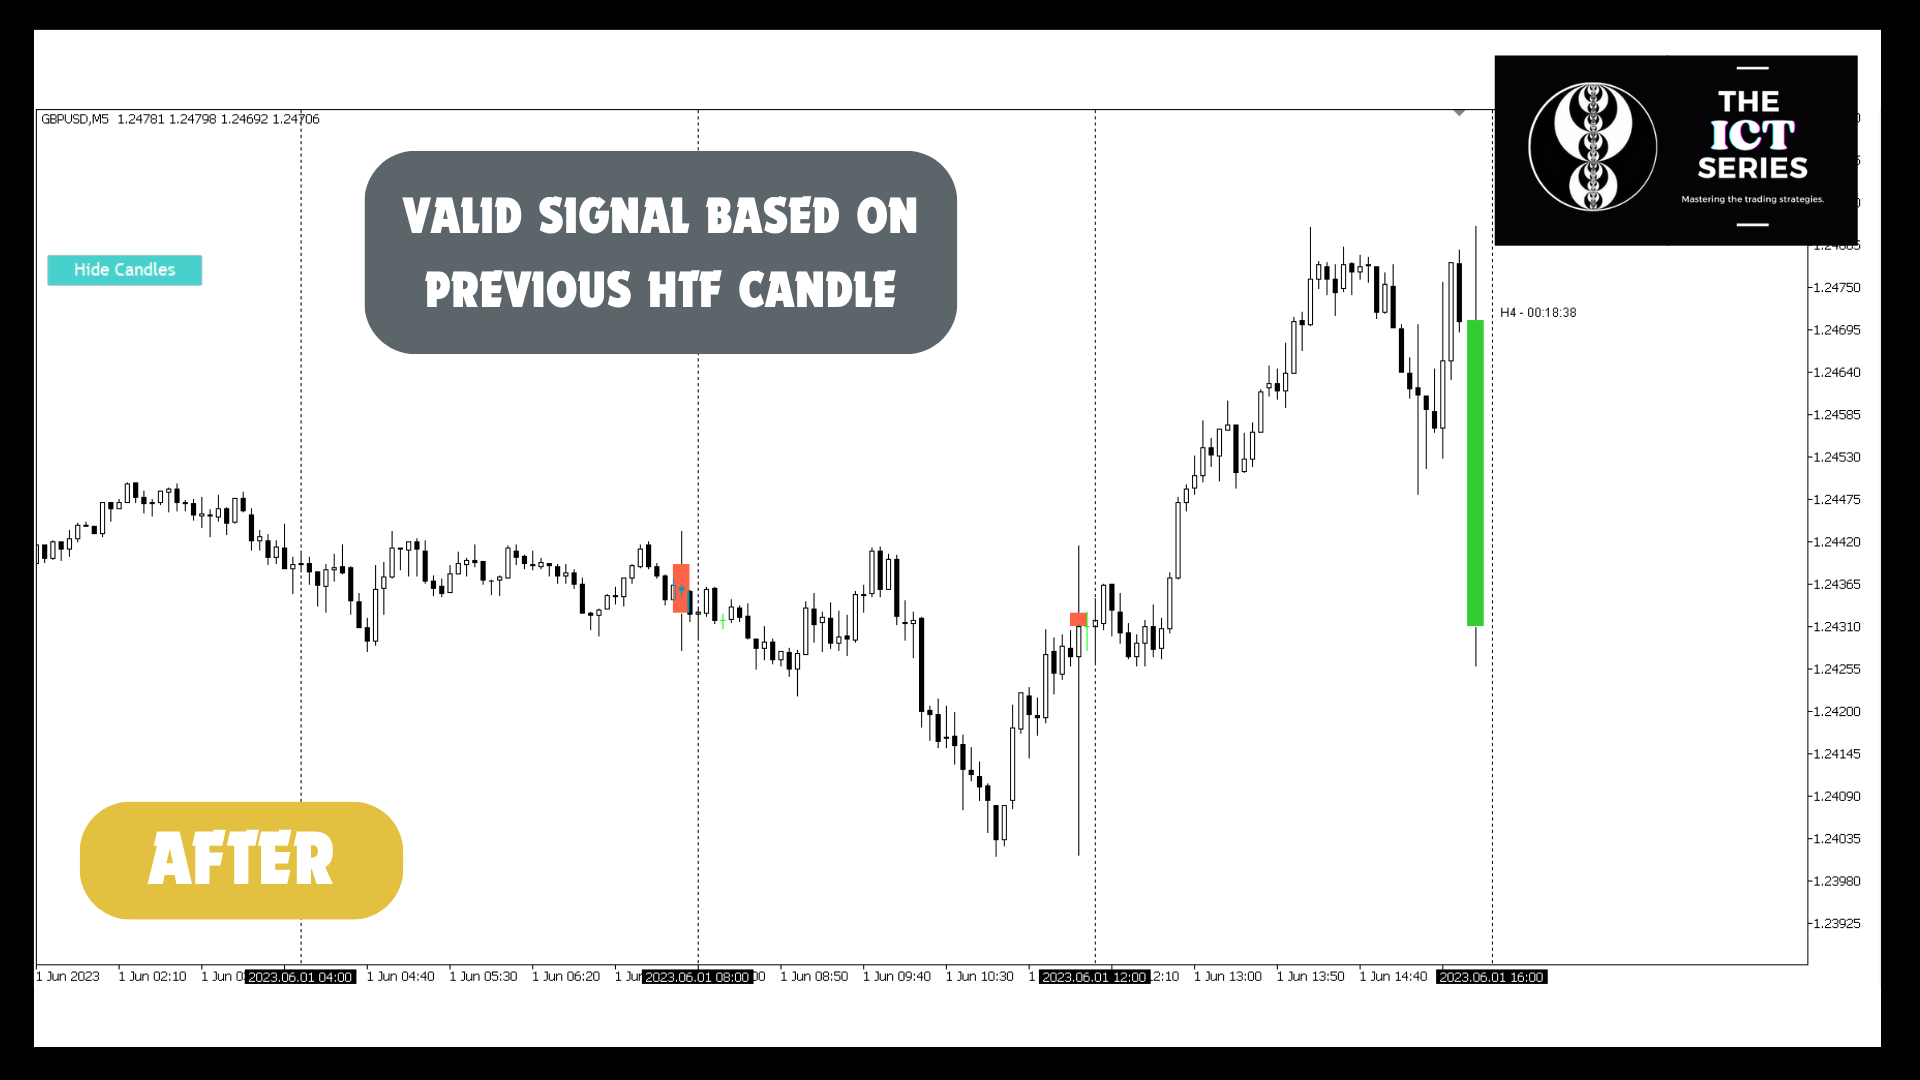
<p><b>The Power of 3 ICT</b> è il miglior strumento per aiutarti a monitorare l'HTF mentre fai trading su timeframe inferiori. Questo indicatore ti permetterà di vedere fino a 2 candele HTF diverse sul tuo grafico LTF, in modo che tu sappia sempre come si presenta l'azione del prezzo attuale nei timeframe superiori e se stai prendendo la tua operazione seguendo la tendenza del timeframe superiore.</p>
<div class="atten">
<p><a href="https://www.mql5.com/en/blogs/post/758051" title="https://www.mql5.com/en/blogs/post/758051" target="_blank">Come posso usare questo indicatore per tradare i concetti ICT/Liquidità? </a></p>
</div>
<p> </p>
<h3>Cosa puoi fare con The Power of 3?<br> </h3>
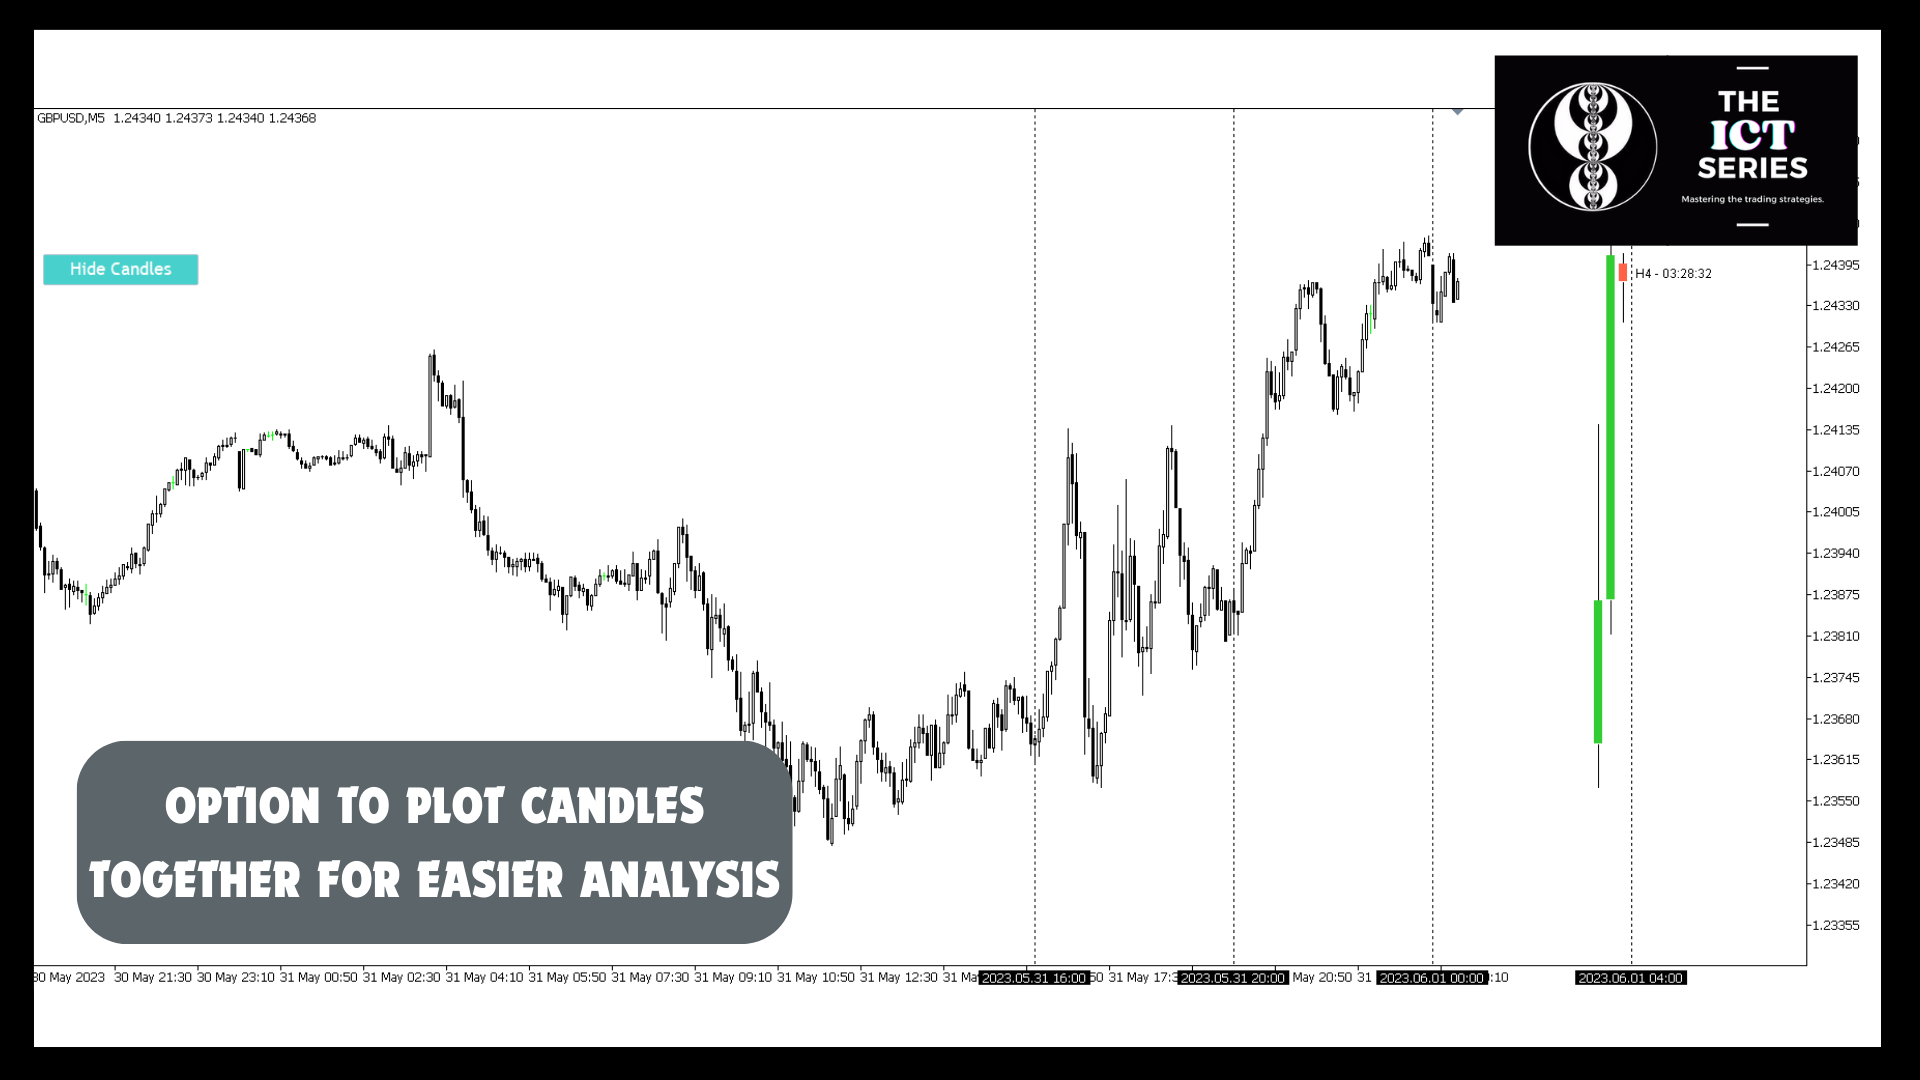
<p>Guarda le candele attuali dei timeframe superiori e hai una facile visione delle tendenze principali. Mostra anche quante candele precedenti vuoi, aiutandoti a identificare più facilmente le tendenze HTF e ad allineare le tue idee di trading con quella tendenza. Inoltre, hai la possibilità di tracciarle nei loro rispettivi intervalli di tempo e tracciare linee verticali per determinare l'inizio e la fine di ogni candela, il che ti permette di vedere come si è formata ogni candela e come è più probabile che si formi la candela attuale e in quale direzione andrà.</p>
<p> </p>
<h3>Perché usare The Power of 3?<br> </h3>
<p>Allinea questo indicatore con altri indicatori come l'indicatore di liquidità e avrai una strategia semplice ed efficace che può portare il tuo trading al livello successivo. Con l'aiuto dell'indicatore di liquidità, sarai in grado di trovare le aree di liquidità da cui ti aspetti reazioni e operazioni. Questo allineato con il Bias HTF e la potenza di 3 sulla candela attuale ti dà tutte le informazioni per prendere un'operazione ad alta probabilità.</p>
<p>Come se non bastasse, l'indicatore ha un modello di previsione che ti permetterà di vedere una polilinea che mostra la possibile formazione del prezzo della candela attuale e i possibili momenti in cui si verificheranno il massimo e il minimo della candela.</p>
<p> </p>
<h3>Altre funzionalità </h3>
<p></p>
<ul>
<li><span>Linee verticali agli orari di inizio e fine delle candele.</span></li>
<li><span>Allarmi per l'inizio della candela.</span></li>
<li><span>Possibilità di tracciare tutte le candele HTF passate insieme per un approccio pulito.</span></li>
</ul>
<p></p>
<p>Inoltre, per rendere più facile l'uso dell'indicatore, è completamente personalizzabile, permettendoti di impostare i tuoi colori preferiti, stili di linea, nomi delle etichette e orari. In questo modo puoi davvero usare gli indicatori e goderti il trading a modo tuo. </p>
<p> </p>
<p> </p>
<p>Questo indicatore fa parte della collezione ICT SERIES che puoi trovare qui. Usalo contemporaneamente con gli altri prodotti per garantire risultati migliori. Se hai idee, concetti o strategie che vorresti vedere nella ICT SERIES, inviacele per messaggio diretto o commento, saremo felici di svilupparle e testarle con te o unirti alla nostra comunità di trader che condividono idee, strategie e supporto.</p>
<p>La serie si concentra principalmente sui concetti di Inner Circle Trader (ICT), i concetti di Smart Money, il trading istituzionale, i concetti di liquidità, Turtle soups, IPDA, Wyckoff. Unisciti alla nostra comunità.</p>
<p><br></p>
A very well designed indicator. It has many user configurable options. The Show/Hide feature is great. Juan is very prompt in responding and shows great commitment to adding new features that enhance the product. With this indicator ,it is very easy to visualize the Higher Time Frame activity .It brings more clarity to the analysis .The options to draw OHLC bars is excellent and is very rare.A very professionally designed Indicator.