KeyLevels Pro
- Indicatori
- Anthony Mckerrow
- Versione: 1.0
- Attivazioni: 5
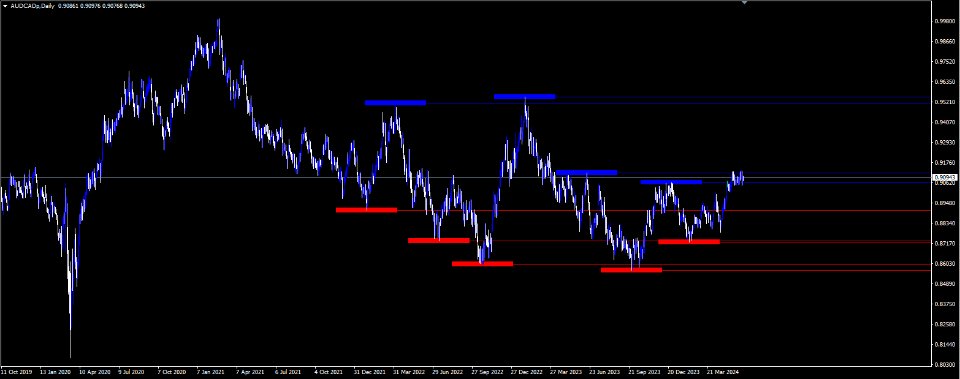
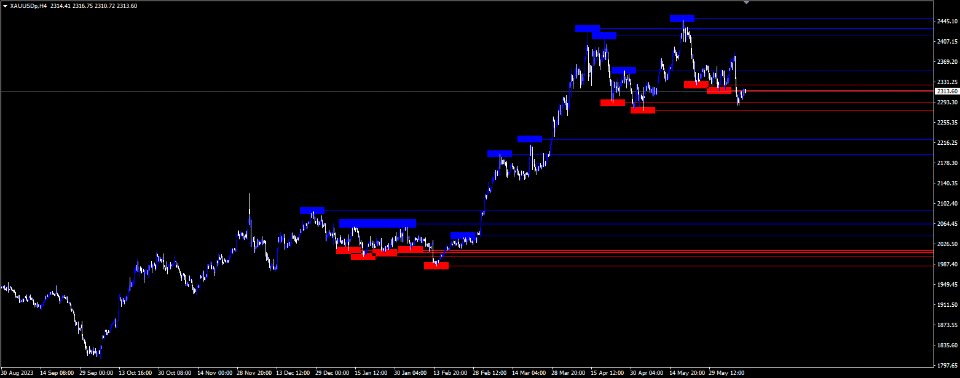
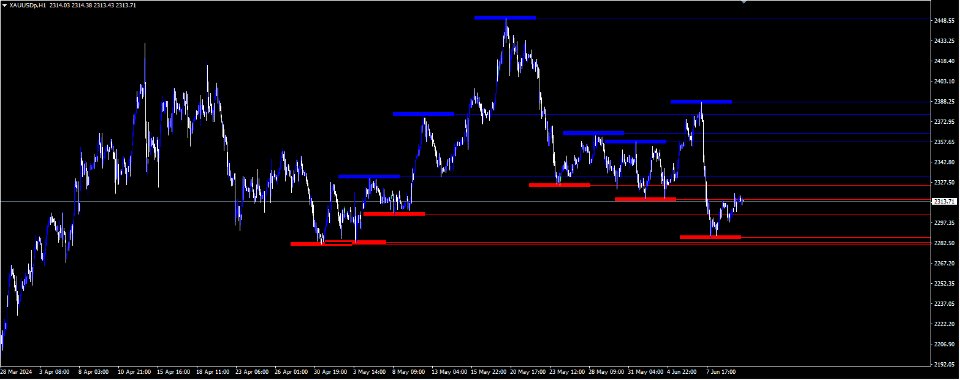
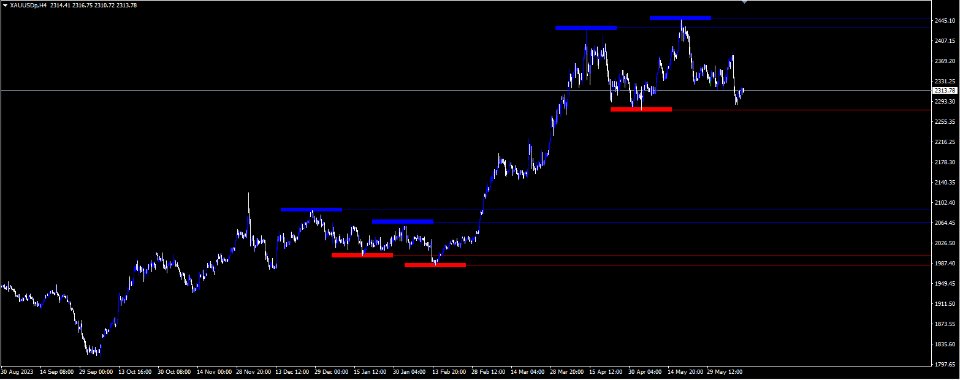
The KeyLevels Pro indicator is a powerful tool designed to identify significant support and resistance levels based on pivot highs and lows in the price action. This indicator is perfect for traders who rely on market structure and key price levels to make informed trading decisions. It features customizable parameters, automatic detection of pivot points, and visual representation of key levels with optional labels.
Features
- Pivot Detection: Automatically detects pivot highs and lows based on customizable look-back and look-forward periods.
- Adaptive Zones: Creates support and resistance zones based on Average True Range (ATR), making them adaptive to market volatility.
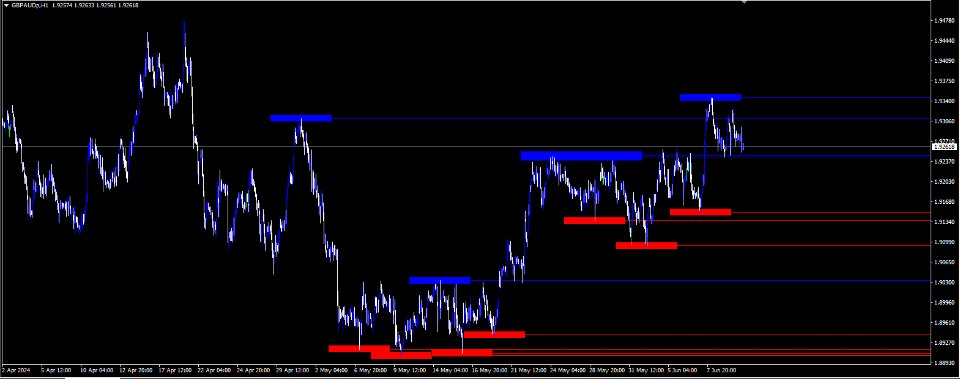
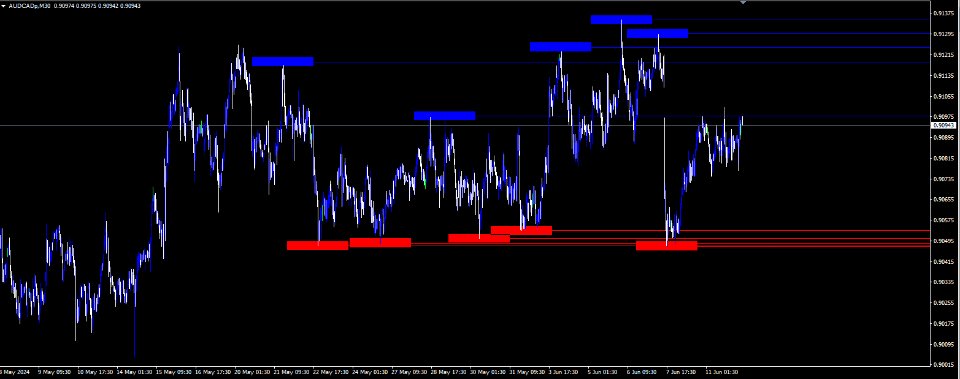
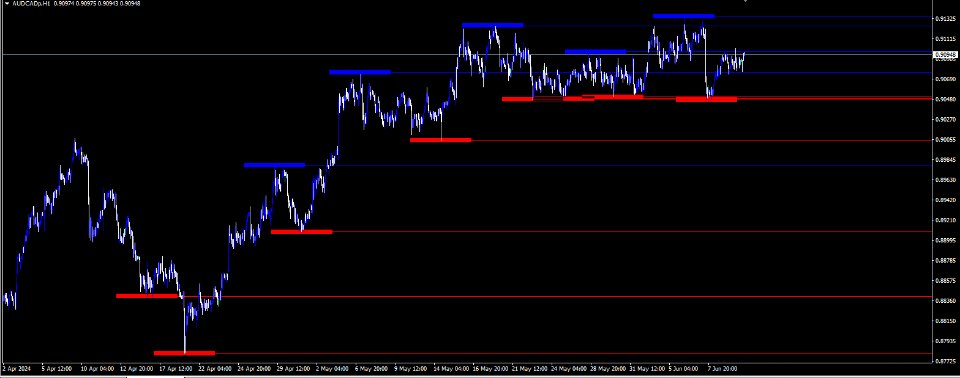
- Visual Representation: Draws zones and lines directly on the chart for easy visualization of key levels.
- Customizable Colors: Allows users to customize the colors of support lines, resistance lines, and zone borders for better visual clarity.
- Level Labels: Optional display of price labels for key levels, aiding quick identification.
- Works on All Timeframes: Suitable for use on any timeframe, from one-minute charts to monthly charts.
- Efficient Calculation: Designed to handle up to 1000 bars back, ensuring efficient performance without slowing down the terminal.
How It Works
-
Initialization: When the indicator is initialized, it sets up the indicator properties and prepares for calculation.
-
OnCalculate Function: The main function that iterates over the chart data to detect pivot points, create zones, and draw support/resistance lines.
- Pivot Detection: Checks for pivot highs and lows within the specified look-back (LookLeft) and look-forward (LookRight) periods.
- Zone Creation: For each detected pivot, a support or resistance zone is created. The width of these zones is based on the ATR, making them dynamic according to market conditions.
- Line Creation: For each detected pivot, a support or resistance line is also created.
- Zone Merging: Merges nearby zones to simplify the chart and highlight the most significant areas.
- Drawing Zones and Lines: Draws the zones and lines on the chart, applying the specified colors and styles. Labels are optionally added if enabled.
-
Custom Functions:
- ClearChartObjects: Removes existing chart objects to prevent clutter.
- AddZone: Adds a new support or resistance zone.
- AddLine: Adds a new support or resistance line.
- SortZonesByStartIndex: Sorts zones by their start index to prepare for merging.
- MergeZones: Merges overlapping or nearby zones.
- DrawMergedZones: Draws the merged zones on the chart.
- DrawSupportResistanceLines: Draws the support and resistance lines on the chart.
Parameters (I have saved set file I can share which has less clutter but you can adjust these parameters to suit your trading style)
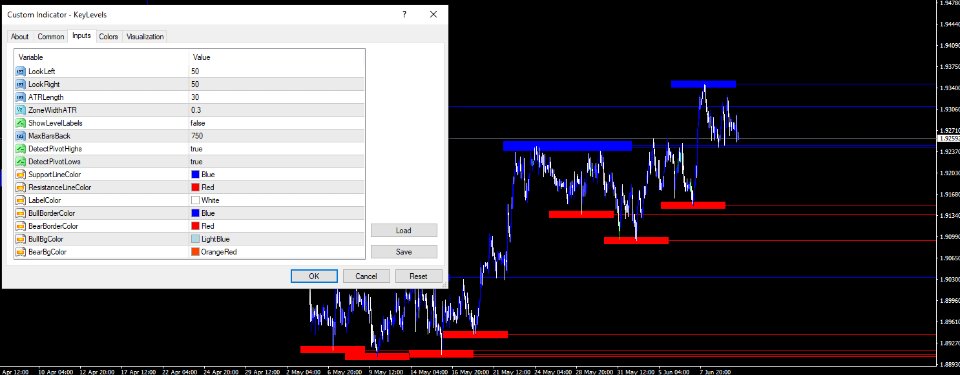
- LookLeft: Number of bars to look back for detecting pivots.
- LookRight: Number of bars to look forward for detecting pivots.
- ATRLength: Length of the ATR calculation for zone width.
- ZoneWidthATR: Multiplier for the ATR to determine zone width.
- ShowLevelLabels: Option to show or hide price labels for key levels.
- MaxBarsBack: Maximum number of bars back to calculate pivots.
- DetectPivotHighs: Enable or disable detection of pivot highs.
- DetectPivotLows: Enable or disable detection of pivot lows.
- SupportLineColor: Color for support lines.
- ResistanceLineColor: Color for resistance lines.
- LabelColor: Color for level labels.
- BullBorderColor: Border color for bullish zones.
- BearBorderColor: Border color for bearish zones.
- BullBgColor: Background color for bullish zones.
- BearBgColor: Background color for bearish zones.
Usage
- Attach to Chart: Attach the indicator to any chart and configure the parameters as desired.
- Observe Key Levels: Watch as the indicator automatically identifies and displays key support and resistance levels, adapting to market conditions in real-time.
Benefits
- Improved Trading Decisions: Clearly identified key levels help traders make better entry and exit decisions.
- Customizable: Tailor the indicator settings to match your trading style and preferences.
- Visual Clarity: Easily identify significant price levels and zones with the customizable visual representation.
- Versatile: Effective on all timeframes, making it suitable for both short-term and long-term trading strategies.
Ideal For
- Traders who rely on market structure and key price levels.
- Those looking to enhance their technical analysis with dynamic support and resistance zones.
- Traders who appreciate a clean and customizable chart setup.
Start using the KeyLevels Pro indicator today to elevate your trading strategy and gain a better understanding of market dynamics through critical support and resistance levels.
