• Panoramica
  • Recensioni
  • Commenti (2)

KMeans Price Zones Detector

Benvenuto nel futuro del trading con KMeans Price Zones Detector, un innovativo indicatore per MetaTrader che sfrutta la potenza del machine learning per identificare le zone di prezzo chiave. Questo strumento utilizza l'algoritmo di clustering KMeans per rilevare dinamicamente i centroidi nei dati dei prezzi, evidenziando le aree in cui i prezzi hanno maggiori probabilità di incontrare supporto, resistenza o consolidamento.

Algoritmo KMeans innovativo

KMeans Price Zones Detector si distingue per il suo utilizzo avanzato dell'algoritmo di clustering KMeans, un elemento fondamentale del machine learning noto per la sua efficienza e precisione nel riconoscimento dei modelli. Analizzando i dati storici dei prezzi, l'indicatore identifica cluster o centroidi che rappresentano livelli di prezzo significativi. Questi centroidi vengono quindi utilizzati per calcolare le zone di supporto e resistenza, fornendo ai trader informazioni cruciali sui potenziali inversioni di prezzo, rotture e consolidamenti.

Caratteristiche principali

  • Rilevamento dinamico delle zone: L'indicatore aggiorna continuamente le zone di prezzo in base agli ultimi dati di mercato, garantendo che i trader abbiano sempre le informazioni più pertinenti.
  • Funziona su tutti i timeframe: Che tu sia uno scalper sul grafico a 1 minuto o un investitore a lungo termine sul grafico giornaliero, KMeans Price Zones Detector si adatta senza problemi per fornire un rilevamento preciso delle zone.
  • Compatibile con tutte le coppie di valute: L'indicatore è progettato per funzionare con qualsiasi coppia di valute, offrendo versatilità e flessibilità ai trader che trattano più valute.
  • Integrazione completa dell'ATR: Integrando l'Average True Range (ATR), l'indicatore regola la larghezza delle zone in base alla volatilità del mercato, fornendo una visione realistica dei potenziali movimenti di prezzo.
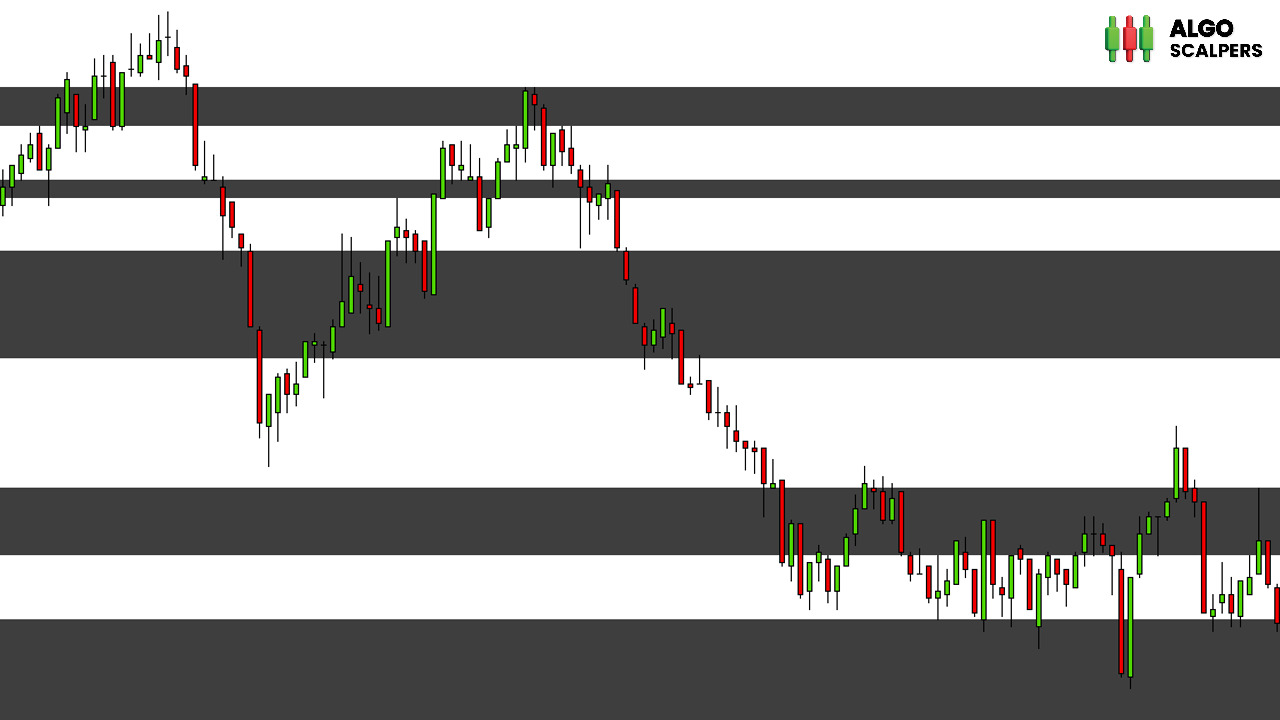
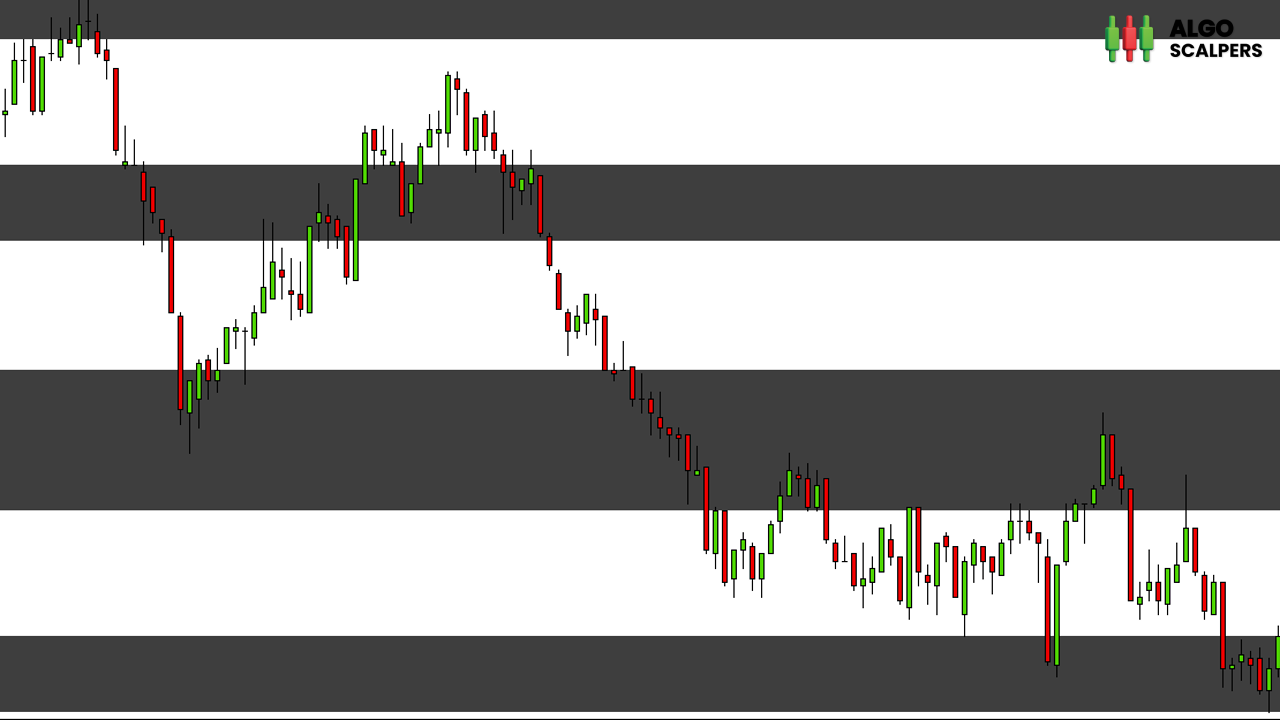
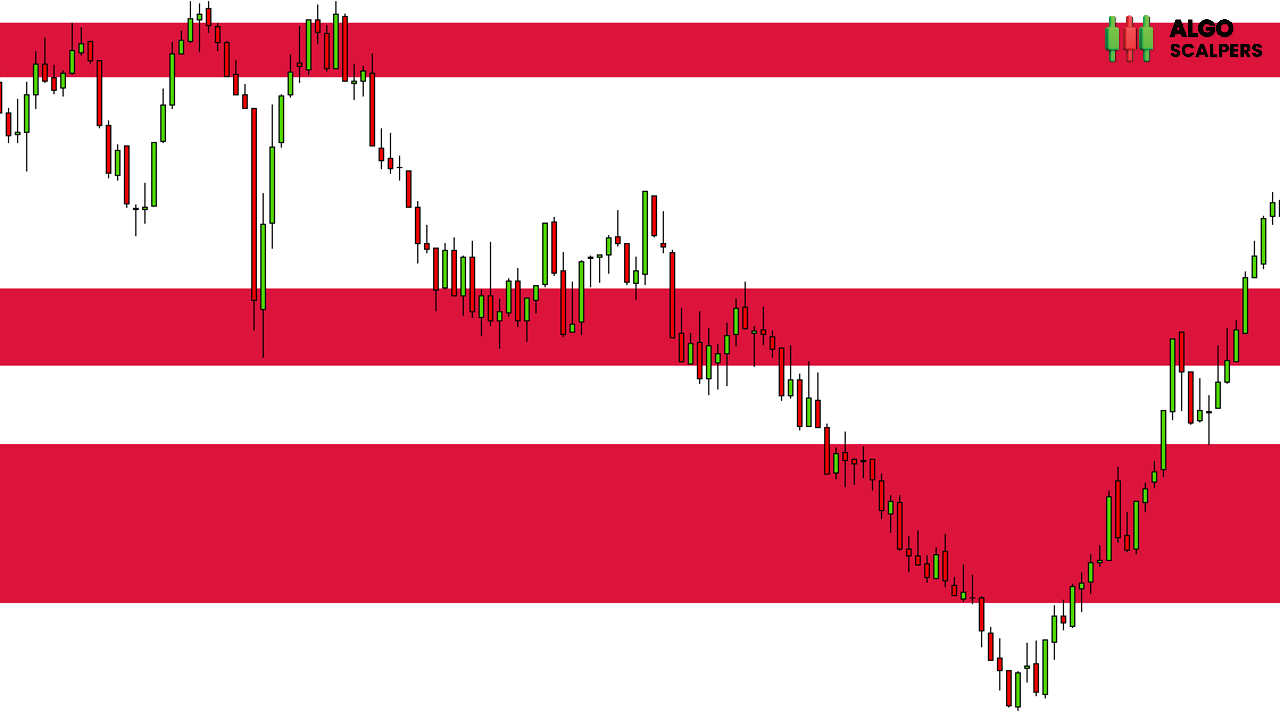
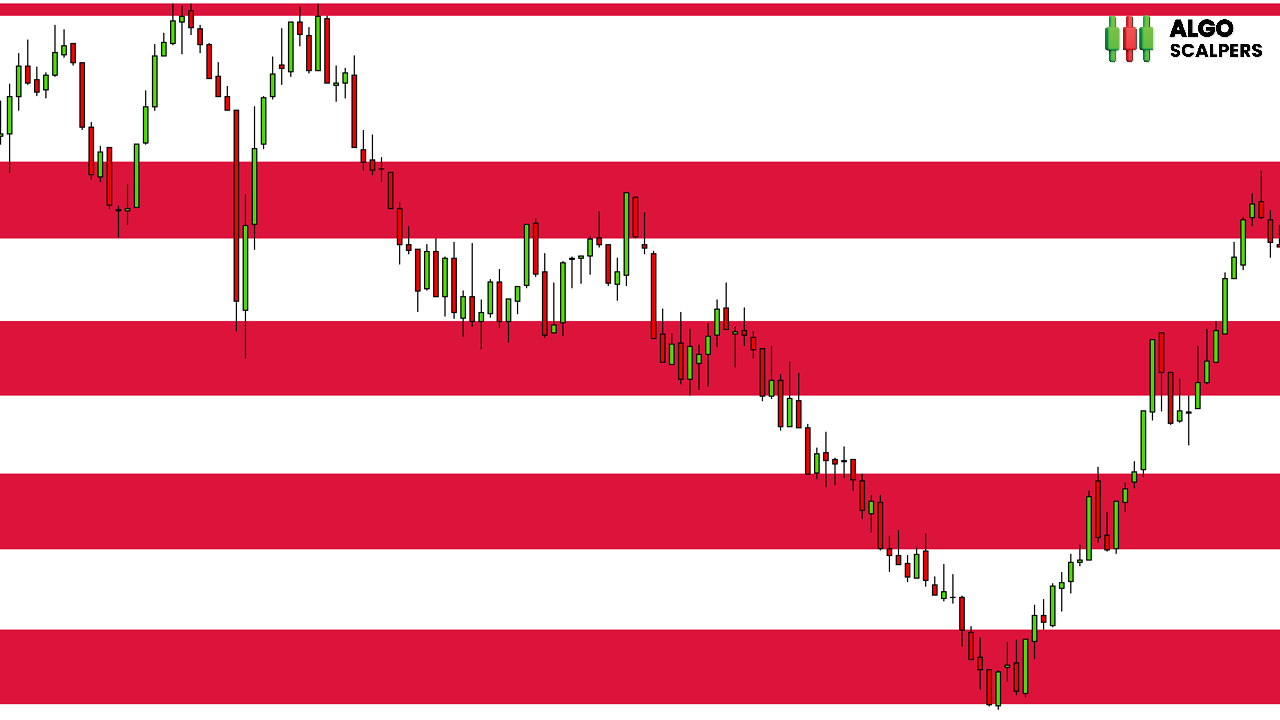
  • Visualizzazione intuitiva: L'indicatore disegna direttamente sul grafico zone chiare e colorate, rendendo facile per i trader interpretare e agire sui dati.
  • Opzioni di personalizzazione: I trader possono regolare parametri come il numero di centroidi, le iterazioni di KMeans e l'impatto dell'ATR, adattando l'indicatore alle loro specifiche strategie di trading e preferenze.

Come funziona

  1. Inizializzazione: L'indicatore si inizializza impostando i centroidi utilizzando i dati storici dei prezzi.
  2. Clustering KMeans: L'algoritmo KMeans regola iterativamente i centroidi per minimizzare la distanza tra i punti dati dei prezzi e il loro centroide più vicino, garantendo un rilevamento preciso delle zone.
  3. Calcolo dell'ATR: L'Average True Range (ATR) viene calcolato per determinare la larghezza regolata per la volatilità di ciascuna zona.
  4. Calcolo delle zone: Basandosi sui centroidi e sull'ATR, vengono calcolate e visualizzate sul grafico le zone di supporto e resistenza.
  5. Aggiornamento continuo: L'indicatore aggiorna continuamente le zone man mano che arrivano nuovi dati di prezzo, mantenendo così la sua rilevanza e precisione in condizioni di mercato dinamiche.

Perché scegliere KMeans Price Zones Detector?

  • Precisione e affidabilità: L'algoritmo KMeans fornisce un rilevamento delle zone preciso e affidabile, aiutando i trader a prendere decisioni informate.
  • Potenza del machine learning: Sfrutta le tecniche avanzate di machine learning per ottenere un vantaggio sul mercato.
  • Adattabilità: Adatto a qualsiasi stile di trading, sia che si tratti di day trading, swing trading o investimenti a lungo termine.

Trasforma la tua strategia di trading con KMeans Price Zones Detector e sperimenta la potenza del machine learning nell'identificare le zone di prezzo chiave. Migliora le tue decisioni di trading e resta un passo avanti al mercato con questo strumento all'avanguardia.

Prodotti consigliati
Day Trade System
Nardus Van Staden
5 (1)
Introducing The Day Trader System: Your Shortcut to Day Trading Success! Are you a day trader seeking simplicity without compromising profitability? Look no further! We present The Day Trader System – your go-to solution for identifying lucrative opportunities in the fast-paced world of Forex. Simple Yet Powerful: The Day Trader System is a straightforward yet highly effective indicator designed exclusively for day traders. Say goodbye to complexity and hello to a system that simplifies
FREE
USA Indexes Quant Indicator
Thunder Investment Group Limited
Property of Vertical Capital Edition:  Gugol_Quants   About USA INDEXES QUANT_INDICATOR: This is a indicator created by math modulation to be used as a trading tool, which was developed in MQL. (MT5) This indicator is for use only with US500(S&P500), NAS100(Nasdaq Composite) and US30(Dow Jones). Signals are activated on "Open" Candle. It’s based on Intraday/Swing Trades whose main timeframe is H1, H2, H3 and H4. However you can use it with other assets by testing with the appropriate settings. *
FREE
1. Why did I develop this series of indicators I found that most traders need to use multiple time frame indicators. They usually switch time frame to see indicators. However, once the timeframe is switched, you cannot see the  corresponding relationship  between  the price in the smaller timeframe  and  the indicator in the larger timeframe . For example: if your price chart is in H1 timeframe, you can see H4, D1 and W1 indicators in H1 timeframe Chart. This is more helpful for you to find th
L'indicatore aiuta ad entrare in un trade seguendo il trend, allo stesso tempo, dopo alcune correzioni. Trova forti movimenti di tendenza di una coppia di valute su un determinato numero di barre e trova anche livelli di correzione per questa tendenza. Se la tendenza è abbastanza forte e la correzione diventa uguale a quella specificata nei parametri, l'indicatore lo segnala. È possibile impostare diversi valori di correzione, i valori di 38, 50 e 62 (livelli di Fibonacci) sono più adatti. Inol
Introducing the 'No Nonsense Reversal Megaprofits' indicator for MetaTrader 5 (MT5), your ultimate tool for identifying trend reversals with precision and confidence. This powerful indicator is designed to cut through the noise of the markets and pinpoint crucial turning points with ease. Powered by advanced algorithms, 'No Nonsense Reversal Megaprofits' analyzes price action and key market dynamics to accurately detect when a trend is about to reverse. Whether you're a novice trader or a season
Breaker Block and Order Block Indicator for MT5 The Breaker Block and Order Block Indicator (BB+OB) is specifically developed for traders using ICT strategies to recognize key market zones. This tool employs a unique algorithm to detect intersections of Order Blocks and Breaker Blocks , highlighting them on the chart in green for bullish zones and brown for bearish zones on the MetaTrader 5 (MT5) platform. By utilizing this indicator, traders can improve their market entries and exits, refining
FREE
This indicator let user clearly see Buy/Sell signals. When a bar is closed and conditions meet, arrow signal will come up at Close Price, up is Buy and down is Sell. It works on all Timeframes. And you can set sound alert when signals come up.
Trend Fishing Indicator
Harish Balasubramani
4 (1)
The "Trend Fishing Indicator" is a powerful custom indicator designed to help traders identify potential trend reversal points and capitalize on market momentum. This indicator uses multiple moving averages of varying periods to evaluate short-term and long-term market trends. By comparing the short-term moving averages against the long-term ones, it generates clear buy and sell signals that can guide traders in making informed trading decisions. Key Features: Multiple Moving Averages : Incorpor
FREE
KT Psar Arrows MT5
KEENBASE SOFTWARE SOLUTIONS
5 (1)
KT Psar Arrows plots the arrows on chart using the standard Parabolic SAR indicator. A bullish arrow is plotted when the candle's high touch the SAR. A bearish arrow is plotted when the candle's low touch the SAR. The signals are generated in the real-time without waiting for the bar close.  Features A beneficial tool for traders who want to experiment with the trading strategies that include the use of Parabolic Sar indicator.  Can be used to find turning points in the market. Use custom PSAR
Dark Breakout MT5
Marco Solito
5 (3)
Dark Breakout   is an Indicator for intraday trading. This Indicator is based on Trend Following  strategy, providing an entry signal on the breakout. The signal is provided by the arrow, which confirms the breaking of the level. We can enter in good price with this Indicator, in order to follow the main trend on the current instrument. It is advised to use low spread ECN brokers. This Indicator does Not repaint and N ot lag . Recommended timeframes are M5, M15 and H1. Recommended working pairs
Mean Reversal Heikin Ashi Indicator calculates special trade reversal points based on Heikin Ashi candlesticks patterns. This indicator can be used on all symbols, even in Forex or B3 Brazillian Markets. You can configure just the position of each arrow. Then, after include the indicator on the graphic, pay attention on each arrow that indicates a long or short trade.
This system is good at identifying short term reversals in the market. It is based on a machine learning study on market structure, and can be a great tool to scan the market or direct trades. With everything, there isn't a 100% win-rate, but this indicator is sometimes always accurate.   When it thinks a reversal will happen, it will color the candle a specific color, draw an arrow and then alert you on whether to buy or sell the upcoming candle.   Simple Setup Drag and drop onto any chart, at
The indicator determines a special pattern of Joe Dinapoli. It gives very high probability buy and sell signals. Indicator does not repaint. Indicator Usage Buy Signal ''B'' Entry : Market buy order at signal bar close Stop : Low of signal bar Take Profit : First swing high Sell Signal ''S'' Entry : Market sell order at signal bar close Stop : High of signal bar Take Profit : First swing low Indicator Parameters Fast EMA : External Parameter (should be kept as default) Slow EMA: External Param
Moving pivot Average Fibonacci The  indicator compares the selected period with its counterpart from the previous period. The indicator determines the moving Fibonacci levels for the day or any time interval to assess the price movement range from the time average. The indicator helps predict the expected high or low for the day based on historical time data. The pivot line can be considered an average trend line and use it in a variety of trading strategies. If you have any question about the
1. Why did I develop this series of indicators I found that most traders need to use multiple time frame indicators. They usually switch time frame to see indicators. However, once the timeframe is switched, you cannot see the  corresponding relationship  between  the price in the smaller timeframe  and  the indicator in the larger timeframe . For example: if your price chart is in H1 timeframe, you can see H4, D1 and W1 indicators in H1 timeframe Chart. This is more helpful for you to find th
Heikin Ashi Heikin Ashi is a charting technique that can be used to predict future price movements. It is similar to traditional candlestick charts. However, unlike a regular candlestick chart, the Heikin Ashi chart attempts to filter out some of the market noise by smoothing out strong price swings to better identify trend movements in the market. To create Heiken Ashi, a formula is used in which price data is entered, while ordinary candles are built only on bare numbers, without using any c
1. Why did I develop this series of indicators I found that most traders need to use multiple time frame indicators. They usually switch time frame to see indicators. However, once the timeframe is switched, you cannot see the  corresponding relationship  between  the price in the smaller timeframe  and  the indicator in the larger timeframe . For example: if your price chart is in H1 timeframe, you can see H4, D1 and W1 indicators in H1 timeframe Chart. This is more helpful for you to find th
Trade Area
Jinsong Zhang
Most time the market is in a small oscillation amplitude. The Trade Area indicator helps users to recognize that time. There are 5 lines in this indicator: Area_high, Area_middle, Area_Low, SL_high and SL_low. Recommendations: When price is between Area_high and Area_Low, it's time to trade. Buy at Area_Low level and sell at Area_high level. The SL_high and SL_low lines are the levels for Stop Loss. Change the Deviations parameter to adjust SL_high and SL_low.
Questo indicatore è un indicatore per l'analisi automatica delle onde perfetto per il trading pratico! Caso... Nota:   non sono abituato a usare nomi occidentali per la classificazione delle onde a causa dell'influenza della convenzione di denominazione di Tang Lun (Tang Zhong Shuo Zen), ho chiamato l'onda base come   penna   e la banda dell'onda secondaria come   segmento   At allo stesso tempo, il segmento ha la direzione del trend. La denominazione   è principalmente segmento di trend   (que
KT Forex Trend Rider MT5
KEENBASE SOFTWARE SOLUTIONS
KT Forex Trend Rider uses a trend following algorithm developed specifically for the Forex market to provide reliable buy & sell signals across the major currency pairs. It works best on major FX pairs and all time-frames. Features It comes with a Multi-Timeframe scanner that can search for upcoming signals across all the time-frames. It comes with four preset profiles to facilitate trading for scalpers, tick-trend, swing, and trend traders. It marks the potential reversal points in the market.
1. Why did I develop this series of indicators I found that most traders need to use multiple time frame indicators. They usually switch time frame to see indicators. However, once the timeframe is switched, you cannot see the  corresponding relationship  between  the price in the smaller timeframe  and  the indicator in the larger timeframe . For example: if your price chart is in H1 timeframe, you can see H4, D1 and W1 indicators in H1 timeframe Chart. This is more helpful for you to find th
Trading Signal for MetaTrader5 PC platform The Signal is based on the Investologic EA trend strategy .  Trend following indicator’s and oscillator’s, can work with any symbol or market in MT5 platform    FOREX, GOLD, OIL, STOCKS, INDEXES, NASDAQ SPX500   The strategy the strategy uses multi time frame combination of indicators and  moving averages to find the best entry point wen the fast MA  slow MA Crossover  And Stochastic , RSI  , Average Directional Movement Index ,combined together to
FREE
Questo segnale DYJ è UN sistema di trading completo basato sulle specifiche tecniche ATR. Tali metriche registrano lo stato corrente di ogni tendenza di forza in ogni coppia di periodi di tempo e valuta analizzata. Il segnale di alimentazione DYJ valuta questi dati per creare in modo professionale una visualizzazione Dell' intensità della tendenza e UN elenco dei segnali del punto di ingresso. Se una delle due coppie corrisponde esattamente a tale condizione, viene visualizzato UN avviso. I dat
The indicator scans for Dinapoli thrust pattern in multiple timeframes for the all markets filtered and shows the results on Dashboard. Key Features Dashboard can be used for all markets It can scan for thrust pattern on MN1, W1, D1, H4, H1, M30, M15 ,M5, M1 timeframes Ability to choose number of bars required above/below displaced moving average to define thrust Parameters UseMarketWatch: Set true to copy all symbols available in market watch MarketWatchCount : Set the number of symbols that
News Clock
Victor Klenov
The professional browser of News and Trading Sessions is now available in MetaTrader 5. Now all the most important market information is collected on one dial! News located on the Time scale. Planning your working time has never been so easy and convenient ... The news scale can be switched a day, two, a week, a month forward or backward (see the details in the short video). All news updates in real time. Thanks to the built-in filters, you can configure the display of news by importance, cou
1. Why did I develop this series of indicators I found that most traders need to use multiple time frame indicators. They usually switch time frame to see indicators. However, once the timeframe is switched, you cannot see the  corresponding relationship  between  the price in the smaller timeframe  and  the indicator in the larger timeframe . For example: if your price chart is in H1 timeframe, you can see H4, D1 and W1 indicators in H1 timeframe Chart. This is more helpful for you to find th
AW Classic MACD MT5
AW Trading Software Limited
4.67 (27)
Modified oscillator MACD. A classic indicator that combines a trend indicator with an oscillator to detect entry points. Has a multi-timeframe panel and 3 types of notifications Benefits: Works on all instruments and timeseries Trend indicator with   oscillator for inputs Multi-period panel on all timeframes Pluggable arrows when signals appear Three types of notifications: push, email, alert MT4 version ->  HERE  / Our news ->  HERE     How the indicator works: AW Classic MACD - Indicator of
FREE
YK Smart EMA
Peechanat Chatsermsak
The YK-SMART-EMA is an indicator that displays multiple Exponential Moving Average (EMA) lines on a price chart to help analyze price trends. This indicator features five EMA lines: EMA14 (red line): Calculated based on the closing prices of the last 14 candles. EMA30 (blue line): Calculated based on the closing prices of the last 30 candles. EMA50 (green line): Calculated based on the closing prices of the last 50 candles. EMA100 (orange line): Calculated based on the closing prices of the last
FREE
Cybercycle Trend
Muhammed Emin Ugur
Introducing the "Cybercycle Trend" Forex Oscillator, a powerful technical indicator designed to enhance your trading experience in the foreign exchange market. This innovative tool utilizes advanced algorithms to identify and analyze market trends, providing you with valuable insights and helping you make informed trading decisions. The Cybercycle Trend Forex Oscillator is specifically designed to detect and measure cyclical price movements in the forex market. By incorporating this oscillator
FREE
Gli utenti di questo prodotto hanno anche acquistato
Trend Screener Pro MT5
STE S.S.COMPANY
4.84 (76)
Indicatore di tendenza, soluzione unica rivoluzionaria per il trading di tendenze e il filtraggio con tutte le importanti funzionalità di tendenza integrate in un unico strumento! È un indicatore multi-timeframe e multi-valuta al 100% non ridipingibile che può essere utilizzato su tutti i simboli/strumenti: forex, materie prime, criptovalute, indici e azioni. Trend Screener è un indicatore di tendenza che segue un indicatore efficiente che fornisce segnali di tendenza a freccia con punti nel gra
Golden Trend Indicator MT5
Noha Mohamed Fathy Younes Badr
4.88 (16)
Golden Trend indicator  is The best indicator for predicting trend movement this indicator never lags and never repaints and never back paints    and give  arrow buy and sell    before the candle appear  and it will help you and  will make your trading decisions clearer its work on all currencies and  gold and crypto and all time frame This unique  indicator uses very secret algorithms to catch the  trends, so you can trade using this indicator and see the trend clear on charts  manual guide and
FX Levels MT5
Daniel Stein
5 (3)
FX Levels: Supporti e Resistenze di Precisione Eccezionale per Tutti i Mercati Panoramica Rapida Cercate un modo affidabile per individuare livelli di supporto e resistenza in ogni mercato—coppie di valute, indici, azioni o materie prime? FX Levels fonde il metodo tradizionale “Lighthouse” con un approccio dinamico all’avanguardia, offrendo una precisione quasi universale. Basato sulla nostra esperienza reale con i broker e su aggiornamenti automatici giornalieri più quelli in tempo reale, FX
TPSpro RFI Levels MT5
Roman Podpora
4.53 (19)
ISTRUZIONI       RUS   -   INGLESE       Si   consiglia di utilizzare con un indicatore       -       TPSpro   TENDENZA PRO -   Versione MT4         Un elemento chiave nel trading sono le zone o i livelli da cui vengono prese le decisioni di acquisto o vendita di uno strumento di trading. Nonostante i tentativi dei principali attori di nascondere la loro presenza sul mercato, lasciano inevitabilmente delle tracce. Il nostro compito era imparare a identificare queste tracce e interpretarle corre
TPSproTREND PrO MT5
Roman Podpora
4.65 (17)
TPSpro TREND PRO   è un indicatore di tendenza che analizza automaticamente il mercato, fornisce informazioni sulla tendenza e sui rispettivi cambiamenti e fornisce segnali per entrare nelle operazioni senza ridisegnare. L'indicatore utilizza ciascuna candela e la analizza separatamente. Si riferisce a vari shock al rialzo o al ribasso. Punto di ingresso preciso per il trading di valute, criptovalute, metalli, azioni e indici! Versione MT5                   Descrizione completa dell'indicatore  
FX Power MT5 NG
Daniel Stein
5 (11)
FX Power: Analizza la Forza delle Valute per Decisioni di Trading Più Intelligenti Panoramica FX Power è lo strumento essenziale per comprendere la reale forza delle principali valute e dell'oro in qualsiasi condizione di mercato. Identificando le valute forti da comprare e quelle deboli da vendere, FX Power semplifica le decisioni di trading e rivela opportunità ad alta probabilità. Che tu segua le tendenze o anticipi inversioni utilizzando valori estremi di Delta, questo strumento si adatta
FX Volume MT5
Daniel Stein
4.82 (17)
FX Volume: Scopri il Vero Sentimento di Mercato dalla Prospettiva di un Broker Panoramica Rapida Vuoi portare la tua strategia di trading a un livello superiore? FX Volume ti offre informazioni in tempo reale su come i trader retail e i broker sono posizionati—molto prima che compaiano report in ritardo come il COT. Che tu miri a guadagni costanti o desideri semplicemente un vantaggio più solido sui mercati, FX Volume ti aiuta a individuare grandi squilibri, confermare i breakout e perfezionar
Top indicator for MT5   providing accurate signals to enter a trade without repainting! It can be applied to any financial assets:   forex, cryptocurrencies, metals, stocks, indices .  Watch  the video  (6:22) with an example of processing only one signal that paid off the indicator! MT4 version is here It will provide pretty accurate trading signals and tell you when it's best to open a trade and close it. Most traders improve their trading results during the first trading week with the help of
IX Power MT5
Daniel Stein
4.86 (7)
IX Power: Scopri approfondimenti di mercato per indici, materie prime, criptovalute e forex Panoramica IX Power è uno strumento versatile progettato per analizzare la forza di indici, materie prime, criptovalute e simboli forex. Mentre FX Power offre la massima precisione per le coppie di valute utilizzando i dati di tutte le coppie disponibili, IX Power si concentra esclusivamente sui dati di mercato del simbolo sottostante. Questo rende IX Power una scelta eccellente per mercati non correlat
Quantum TrendPulse
Bogdan Ion Puscasu
5 (13)
Ecco   Quantum TrendPulse   , lo strumento di trading definitivo che combina la potenza di   SuperTrend   ,   RSI   e   Stocastico   in un unico indicatore completo per massimizzare il tuo potenziale di trading. Progettato per i trader che cercano precisione ed efficienza, questo indicatore ti aiuta a identificare con sicurezza le tendenze di mercato, i cambiamenti di momentum e i punti di entrata e uscita ottimali. Caratteristiche principali: Integrazione SuperTrend:   segui facilmente l'andame
Matrix Arrow Indicator MT5
Juvenille Emperor Limited
5 (13)
Matrix Arrow Indicator MT5   è un trend unico 10 in 1 che segue un indicatore multi-timeframe al   100% non ridipinto   che può essere utilizzato su tutti i simboli/strumenti:   forex ,   materie prime ,   criptovalute ,   indici ,   azioni .  Matrix Arrow Indicator MT5  determinerà la tendenza attuale nelle sue fasi iniziali, raccogliendo informazioni e dati da un massimo di 10 indicatori standard, che sono: Indice di movimento direzionale medio (ADX) Indice del canale delle materie prime (CCI
FX Dynamic: Monitora volatilità e trend con un’analisi ATR personalizzabile Panoramica FX Dynamic è uno strumento potente che sfrutta i calcoli di Average True Range (ATR) per fornire ai trader informazioni impareggiabili sulla volatilità, sia giornaliera che intraday. Impostando soglie di volatilità chiare—ad esempio 80%, 100%, 130%—puoi individuare rapidamente opportunità di profitto o ricevere avvisi quando il mercato supera i range abituali. FX Dynamic si adatta al fuso orario del tuo brok
This indicator is based on the mathematics of the great trader W.D. Ganna. With its help, you can easily find strong levels by analyzing swings to find the optimal entry point. The indicator works on all instruments and all timeframes. The indicator is fully manual and has control buttons. All you need to do is press the NEW button, a segment will appear, which you can place on any movement, swing or even 1 candle that you want to analyze. By placing the segment, press the OK button. A grid (th
Support And Resistance Screener è in un indicatore di livello per MetaTrader che fornisce più strumenti all'interno di un indicatore. Gli strumenti disponibili sono: 1. Screener della struttura del mercato. 2. Zona di ritiro rialzista. 3. Zona di ritiro ribassista. 4. Punti pivot giornalieri 5. Punti pivot settimanali 6. Punti pivot mensili 7. Forte supporto e resistenza basati sul modello e sul volume armonici. 8. Zone a livello di banca. OFFERTA A TEMPO LIMITATO: il supporto HV e l'indicatore
Innanzitutto, vale la pena sottolineare che questo Strumento di Trading è un Indicatore Non-Ridipingente, Non-Ridisegnante e Non-Laggante, il che lo rende ideale per il trading professionale. Corso online, manuale utente e demo. L'Indicatore Smart Price Action Concepts è uno strumento molto potente sia per i nuovi che per i trader esperti. Racchiude più di 20 utili indicatori in uno solo, combinando idee di trading avanzate come l'Analisi del Trader del Circolo Interno e le Strategie di Tradin
Questo cruscotto mostra gli ultimi   pattern armonici   disponibili per i simboli selezionati, in modo da risparmiare tempo ed essere più efficienti /   versione MT4 . Indicatore gratuito:   Basic Harmonic Pattern Colonne dell'indicatore Symbol :   vengono visualizzati i simboli selezionati Trend:   rialzista o ribassista Pattern:   tipo di pattern (gartley, butterfly, bat, crab, shark, cypher o ABCD) Entry:   prezzo di ingresso SL:   prezzo di stop loss TP1:   1 prezzo di take profit TP2:
Gold Stuff mt5
Vasiliy Strukov
4.92 (173)
Gold Stuff mt5 è un indicatore di tendenza progettato specificamente per l'oro e può essere utilizzato anche su qualsiasi strumento finanziario. L'indicatore non ridisegna e non è in ritardo. Periodo consigliato H1. Contattami subito dopo l'acquisto per avere le impostazioni e un bonus personale!   I risultati in tempo reale possono essere visualizzati qui.  Puoi ottenere una copia gratuita del nostro indicatore Strong Support e Trend Scanner, per favore scrivi in ​​privato. M   IMPOSTAZIONI
Bill Williams Advanced
Siarhei Vashchylka
5 (9)
Bill Williams Advanced is designed for automatic chart analysis using Bill Williams' "Profitunity" system. The indicator analyzes four timeframes at once. Manual (Be sure to read before purchasing) Advantages 1. Automatically analyzes the chart using the "Profitunity" system of Bill Williams. The found signals are placed in a table in the corner of the screen. 2. Equipped with a trend filter based on the Alligator indicator. Most of the system signals are recommended to be used only according t
Gartley Hunter Multi
Siarhei Vashchylka
5 (9)
Gartley Hunter Multi - An indicator for searching for harmonic patterns simultaneously on dozens of trading instruments and on all possible timeframes. Manual (Be sure to read before purchasing) | Version for MT4 Advantages 1. Patterns: Gartley, Butterfly, Shark, Crab. Bat, Alternate Bat, Deep Crab, Cypher 2. Simultaneous search for patterns on dozens of trading instruments and on all possible timeframes 3. Search for patterns of all possible sizes. From the smallest to the largest 4. All fou
PZ Trend Trading MT5
PZ TRADING SLU
3.8 (5)
Capture every opportunity: your go-to indicator for profitable trend trading Trend Trading is an indicator designed to profit as much as possible from trends taking place in the market, by timing pullbacks and breakouts. It finds trading opportunities by analyzing what the price is doing during established trends. [ Installation Guide | Update Guide | Troubleshooting | FAQ | All Products ] Trade financial markets with confidence and efficiency Profit from established trends without getting whip
Gold Trend 5
Sergei Linskii
3.5 (2)
Gold Trend - è un buon indicatore tecnico azionario. L'algoritmo dell'indicatore analizza il movimento del prezzo di un asset e riflette la volatilità e le potenziali zone di ingresso. I migliori segnali dell'indicatore: - Per VENDERE = istogramma rosso + puntatore SHORT rosso + freccia di segnale gialla nella stessa direzione. - Per l'ACQUISTO = istogramma blu + puntatore LONG blu + freccia di segnale acquatica nella stessa direzione. Vantaggi dell'indicatore: 1. L'indicatore produce seg
PZ Swing Trading MT5
PZ TRADING SLU
5 (5)
Protect against whipsaws: revolutionize your swing trading approach Swing Trading is the first indicator designed to detect swings in the direction of the trend and possible reversal swings. It uses the baseline swing trading approach, widely described in trading literature. The indicator studies several price and time vectors to track the aggregate trend direction and detects situations in which the market is oversold or overbought and ready to correct. [ Installation Guide | Update Guide | Tro
FourAverageMT5
Mikhail Sergeev
5 (2)
FourAverage è una nuova parola nel rilevamento delle tendenze. Con lo sviluppo della tecnologia dell'informazione e un gran numero di partecipanti, i mercati finanziari sono sempre meno analizzabili da indicatori obsoleti. I mezzi tecnici convenzionali di analisi, come la media mobile o lo stocastico, nella loro forma pura non sono in grado di determinare le direzioni di una tendenza o la sua inversione. Un indicatore può indicare la giusta direzione del prezzo futuro, senza cambiare i suoi para
Quantum Trend Sniper
Bogdan Ion Puscasu
4.73 (51)
Presentazione       Quantum Trend Sniper Indicator   , l'innovativo indicatore MQL5 che sta trasformando il modo in cui identifichi e scambi le inversioni di tendenza! Sviluppato da un team di trader esperti con un'esperienza di trading di oltre 13 anni,       Indicatore Quantum Trend Sniper       è progettato per spingere il tuo viaggio di trading verso nuove vette con il suo modo innovativo di identificare le inversioni di tendenza con una precisione estremamente elevata. *** Acquista Quantum
Auto Order Block with break of structure based on ICT and Smart Money Concepts (SMC) Futures Break of Structure ( BoS )             Order block ( OB )            Higher time frame Order block / Point of Interest ( POI )    shown on current chart           Fair value Gap ( FVG ) / Imbalance   -  MTF      ( Multi Time Frame )    HH/LL/HL/LH  -  MTF      ( Multi Time Frame )  Choch  MTF      ( Multi Time Frame )  Volume Imbalance     ,  MTF          vIMB Gap’s Power of 3 Equal High / Low’s  
Golden Spikes Detector
Batsirayi L Marango
3.25 (4)
Golden Spikes Detector This indicator is based on an advanced strategy primarily for trading spikes on Boom and Crash Indices. Complex algorithms were implemented to detect high probability entries only. It alerts on potential Buy and Sell entries. To trade spikes on the Deriv or Binary broker, only take Buy Boom and Sell Cash alerts. It was optimised to be loaded on 5-minute timeframe although multiple timeframe analysis is done in the background. Features ·             Desktop pop up and sound
Atomic Analyst MT5
Issam Kassas
4.32 (19)
Innanzitutto, vale la pena sottolineare che questo indicatore di trading non è repaint, non è ridisegno e non presenta ritardi, il che lo rende ideale sia per il trading manuale che per quello automatico. Manuale utente: impostazioni, input e strategia. L'Analista Atomico è un indicatore di azione del prezzo PA che utilizza la forza e il momentum del prezzo per trovare un miglior vantaggio sul mercato. Dotato di filtri avanzati che aiutano a rimuovere rumori e segnali falsi, e aumentare il pote
Dark Absolute Trend   is an Indicator for intraday trading. This Indicator is based on   Trend Following  strategy but use also candlestick patterns and Volatility. We can enter in good price with this Indicator, in order to follow the main trend on the current instrument. It is advised to use low spread ECN brokers. This Indicator does   Not repaint   and   N ot lag . Recommended timeframes are M5, M15 and H1. Recommended working pairs: All. I nstallation and  Update Guide   -  Troubleshooting
RelicusRoad Pro MT5
Relicus LLC
4.78 (18)
Ora $ 147 (aumentando a $ 499 dopo alcuni aggiornamenti) - account illimitati (PC o MAC) Manuale utente di RelicusRoad + Video di formazione + Accesso al gruppo Discord privato + Stato VIP UN NUOVO MODO DI GUARDARE IL MERCATO RelicusRoad è l'indicatore di trading più potente al mondo per forex, futures, criptovalute, azioni e indici, fornendo ai trader tutte le informazioni e gli strumenti di cui hanno bisogno per rimanere redditizi. Forniamo analisi tecniche e piani di trading per aiutare og
Black Dragon indicator mt5
Ramil Minniakhmetov
4.83 (58)
L'indicatore di rilevamento delle tendenze integrerà qualsiasi strategia e può anche essere utilizzato come strumento indipendente. IMPORTANTE! Contattami subito dopo l'acquisto per ricevere istruzioni e un bonus!  Vantaggi Facile da usare, non sovraccarica il grafico con informazioni non necessarie; Possibilità di utilizzo come filtro per qualsiasi strategia; Ha livelli integrati di supporto e resistenza dinamici, che possono essere utilizzati sia per la presa di profitto che per impostare
Altri dall’autore
AI Moving Average
Polyware Yazilim Hizmetleri Limited Sirketi
Bienvenue dans une nouvelle ère de trading avec l'indicateur AI Moving Average, un indicateur avancé MetaTrader 5 conçu pour fournir aux traders des insights prédictifs sur les mouvements du marché. Cet outil combine la puissance de l'IA avec la fiabilité d'une moyenne mobile exponentielle sans décalage pour offrir des prévisions précises et opportunes des tendances futures des prix. Modèle de Régression Linéaire Innovant Le AI Moving Average utilise un modèle de machine learning de régression l
FREE
Filtro:
Nessuna recensione
Rispondi alla recensione