Purtroppo, "BBMA Oma Aly Indicator" non è disponibile
Puoi consultare altri prodotti di Ricky Andreas:

FREE UNLIMITED PM: https ://linktr .ee /ARFXAUTOTRADE ?utm_source =linktree_admin_share The Trend Line is an essential tool for traders, whether you're mapping trends or looking for counter-trend opportunities. I’m excited to share my custom Auto Trend Line Indicator, designed to make it easier for you to analyze the market. How to Use the Trend Line: Trend Following: Wait for the trend line to return and touch it, forming a continuation pattern on the candlestick. This is your signal to follow
FREE

The BBMA Multi Time Frame Trend Monitoring tool is designed to help everyone easily monitor trend movements on a single screen without having to switch between time frames. Always prioritize waiting for a complete BBMA Full Setup before we follow and focus on the trend direction. For entries, continue to use the BBMA Oma Aly SOP. Don't forget to prioritize Risk-Reward (R ) during entry.
FREE

I’m excited to introduce the Alligator Indicator, designed with a multi-time frame approach to enhance your trading experience! With this tool, you can easily act on signals as they appear. If you see a Buy signal on the D1 or H4 time frames, take a moment to check the trend line breakout or Fibo Musang CBR for confirmation. For your Risk-Reward strategy, we recommend using the Fibo Musang CBR levels to optimize your trades. This indicator offers two powerful signals: Multi-Time Frame H4 and D1
FREE

Introducing our innovative indicator, designed with a multi-time frame trend monitoring system! This powerful tool combines several trend signals into one easy-to-use reference signal in the panel, complete with alert features to keep you informed. To maximize its effectiveness, make sure to master the Fibo Musang candle break retest technique—it will greatly enhance your trading experience. For entries, simply keep an eye on the signal in the top left corner. This will guide you in identifying
FREE

This indicator is used to measure bullish and bearish candles on each time frame and I provide notifications for reminders
Indikator ini digunakan untuk mengukur bullish dan bearish candle pada setiap time frame dan saya berikan notifikasi untuk pengingat
This indicator is used to measure bullish and bearish candles on each time frame and I provide notifications for reminders
FREE

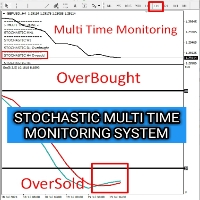
I’m thrilled to present the Stochastic Indicator, designed for multi-time frame monitoring! This tool allows you to effortlessly track Overbought and Oversold conditions in real-time, all on a single screen. My goal is for this indicator to support you in your analysis and help you capture those perfect trading moments using your own strategies. If you find this indicator helpful, I’d greatly appreciate your support by liking my channel and giving it a 5-star rating! Your feedback inspires me to
FREE

I’m excited to introduce the RSI Indicator, designed for multi-time frame monitoring! This powerful tool allows you to track Overbought and Oversold conditions in real-time, all on a single screen. My hope is that this indicator will assist you in your analysis and help you seize trading opportunities with your own trading system. If you find this indicator valuable, I’d greatly appreciate your support by liking my channel and giving it a 5-star rating! Your feedback motivates me to continue im
FREE