Historical News Memory Ticks
- Indicatori
- Marat Sultanov
- Versione: 1.31
- Aggiornato: 3 maggio 2024
- Attivazioni: 15
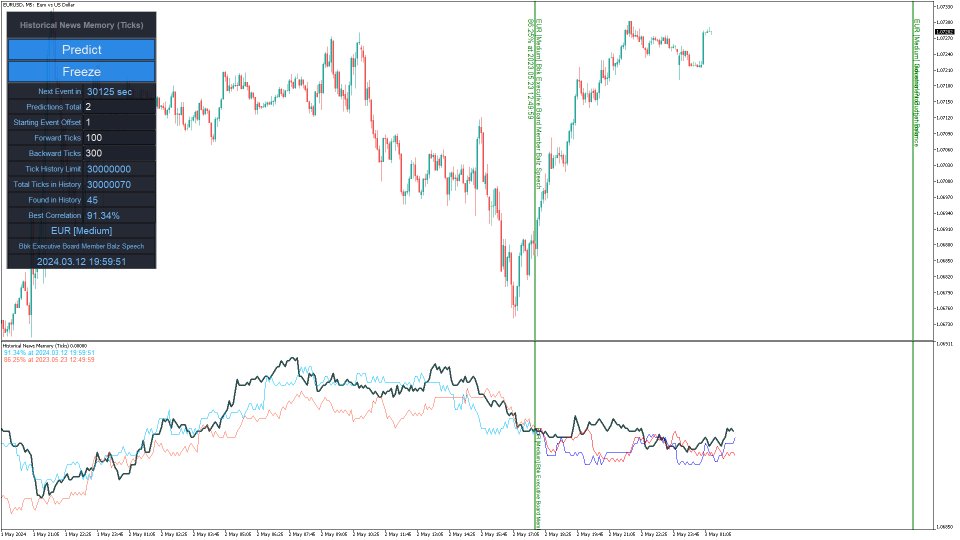
Do you want to know how an economic event will impact price? What will happen to price after the news? How has an economic news affected price in the past? This indicator can help you with that.
Do you like technical analysis? Do you enjoy studying the tick history to predict the future? But what do you think could be more important than technical analysis, what could improve technical analysis? Of course, it's fundamental analysis! After all, economic events directly impact the market, and therefore future price movement. But how exactly do news impact price? How does each economic event affect the price of each financial instrument? There are a lot of different economic events and it can be difficult to understand how each one affects different financial instruments.
But what if you could look at an economic event in tick history and try to understand its direct impact? What if you could search for the news in the past, on a section of tick history where the market state is most similar to the current state and then see how the news changed price?
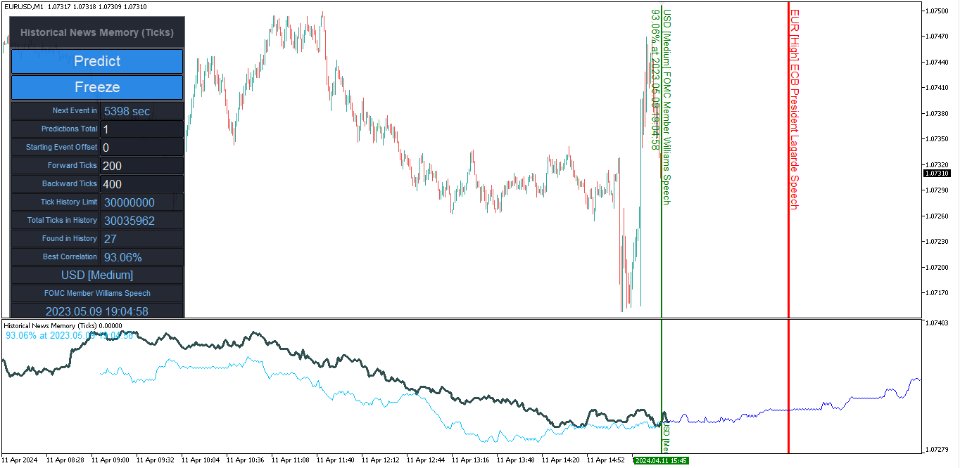
This indicator will do that, and automatically too. It will analyze the entire tick history and all historical economic events that have occurred in the past, and predict and show future market movement immediately upon the occurrence of the event.
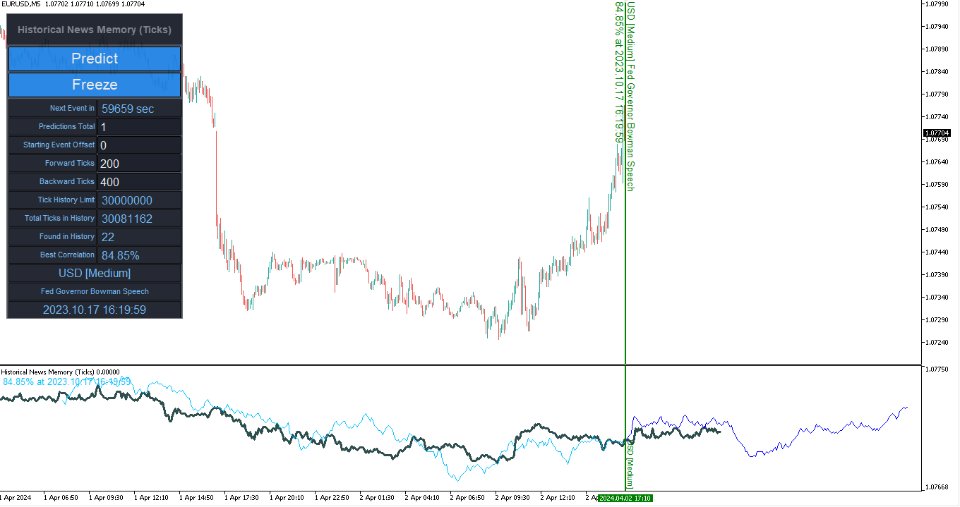
How does it analyze? It searches for similar economic events and similar sections in tick history that have the highest correlation with the current market state and the current economic event. Then it makes a prediction and draws future ticks immediately upon the occurrence of the news. These predicted ticks show how price in history changed after the occurrence of an economic event on a section of history similar to the current one.
Advantages:
- The indicator can work in the strategy tester. It has a built-in database of economic events. And when launched on a live chart, it will automatically update its database.
- There is a graphical user interface. This simplifies and speeds up the work with the indicator.
- The indicator shows future economic events on the chart. This will help to see future events on the chart before they occur.
- Displays the tick history in a separate window.
- There is an alert function at the occurrence of an economic event.
- Three methods of correlation calculation: Pearson, Spearman, Kendall.
Main Settings.
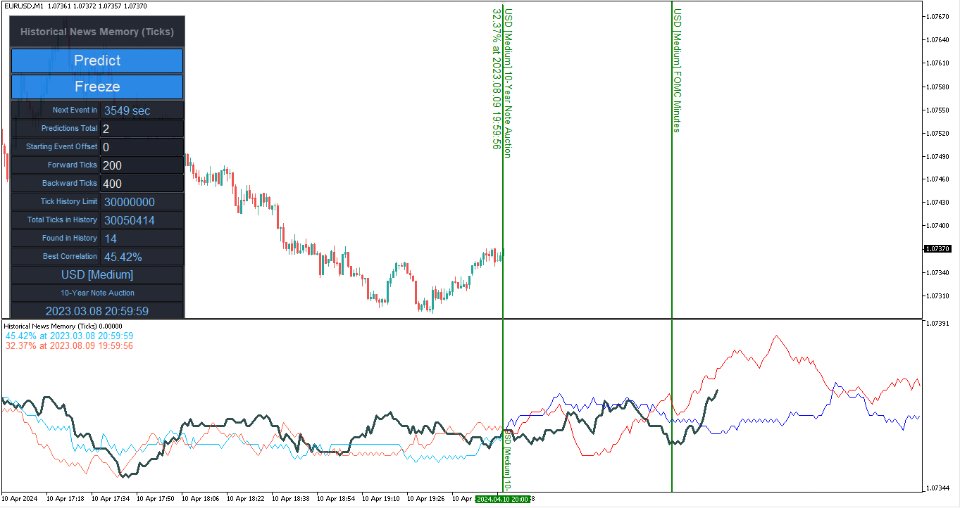
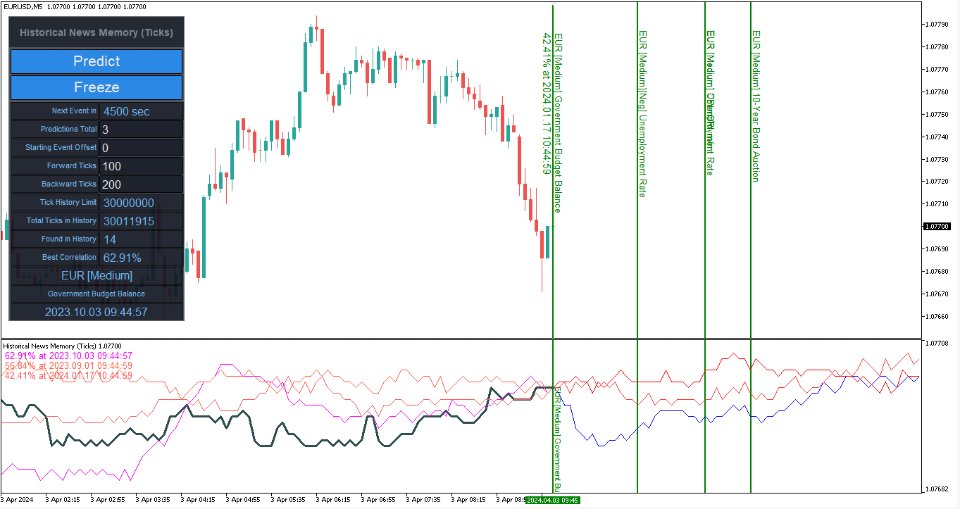
- Predictions Total [1...10] - number of forecasts for one event. Forecasts are shown in order of correlation. Values from 1 to 10.
- Start Event Offset [0...) - the offset of the initial event from which the prediction starts. The offset is in the direction of history. 0 means to make a prediction from the current event. 1 means to make a prediction from the previous event.
- Draw Mode - the type of prediction display.
Prediction
- Freeze - prediction freeze. True is the prediction will not be automatically recalculated when new events occur.
- Correlation Method - the formula for calculating the correlation coefficient: Pearson, Spearman, Kendall.
- Correlation Filter in % (0 is OFF) [0...100] - the correlation filter in percent. If the found correlation of the prediction is below this value, then the prediction is not displayed. At 0, the function is not used.
- Minimum Prediction Movement(in spreads) - if a non-zero value is specified, then only those forecasts will be shown whose movement amplitude (measured in the size of the spread) exceeds the specified value.
- Forward: number of ticks [1...) - the number of predicted ticks.
- Backward: number of ticks [1...) - the number of ticks for calculating the correlation.
- Ticks History Limit - the limit of the number of ticks in history for searching for events for the prediction. This setting is needed if you need to analyze a limited depth of tick history.
- Max. Ticks in Chart [1...) - the maximum number of ticks displayed on the chart.
Economic Events
- Show Future Events Up to (in minutes, 0 is OFF) - display future economic events that will occur not later than the specified number of minutes.
- Currencies Filter - currency filter:
- - 'Auto(current contract)' - the currencies of the current contract will be used (the currency of profit and the currency in which margin is calculated).
- - 'Manual' - the list of currencies is specified manually using the 'Currencies Filter' parameter.
- - 'OFF(use all currencies)' - do not use the filter. All currencies will be used.
- Currencies Filter (If 'Currencies Filter'=Manual) - the list of currencies (separated by commas) for the mode "Currencies Filter" = 'Manual'.
- Allowed Events List (separated by semicolons) - list of allowed events separated by semicolons.
- Allowed Events ID List (separated by semicolons) - this is a list of allowed event IDs for filtering.

