• Panoramica
  • Recensioni
  • Commenti

Keltner Trend Pro

Keltner Trend Pro - Unleash the Power of Price Action!

Are you ready to transform your trading approach? Meet Keltner Trend Pro, an Expert Advisor meticulously crafted to harness the dynamic movements of the market using the renowned Keltner Channel and Average True Range (ATR) indicators.

Limited-time Special Opportunity:

Seize the moment! Be among the first 10 (Purchasing 0/10) to seize this unique opportunity, and not only will you acquire a top-tier trading algorithm but also enjoy an exclusive discount. Don’t delay; this could be your key to trading success with just a few clicks. Grab it now and prepare to elevate your trading experience!

Note: This offer is available solely to the first 10 purchasers. Don’t miss out on this one-of-a-kind chance!

Key Features:

Keltner Channel Analysis:

The Keltner Channel isn't just another indicator; it's an envelope of Moving Averages that adapts to market conditions. Keltner Trend Pro leverages this potent tool to identify trends and potential reversals.

ATR Volatility:

Average True Range (ATR) plays a pivotal role in adjusting the width of the Keltner Channel, reflecting the instrument's volatility. Low ATR values indicate consolidation, while high ATR values signify strong trends.

Price Action Mastery:

Bid farewell to complex indicators. Keltner Trend Pro excels in Price Action Trading, focusing on the raw movement of prices and candlestick patterns to pinpoint trading opportunities.


What Sets Keltner Trend Pro Apart?

Price Action Trend Following:


This Indicator is a master at tracking Price Action Trends. It analyzes candlestick patterns and price shifts in real-time, executing buy or sell orders swiftly when opportunities arise.


Take control with Keltner Trend Pro Parameters

HISTORY : The number of bars to consider for history. Choose from:

  • 288: D1/M5
  • 576: D2/M5
  • 864: D3/M5
  • 1152: D4/M5
  • 1440: D5/M5

INDICATOR :

  • FastTimeFrame: Timeframe for fast moving average. Default: PERIOD_CURRENT

  • SlowTimeFrame: Timeframe for slow moving average. Default: PERIOD_CURRENT

  • Interpolation: Interpolation method. Default: Intp0

  • FastLength: Period for the fast moving average. Default: 13

  • SlowLength: Period for the slow moving average. Default: 55

  • FastMethod: Method for calculating the fast moving average. Default: MODE_LWMA

  • SlowMethod: Method for calculating the slow moving average. Default: MODE_LWMA

  • FastPrice: Applied price for the fast moving average. Default: PRICE_CLOSE

  • SlowPrice: Applied price for the slow moving average. Default: PRICE_CLOSE

  • FastShift: Shift for the fast moving average. Default: 0

  • SlowShift: Shift for the slow moving average. Default: 0

  • FastATRperiod: Period for the fast ATR (Average True Range). Default: 255

  • SlowATRperiod: Period for the slow ATR (Average True Range). Default: 255

  • FastKoef: Coefficient for the fast Keltner Channel. Default: 2.618

  • SlowKoef: Coefficient for the slow Keltner Channel. Default: 3.323

INDICATOR COLOR :

  • OverBT: Color for overbought levels. Default: clrDarkOrange
  • OverSD: Color for oversold levels. Default: clrDodgerBlue
  • OverSize: Size of the indicator levels. Default: 8
  • ChartAboveInduk: Indicator placement, true for above the chart. Default: true

BUTTON STYLING

  • buttColor: Text color for the button. Default: clrAqua
  • buttSize: Text size for the button. Default: 10
  • backColor: Background color for the button. Default: clrCrimson
  • axisX: X-axis position of the button. Default: 0
  • axisY: Y-axis position of the button. Default: 345
  • buttCorner: Base corner for the button. Default: CORNER_LEFT_UPPER
  • buttWindow: Window in which the button appears. Default: 0
  • buttName: Text for the button. Default: "KeltnerTrendPro"

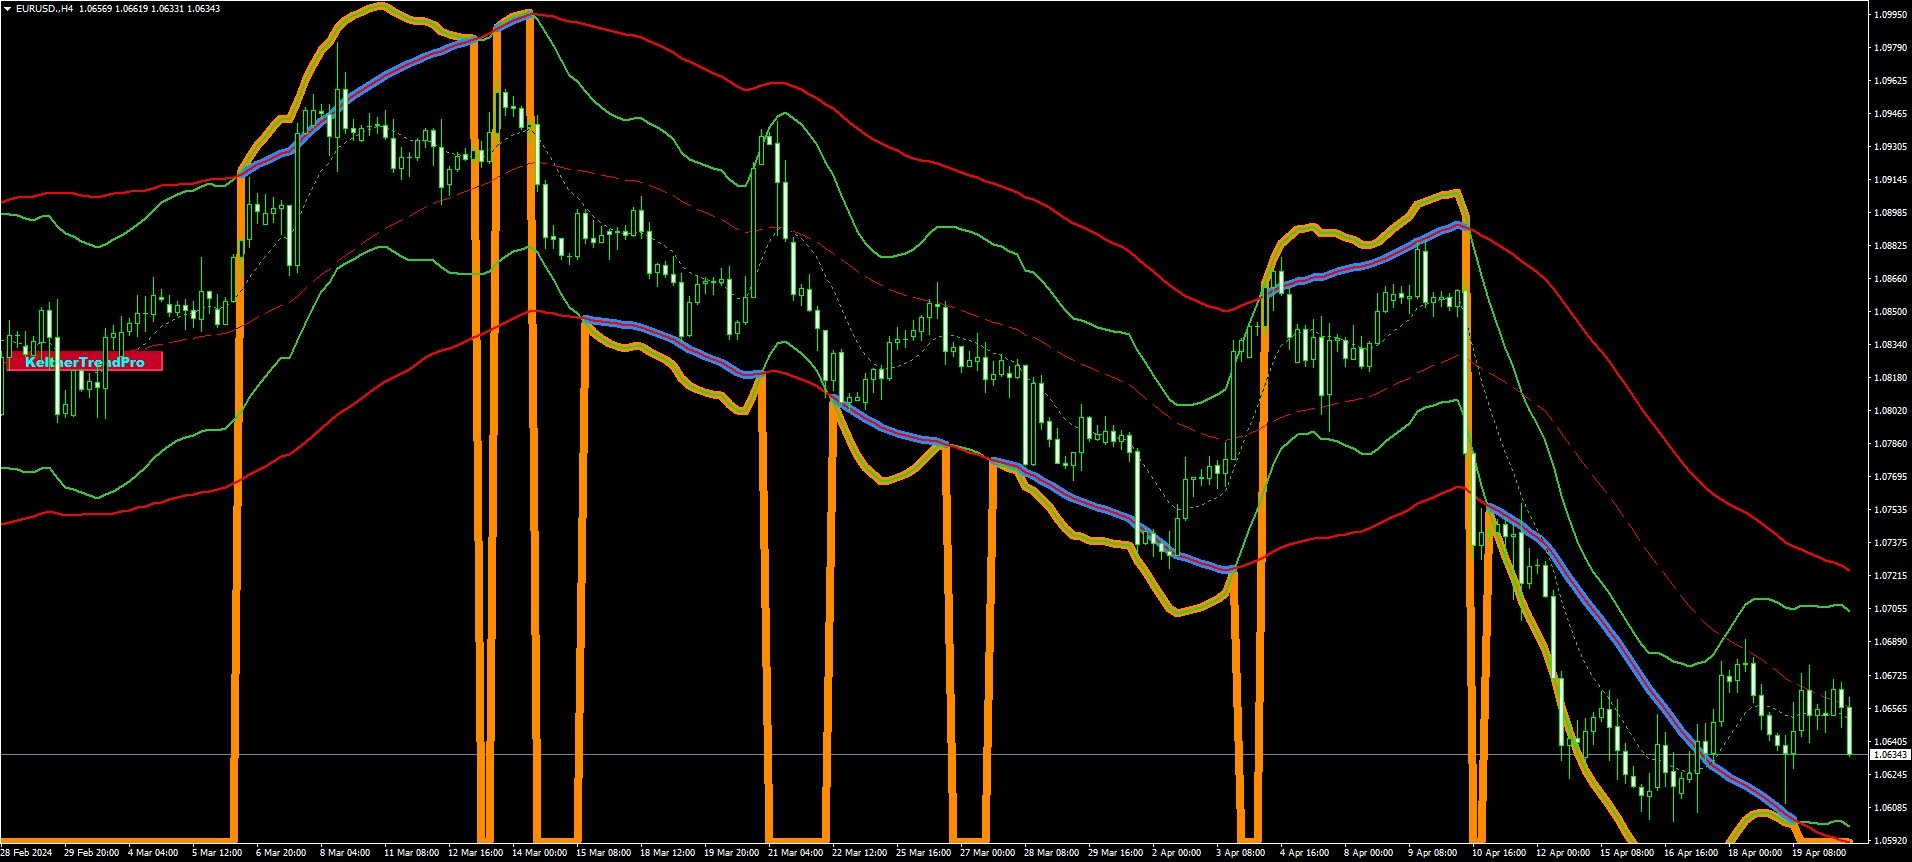
Entry Logic with Indicator Colors:

Let's delve into the entry logic of the Keltner Trend Pro indicator using the colors you've chosen:

Keltner Channel Colors:

  • Line Above (OverBT): Dark Orange ( clrDarkOrange )
  • Line Below (OverSD): Dodger Blue ( clrDodgerBlue )

Entry Logic:

Buy Signal:

  • Price Crosses Above OverBT (Dark Orange):

    • When the price crosses above the upper Keltner Channel line ( OverBT ), which is indicated by dark orange, it suggests a potential buy signal.
    • This signifies that the price is breaking above the upper channel, potentially indicating an uptrend.
  • Confirmation with ATR and Color:

    • Look for a simultaneous increase in the ATR (Average True Range) period ( FastATRperiod and SlowATRperiod ).
    • If the ATR values are high and the upper line of the Keltner Channel (dark orange) widens, it further confirms a strong trend.
    • When the upper Keltner Channel line (dark orange) widens due to higher ATR values, it suggests a potential opportunity to enter a buy trade.

Sell Signal:

  • Price Crosses Below OverSD (Dodger Blue):

    • When the price crosses below the lower Keltner Channel line ( OverSD ), which is indicated by dodger blue, it suggests a potential sell signal.
    • This signifies that the price is breaking below the lower channel, potentially indicating a downtrend.
  • Confirmation with ATR and Color:

    • Look for a simultaneous increase in the ATR (Average True Range) period ( FastATRperiod and SlowATRperiod ).
    • If the ATR values are high and the lower line of the Keltner Channel (dodger blue) widens, it further confirms a strong downtrend.
    • When the lower Keltner Channel line (dodger blue) widens due to higher ATR values, it suggests a potential opportunity to enter a sell trade.

Summary:

  • Buy Signal: Price crossing above the upper Keltner Channel line ( OverBT - Dark Orange), accompanied by a widening of the channel due to increased ATR.
  • Sell Signal: Price crossing below the lower Keltner Channel line ( OverSD - Dodger Blue), accompanied by a widening of the channel due to increased ATR.

These color-coded signals provide visual cues for potential entry points based on the Keltner Channel's upper and lower lines, along with confirmation from ATR. It's a way to visually interpret the strength of potential trends and volatility in the market

Advanced Risk Management:

  • Trailing Stop: Secure your profits with a Trailing Stop that adjusts to market conditions.
  • Personalized Risk Settings: Set MaxDrawdown, MaxLoss, and Stop Loss (SL) levels to protect your capital.
  • Trade Hours: Define your preferred trading hours with StartHour and EndHour settings.

Commission-Friendly:

Optimized for Low Costs: Keltner Trend Pro considers commission fees, ensuring your trading costs are kept in check.

Broker Recommendations:

For optimal performance, we recommend regulated brokers with low spreads and minimal slippage. Find a broker that complements Keltner Trend Pro's strategy for the best results.

VPS Compatibility:

Ensure uninterrupted trading with a Virtual Private Server (VPS). Keltner Trend Pro operates seamlessly on VPS services, maintaining a stable connection and minimal latency.


How to Get Started:

  1. Purchase Keltner Trend Pro today and be among the first to benefit from our exclusive offer.
  1. Customize the parameters to match your trading style and risk profile.
  1. Install Keltner Trend Pro on your MetaTrader 4 platform and watch as it identifies lucrative trading opportunities.

Disclaimer:

Before using any Indicator, it's crucial to understand its logic and conduct thorough testing on a demo account. Trading carries risks, and past performance does not guarantee future results. Make informed decisions and trade responsibly with Keltner Trend Pro.

Seize Control of Your Trading Journey with Keltner Trend Pro!

Don't wait for success; create it with Keltner Trend Pro. Revolutionize your trading strategy today and unlock the potential of Price Action Trading.


Prodotti consigliati
Sto Signal AM
Andriy Matviyevs'kyy
5 (1)
This indicator displays Stochastic osc signals on the price chart and allows the user to receive notifications of such signals. The Stochastic indicator is a classic and proven indicator of the technical analysis of the markets. Despite its age, it is still relevant today. Depending on the settings, the indicator allows you to work effectively on various TFs and any markets. Signals are given on fully formed bars and are not redrawn. Custom Parameters: Stochastic_Price (0-1) - The applied pric
FREE
With this easy to set up indicator you can display and set alerts for the following candlestick formations: Bull Breakout, Bear Breakout, Hammer, Pin, Bullish Engulfing, Bearish Engulfing. I'd appreciate if you would review the indicator Input parameters: ShortArrowColor: The color of the Arrows, displaying a Bearish candle formation LongArrowColor: The color of the Arrows displaying a Bullish candle formation BullishEngulfing: Disabled/Enabled/EnabledwithAlert BearishEngulfing:   Disabled/Ena
FREE
BE auto
Muhammad Ridzuan Mohd Radzali
5 (2)
Indicator automatically draw bullish and bearish engulfing without any rules. Bearish and Bullish engulf is well known area for supply and demand area marking. This indicator can be used in any strategy that required supply demand zone. Show Last Engulf : Enable this option to show unfresh engulfing  Candle to calculate : set 0 will load all history bar and can use up more memory Bearish Engulfing Colour : Pick any colour that suit Bearish Engulfing Colour  : Pick any colour that suit -Use thi
FREE
PZ The Zone
PZ TRADING SLU
4.25 (4)
This indicator displays buy or sell signals according to Bill Williams' definition of the Trading Zone. [ Installation Guide | Update Guide | Troubleshooting | FAQ | All Products ] Easy to use and understand Avoid trading flat markets Deterministic indicator with clear rules The indicator is non-repainting It implements alerts of all kinds It has straightforward trading implications. A blue arrow is a buy signal A red arrow is a sell signal According to Bill Williams trading in the zone helps to
FREE
Market Structure Zig Zag
Lesedi Oliver Seilane
4.81 (26)
Free Market structure zig zag to assist in price action trading the screenshots describe how to use and how to spot patterns new version comes with alerts, email alert and  push notification alert can be used on all pairs  can be used on all timeframes  you can add additional confirmation indicators the indicator shows you your higher high and low highs as well as your lower lows and lower highs  the indication makes price action analysis easier to spot.
FREE
Wise Men Indicator demo
Bohdan Kasyanenko
3.67 (3)
The indicator displays signals according to the strategy of Bill Williams on the chart. Demo version of the indicator has the same features as the paid, except that it can work only on a demo account . Signal "First Wise Man" is formed when there is a divergent bar with angulation.  Bullish divergent bar - with lower minimum and closing price in the upper half. Bearish divergent bar - higher maximum and the closing price at the bottom half. Angulation is formed when all three lines of Alligat
FREE
Il Catturatore di Tendenza: La Strategia del Catturatore di Tendenza con Indicatore di Allarme è uno strumento versatile di analisi tecnica che aiuta i trader a identificare le tendenze di mercato e i potenziali punti di ingresso e uscita. Presenta una Strategia dinamica del Catturatore di Tendenza, adattandosi alle condizioni di mercato per una chiara rappresentazione visiva della direzione della tendenza. I trader possono personalizzare i parametri in base alle loro preferenze e tolleranza
FREE
Super Trend is one of the most popular custom indicators that it doesn't provided in metatrader 4 (MT4) platform. Rainbow SuperTrend  has some advantages, there are can display the trend direction and stop loss line based on Average True Range (ATR). This indicator is good to used for trailing stop trading style, because when the price direction is trending the stop loss point can adjust based on supertrend line. It is the high recommended to using this indicator combined with oscillator indicat
FREE
PREVIOUS INDICATOR’S DATA MA CROSSOVER https://www.mql5.com/en/users/earobotkk/seller#products P/S: If you like this indicator, please rate it with 5 stars in the review section, this will increase its popularity so that other users will be benefited from using it. This indicator notifies and draws an arrow on the chart whenever    the MA line has crossed over its previous indicator’s data MA filtered by MA Trend.   It also displays total pips gained from all the entry set-ups. Setting ·   You
FREE
MA Crosses PRO MT4
Volodymyr Hrybachov
5 (1)
MA CROSSES PRO MT4  - arrows indicator of the intersection of moving averages. The indicator parameters have intuitive names and each line is configured separately. The indicator can signal the signal by displaying arrows, giving a sound signal, sending a notification to mobile terminals and e-mail. The indicator is NOT redrawn Signals on closing a candle only Perfect for scalping Works on any pair and any timeframe. The older the time frame, the better the signal. Compatible as an addition to a
BoB Trigger AM
Andriy Matviyevs'kyy
The presented indicator is a development of the ideas contained in the Bulls or Bears AM indicator. This indicator displays the difference between the maximum and minimum prices for the current period of time and the values ​​of the channel built using the maximum and minimum prices for a longer period. An increase in indicator values ​​above zero indicates that the maximum price for the current period is greater than the average value of the maximum prices for the period selected as an indicato
FREE
The indicator allows you to trade binary options. The recommended time frame is М1 and the expiration time is 1,2,3 minutes. The indicator suitable for auto and manual trading. A possible signal is specified as a arrows above/under a candle. You should wait until the candle closes! Arrows are not re-painted Trade sessions: TOKYO section (Half-end) Currency pairs: USD/JPY Working time frame: M1 Expiration time: 1,2,3 minutes. The indicator also shows good results when using the martingale strateg
FREE
Owl smart levels
Sergey Ermolov
4.58 (55)
Versione MT5  |  FAQ L' indicatore Owl Smart Levels   è un sistema di trading completo all'interno dell'unico indicatore che include strumenti di analisi di mercato popolari come i   frattali avanzati di Bill Williams , Valable ZigZag che costruisce   la corretta struttura a onde   del mercato, e i   livelli di Fibonacci che segnano i livelli esatti di entrata nel mercato e luoghi per prendere profitti. Descrizione dettagliata della strategia Istruzioni per lavorare con l'indicatore Consulente-
Ppr PA
Yury Emeliyanov
4.75 (4)
"Ppr PA" is a unique technical indicator created to identify "PPR" patterns on the currency charts of the MT4 trading platform. These patterns can indicate possible reversals or continuation of the trend, providing traders with valuable signals to enter the market. Features: Automatic PPR Detection:   The indicator automatically identifies and marks PPR patterns with arrows on the chart. Visual Signals:   Green and red arrows indicate the optimal points for buying and selling, respectively. A
FREE
Reversal zones x2 free
Andrii Malakhov
2.25 (4)
The indicator looks for buying and selling zones, where a deal can be opened with a minimal stop loss and a better Risk Reward Ratio. The indicator is based on qualitative search of the Double top/Double bottom pattern. This version works only on USDCAD! The full version of the indicator can be purchased here - https://www.mql5.com/en/market/product/29820 Indicator operation principle Looks for local tops/bottoms which can potentially become a Reversal zone It waits for an impulse movement tha
FREE
The indicator allows you to trade binary options. The recommended time frame is М1 and the expiration time is 1 minutes. The indicator suitable for auto and manual trading. A possible signal is specified as a arrows above/under a candle. You should wait until the candle closes! Arrows are not re-painted Trade sessions: London and New York section Currency pairs: AUD/CAD Working time frame: M1 Expiration time: 1 minute The indicator also shows good results when using the martingale strategy - "Ma
FREE
Based on MACD indicator waves with standard parameters Applies Fibonacci levels to the last two MACD waves, positive and negative respectively, if at the moment the MACD indicator runs out of negative Wave - the color is green, if at the moment the MACD indicator runs out of positive Wave - the color is red. The Wave termination criterion is two ticks with a different MACD sign. Applies trend lines on the last four MACD Waves. Works well with the expert Figures MACD   https://www.mql5.com/ru/mar
TrendPlus
Sivakumar Subbaiya
4.21 (14)
Trend Plus   Trendplus  Indicator   Time Frame: Suitable for any time frame.  Purpose: Trend Prediction. Blue and red candle indicate the buy and sell call respectively. Buy: When the blue candle is formed buy call is initiated. close the buy trades when the next red candle will formed.   Sell: When the Red candle is formed Sell call is initiated. close the Sell trades when the next blue candle will formed.   Happy trade!!
FREE
The indicator detects and displays Shark harmonic pattern (see the screenshot). The pattern is plotted by the extreme values of the ZigZag indicator (included in the resources, no need to install). After detecting the pattern, the indicator notifies of that by a pop-up window, a mobile notification and an email. The indicator highlights the process of the pattern formation and not just the complete pattern. In the former case, it is displayed in the contour triangles. After the pattern is comple
Adjustable Fractal MT4
Dmitry Timin
4.63 (30)
Adjustable Fractal MT4 is a modification of Bill Williams' Fractals indicator. The fractal consists of a two sets of arrows - up (upper fractals) and down (lower fractals). Each fractal satisfies the following conditions: Upper fractal - maximum (high) of a signal bar exceeds or is equal to maximums of all bars from the range to the left and to the right; Lower fractal - minimum (low) of a signal bar is less or equal to minimums of all bars from the range to the left and to the right. Unlike a s
FREE
MTF Fractals
Krisztian Kenedi
5 (4)
Multi timeframe fractal indicator which shows the higher timeframe's fractal point on lower timeframes. Parameters Fractal_Timeframe : You can set the higher timeframes for fractals. Maxbar : You can set the maximum number of candles for the calculations. Up_Fractal_Color, Up_Fractal_Symbol, Down_Fractal_Color, Down_Fractal_Symbol : Color and style settings of the fractal points. Extend_Line : Draws a horizontal line from the previous fractal point until a candle closes it over or a user-speci
FREE
VR Cub
Vladimir Pastushak
VR Cub è un indicatore per ottenere punti di ingresso di alta qualità. L'indicatore è stato sviluppato per facilitare i calcoli matematici e semplificare la ricerca dei punti di ingresso in una posizione. La strategia di trading per la quale è stato scritto l'indicatore ha dimostrato la sua efficacia per molti anni. La semplicità della strategia di trading è il suo grande vantaggio, che consente anche ai trader alle prime armi di commerciare con successo con essa. VR Cub calcola i punti di apert
Custom Pattern Detector Indicator This indicator lets you define your own custom pattern instead of the typical candlestick patterns. Everybody already knows about common candlestick patterns like the Doji pattern. This indicator is different though. The pattern you will define is a custom pattern based on CANDLE FORMATIONS . Once the indicator knows the pattern you want it to look for, then it will go through history on the chart and find matching patterns, make them visible to you, and calcul
FREE
This indicator is a perfect tool able to compare which brokers have the lower latency. It shows us immediately which brokers are slower or faster. When you see the dot icon on the line, it means this broker is the faster one and the red line (Broker_A) is the slower one. See the example on the screenshot. How It Works? This indicator shares the prices information to and from the "shared" common data folder. It compares all the prices. The price is based on average by (Ask + Bid) / 2. There are
FREE
The indicator displays the data of the Stochastic oscillator from a higher timeframe on the chart. The main and signal lines are displayed in a separate window. The stepped response is not smoothed. The indicator is useful for practicing "manual" forex trading strategies, which use the data from several screens with different timeframes of a single symbol. The indicator uses the settings that are identical to the standard ones, and a drop-down list for selecting the timeframe. Indicator Parame
The indicator allows you to trade binary options. The recommended time frame is М1 and the expiration time is 1 minute. The indicator suitable for auto and manual trading. A possible signal is specified as a arrows above/under a candle. You should wait until the candle closes! Arrows are not re-painted Trade sessions: TOKYO section (Half end) and LONDON section (First half) Currency pairs: EUR/USD Working time frame: M1 Expiration time: 1 minute. The indicator also shows good results when using
FREE
The   OHLC indicator   shows the current and historical values of High, Low, Open, Close and Mid for a specific time period. It can plot the current values or the values from the previous session. The indicator's range can be calculated from a daily, weekly, monthly, or user-specified session. Levels High  of the current or previous session. Low  of the current or previous session. Open  of current or previous session. Close  of the current or previous session. Midpoint  of the current or pre
FREE
It works based on the Stochastic Indicator algorithm. Very useful for trading with high-low or OverSold/Overbought swing strategies. StochSignal will show a buy arrow if the two lines have crossed in the OverSold area and sell arrows if the two lines have crossed in the Overbought area. You can put the Stochastic Indicator on the chart with the same parameters as this StochSignal Indicator to understand more clearly how it works. This indicator is equipped with the following parameters: Inputs d
FREE
Forex Indicator "Support Resistance Levels" for MT4 Indicator " Support Resistance Levels" is very useful auxiliary indicator for trading 'Support' and 'Resistance' are important zones on chart respected by price Support level is where the price regularly stops falling and bounces back up Resistance level is where the price normally stops rising and dips back down I ndicator " Support Resistance Levels" shows the recent levels: Resistance  levels - red lines.  S upport  levels - blue lines
Infinity Trend Pro
Yaroslav Varankin
1 (1)
This is a trend indicator without redrawing Developed instead of the binary options strategy (by the color of the Martingale candlestick) Also works well in forex trading When to open trades (binary options) A signal will appear in the place with a candle signaling the current candle It is recommended to open a deal for one candle of the current timeframe M1 and M5 When a blue dot appears, open a deal up When a red dot appears, open a trade down. How to open trades on Forex. When a signal is rec
Gli utenti di questo prodotto hanno anche acquistato
Gann Made Easy
Oleg Rodin
4.88 (100)
Gann Made Easy è un sistema di trading Forex professionale e facile da usare che si basa sui migliori principi del trading utilizzando la teoria di mr. WD Gann. L'indicatore fornisce segnali ACQUISTA e VENDI accurati, inclusi i livelli di Stop Loss e Take Profit. Puoi fare trading anche in movimento utilizzando le notifiche PUSH. Vi prego di contattarmi dopo l'acquisto! Condividerò i miei consigli di trading con te e fantastici indicatori bonus gratuitamente! Probabilmente hai già sentito parlar
Trend Punch
Mohamed Hassan
4.92 (24)
This indicator is unstoppable when combined with our other indicator called  Support & Resistance . After purchase, send us a message and you will get it   for  FREE as a BONUS! Introducing Trend Punch , the revolutionary forex trend indicator that will transform the way you trade! Trend Punch is uniquely designed to provide precise buy and sell arrows during strong market trends, making your trading decisions clearer and more confident. Whether you're trading major currency pairs or exotic sym
Gold Stuff
Vasiliy Strukov
4.9 (270)
Gold Stuff è un indicatore di tendenza progettato specificamente per l'oro e può essere utilizzato anche su qualsiasi strumento finanziario. L'indicatore non ridisegna e non è in ritardo. Periodo consigliato H1. Su di esso l'indicatore funziona in modo completamente automatico Expert Advisor EA Gold Stuff. Lo trovi nel mio profilo. I risultati in tempo reale possono essere visualizzati qui.  Puoi ottenere una copia gratuita del nostro indicatore Strong Support e Trend Scanner, per favore scri
FX Power MT4 NG
Daniel Stein
5 (13)
Ricevi il tuo aggiornamento quotidiano sul mercato con dettagli e schermate tramite il nostro Morning Briefing qui su mql5 e su Telegram ! FX Power MT4 NG è la nuova generazione del nostro popolare misuratore di forza delle valute, FX Power. Cosa offre questo misuratore di forza di nuova generazione? Tutto ciò che avete amato dell'FX Power originale IN PIÙ Analisi della forza di ORO/XAU Risultati di calcolo ancora più precisi Periodi di analisi configurabili individualmente Limite di calcolo pe
SI PREGA DI LEGGERE LE INFORMAZIONI QUI SOTTO PRIMA DI ACQUISTARE IL PRODOTTO! Apollo Pips PLUS SP è un prodotto unico! È PER CHI VUOLE OTTENERE IL MIO NUOVO INDICATORE "APOLLO PIPS" PIÙ IL BONUS "SUPER PACK" CON ACCESSO A TUTTI I MIEI INDICATORI DI TRADING! Acquistando il prodotto Apollo Pips PLUS SP stai effettivamente acquistando una versione assolutamente nuova del mio indicatore Apollo Pips. Questa versione dell'indicatore ha un algoritmo migliorato e un parametro facile da usare che ti dà
TPSproTREND PrO
Roman Podpora
4.79 (19)
TPSpro TREND PRO   è un indicatore di tendenza che analizza automaticamente il mercato, fornisce informazioni sulla tendenza e sui rispettivi cambiamenti e fornisce segnali per entrare nelle operazioni senza ridisegnare. L'indicatore utilizza ciascuna candela e la analizza separatamente. Si riferisce a vari shock al rialzo o al ribasso. Punto di ingresso preciso per il trading di valute, criptovalute, metalli, azioni e indici! Versione MT5                   Descrizione completa dell'indicatore
Trend Pulse
Mohamed Hassan
5 (5)
Please contact me after purchase to immediately get your PDF strategy + documentation for Trend Pulse !  Official release price of $89  (2 /50 copies left). Next price is $199 . Introducing Trend Pulse , a unique and robust indicator capable of detecting bullish, bearish, and even ranging trends! Trend Pulse uses a special algorithm to filter out market noise with real precision. If the current symbol is moving sideways, Trend Pulse will send you a ranging signal, letting you know that it'
Scalper Inside PRO
Alexey Minkov
4.75 (60)
An exclusive indicator that utilizes an innovative algorithm to swiftly and accurately determine the market trend. The indicator automatically calculates opening, closing, and profit levels, providing detailed trading statistics. With these features, you can choose the most appropriate trading instrument for the current market conditions. Additionally, you can easily integrate your own arrow indicators into Scalper Inside Pro to quickly evaluate their statistics and profitability. Scalper Inside
Atomic Analyst
Issam Kassas
5 (3)
Innanzitutto, vale la pena sottolineare che questo indicatore di trading non è repaint, non è ridisegno e non presenta ritardi, il che lo rende ideale sia per il trading manuale che per quello automatico. Manuale utente: impostazioni, input e strategia. L'Analista Atomico è un indicatore di azione del prezzo PA che utilizza la forza e il momentum del prezzo per trovare un miglior vantaggio sul mercato. Dotato di filtri avanzati che aiutano a rimuovere rumori e segnali falsi, e aumentare il pote
Trend Screener
STE S.S.COMPANY
4.82 (92)
Indicatore di tendenza, soluzione unica rivoluzionaria per il trading di tendenze e il filtraggio con tutte le importanti funzionalità di tendenza integrate in un unico strumento! È un indicatore multi-timeframe e multi-valuta al 100% non ridipingibile che può essere utilizzato su tutti i simboli/strumenti: forex, materie prime, criptovalute, indici e azioni. Trend Screener è un indicatore di tendenza che segue un indicatore efficiente che fornisce segnali di tendenza a freccia con punti nel gra
Currency Strength Wizard è un indicatore molto potente che ti fornisce una soluzione all-in-one per un trading di successo. L'indicatore calcola la potenza di questa o quella coppia forex utilizzando i dati di tutte le valute su più intervalli di tempo. Questi dati sono rappresentati in una forma di indice di valuta facile da usare e linee elettriche di valuta che puoi utilizzare per vedere il potere di questa o quella valuta. Tutto ciò di cui hai bisogno è collegare l'indicatore al grafico che
- Real price is 80$ - 40% Discount ( It is 49$ now ) Contact me for instruction, any questions! Introduction The breakout and retest strategy is traded support and resistance levels. it involves price breaking through a previous level.  The break and retest strategy is designed to help traders do two main things, the first is to avoid false breakouts. Many false breakouts start with a candlestick that breaks out of a level but ends with an immediate candlestick that brings the price back into t
Attualmente 20% di sconto! La soluzione migliore per ogni principiante o trader esperto! Questo software per cruscotti funziona su 28 coppie di valute. Si basa su 2 dei nostri indicatori principali (Advanced Currency Strength 28 e Advanced Currency Impulse). Offre un'ottima panoramica dell'intero mercato Forex. Mostra i valori di forza delle valute avanzate, la velocità di movimento delle valute e i segnali per 28 coppie Forex in tutti i (9) timeframe. Immaginate come migliorerà il vostro t
Clear Breakout
Martin Alejandro Bamonte
5 (1)
L'indicatore "Breakout Buy-Sell" è progettato per identificare e evidenziare potenziali opportunità di acquisto e vendita basate su breakout di prezzo durante diverse sessioni di mercato (Tokyo, Londra e New York). Questo indicatore aiuta i trader a visualizzare chiaramente le zone di acquisto e vendita, nonché i livelli di take-profit (TP) e stop-loss (SL). Strategia di utilizzo L'indicatore può essere utilizzato come segue: Impostazione iniziale : Seleziona la sessione di mercato e regola il G
ATTUALMENTE SCONTATO DEL 26% La soluzione migliore per ogni principiante o trader esperto! Questo indicatore è uno strumento di trading unico, di alta qualità e conveniente perché abbiamo incorporato una serie di caratteristiche proprietarie e una nuova formula. Con un solo grafico è possibile leggere la forza delle valute per 28 coppie Forex! Immaginate come migliorerà il vostro trading perché sarete in grado di individuare l'esatto punto di innesco di una nuova tendenza o di un'opportunit
PRO Renko System
Oleg Rodin
5 (26)
PRO Renko System è un sistema di trading altamente accurato appositamente progettato per il trading di grafici RENKO. Questo è un sistema universale che può essere applicato a vari strumenti di trading. Il sistema neutralizza efficacemente il cosiddetto rumore di mercato che consente di accedere a segnali di inversione accurati. L'indicatore è molto facile da usare e ha un solo parametro responsabile della generazione del segnale. Puoi facilmente adattare lo strumento a qualsiasi strumento
Gold Channel is a volatility-based indicator, developed with a specific timing algorithm for the XAUUSD pair, which consists of finding possible corrections in the market. This indicator shows two outer lines, an inner line (retracement line) and an arrow sign, where the theory of the channel is to help identify overbought and oversold conditions in the market. The market price will generally fall between the boundaries of the channel. If prices touch or move outside the channel it is a tra
Innanzitutto, vale la pena sottolineare che questo Strumento di Trading è un Indicatore Non-Ridipingente, Non-Ridisegnante e Non-Laggante, il che lo rende ideale per il trading professionale. Corso online, manuale utente e demo. L'Indicatore Smart Price Action Concepts è uno strumento molto potente sia per i nuovi che per i trader esperti. Racchiude più di 20 utili indicatori in uno solo, combinando idee di trading avanzate come l'Analisi del Trader del Circolo Interno e le Strategie di Trading
Advanced Currency IMPULSE with ALERT
Bernhard Schweigert
4.91 (495)
ATTUALMENTE SCONTATO DEL 31%! La soluzione migliore per ogni principiante o trader esperto! Questo indicatore è uno strumento di trading unico, di alta qualità e conveniente perché abbiamo incorporato una serie di caratteristiche proprietarie e una formula segreta. Con un solo grafico fornisce avvisi per tutte le 28 coppie di valute. Immaginate come migliorerà il vostro trading perché sarete in grado di individuare l'esatto punto di innesco di una nuova tendenza o opportunità di scalping!
NAM Order Blocks
NAM TECH GROUP, CORP.
5 (1)
MT4 Multi-timeframe Order Blocks detection indicator. Features - Fully customizable on chart control panel, provides complete interaction. - Hide and show control panel wherever you want. - Detect OBs on multiple timeframes. - Select OBs quantity to display. - Different OBs user interface. - Different filters on OBs. - OB proximity alert. - ADR High and Low lines. - Notification service (Screen alerts | Push notifications). Summary Order block is a market behavior that indicates order collection
RelicusRoad Pro
Relicus LLC
4.73 (141)
Ora $ 147 (aumentando a $ 499 dopo alcuni aggiornamenti) - account illimitati (PC o MAC) Manuale utente di RelicusRoad + Video di formazione + Accesso al gruppo Discord privato + Stato VIP UN NUOVO MODO DI GUARDARE IL MERCATO RelicusRoad è l'indicatore di trading più potente al mondo per forex, futures, criptovalute, azioni e indici, fornendo ai trader tutte le informazioni e gli strumenti di cui hanno bisogno per rimanere redditizi. Forniamo analisi tecniche e piani di trading per aiuta
PZ Trend Trading
PZ TRADING SLU
4.8 (5)
Capture every opportunity: your go-to indicator for profitable trend trading Special Offer: Purchase now to receive free bonuses worth $159! (Read more for details) Trend Trading is an indicator designed to profit as much as possible from trends taking place in the market, by timing pullbacks and breakouts. It finds trading opportunities by analyzing what the price is doing during established trends. [ Installation Guide | Update Guide | Troubleshooting | FAQ | All Products ] Trade financial
TPSpro RFI Levels
Roman Podpora
4.83 (24)
Inverti il primo livello di impulso (RFI)       istruire       Russia       -        ESP   Raccomandazione di utilizzare   l'indicatore -   TPSpro   Trend Edizione Professional -Versione   MT5 La cosa più importante nel comercio son è la cosa più importante in futuro. La cosa più importante è la cosa più importante. Funzioni principali: La maggior parte delle zone sono attivate da venditori e compradores! Indicador mostra tutti i livelli/zone dei primi impulsi corretti per acquisti e vendite. LO
Break and Retest
Mohamed Hassan
4.17 (18)
This Indicator only places quality trades when the market is really in your favor with a clear break and retest. Patience is key with this price action strategy! If you want more alert signals per day, you increase the number next to the parameter called: Support & Resistance Sensitivity.  After many months of hard work and dedication, we are extremely proud to present you our  Break and Retest price action indicator created from scratch. One of the most complex indicators that we made with ove
Order Block Hunter
Noha Mohamed Fathy Younes Badr
5 (2)
Order block hunter indicator is the best indicator for  hunt the order blocks that area where there has been a large concentration of limit orders waiting to be executed Order blocks are identified on a chart by observing previous price action and looking for areas where the price experienced significant movement or sudden changes in direction .This indicator does that for you by using very complicated codes and helps you to take the best areas To buy and sell because it make marks at the best a
Scalper Vault
Oleg Rodin
5 (29)
Scalper Vault è un sistema di scalping professionale che ti fornisce tutto il necessario per scalping di successo. Questo indicatore è un sistema di trading completo che può essere utilizzato dai trader di forex e opzioni binarie. L'intervallo di tempo consigliato è M5. Il sistema fornisce segnali di freccia accurati nella direzione della tendenza. Ti fornisce anche i segnali più alti e più bassi e i livelli di mercato di Gann. Gli indicatori forniscono tutti i tipi di avvisi, comprese le notifi
IX Power MT4
Daniel Stein
5 (6)
IX Power porta finalmente l'imbattibile precisione di FX Power ai simboli non-Forex. Determina con precisione l'intensità delle tendenze a breve, medio e lungo termine dei vostri indici preferiti, azioni, materie prime, ETF e persino criptovalute. Potete analizzare tutto ciò che il vostro terminale ha da offrire. Provatelo e sperimentate come il vostro tempismo migliori significativamente durante il trading. Caratteristiche principali di IX Power Risultati di calcolo precisi al 100% e n
Disegna automaticamente i livelli di supporto e resistenza PIÙ i gap delle candele di propulsione sul vostro grafico, in modo da poter vedere dove il prezzo potrebbe dirigersi successivamente e/o potenzialmente invertire. Questo indicatore è stato progettato per essere utilizzato come parte della metodologia di trading di posizione insegnata sul mio sito web (The Market Structure Trader) e visualizza informazioni chiave per il targeting e le potenziali entrate. L'indicatore presenta 2 funzi
M1 Arrow
Oleg Rodin
4.73 (15)
Una strategia intraday basata su due principi fondamentali del mercato. L'algoritmo si basa sull'analisi dei volumi e delle onde di prezzo utilizzando filtri aggiuntivi. L'algoritmo intelligente dell'indicatore fornisce un segnale solo quando due fattori di mercato si combinano in uno solo. L'indicatore calcola le onde di un certo intervallo sul grafico M1 utilizzando i dati dell'intervallo di tempo più alto. E per confermare l'onda, l'indicatore utilizza l'analisi per volume. Questo indicatore
Market Reversal Alerts
LEE SAMSON
4.21 (121)
Il profitto dalla struttura del mercato cambia quando il prezzo si inverte e si ritira. L'indicatore di avviso di inversione della struttura del mercato identifica quando una tendenza o un movimento di prezzo si sta avvicinando all'esaurimento e pronto a invertire. Ti avvisa dei cambiamenti nella struttura del mercato che in genere si verificano quando stanno per verificarsi un'inversione o un forte pullback. L'indicatore identifica inizialmente i breakout e lo slancio del prezzo, ogni volta
Filtro:
Nessuna recensione
Rispondi alla recensione