Gold Key Levels
- Indicatori
- Pieter Gerhardus Van Zyl
- Versione: 1.2
- Aggiornato: 11 giugno 2024
- Attivazioni: 10
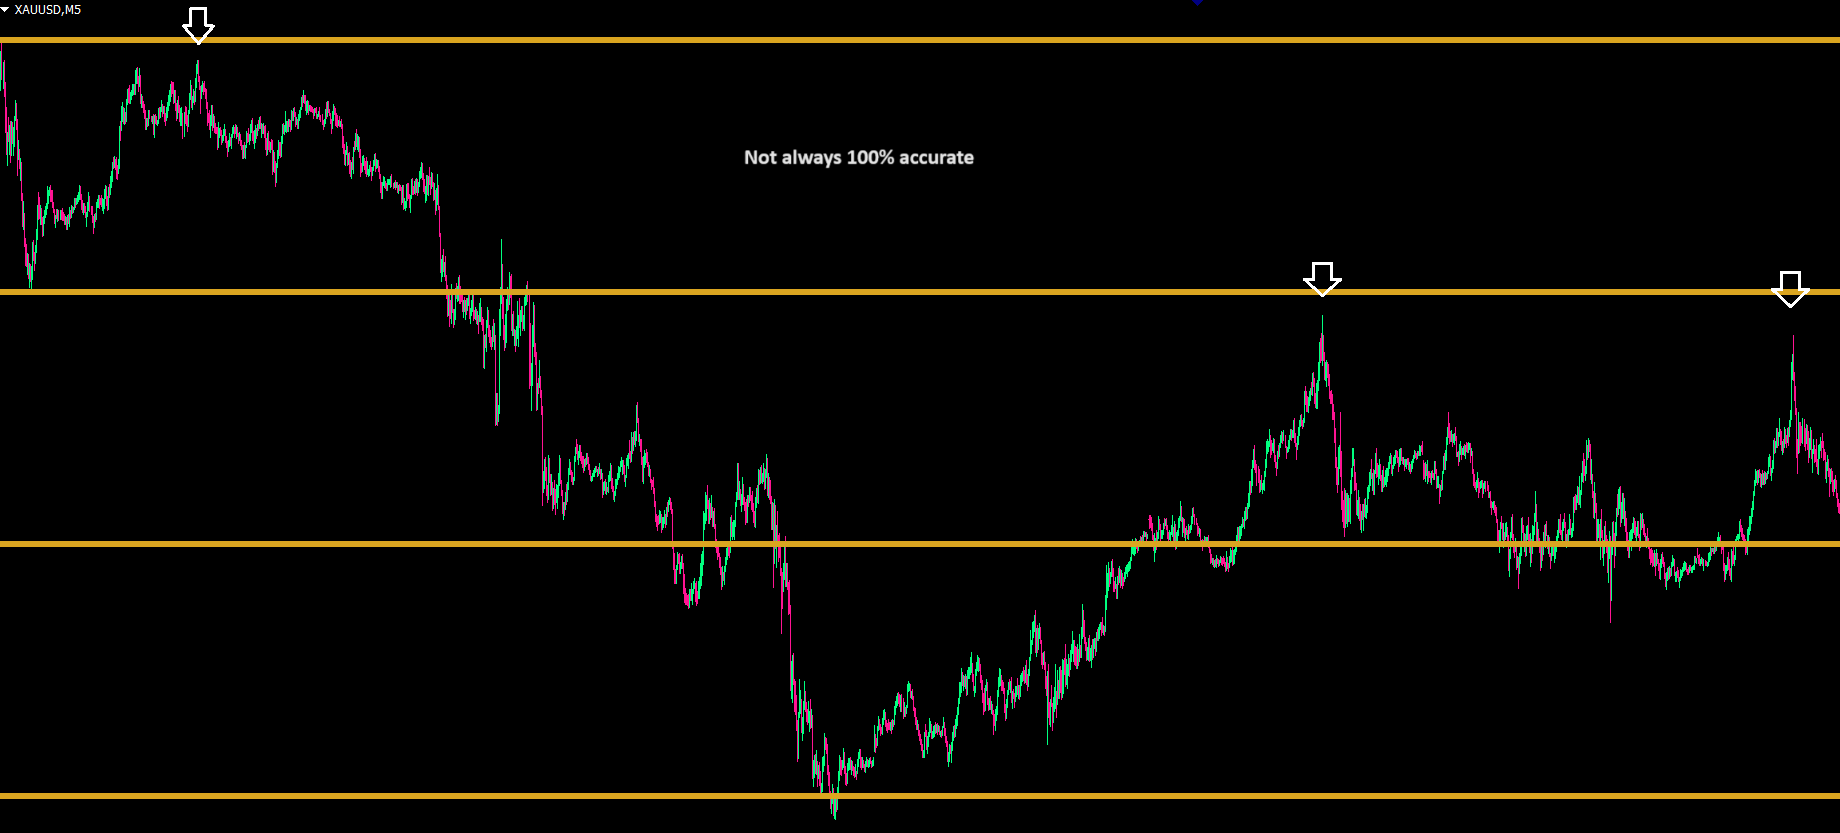
The indicator reveals key levels for gold.
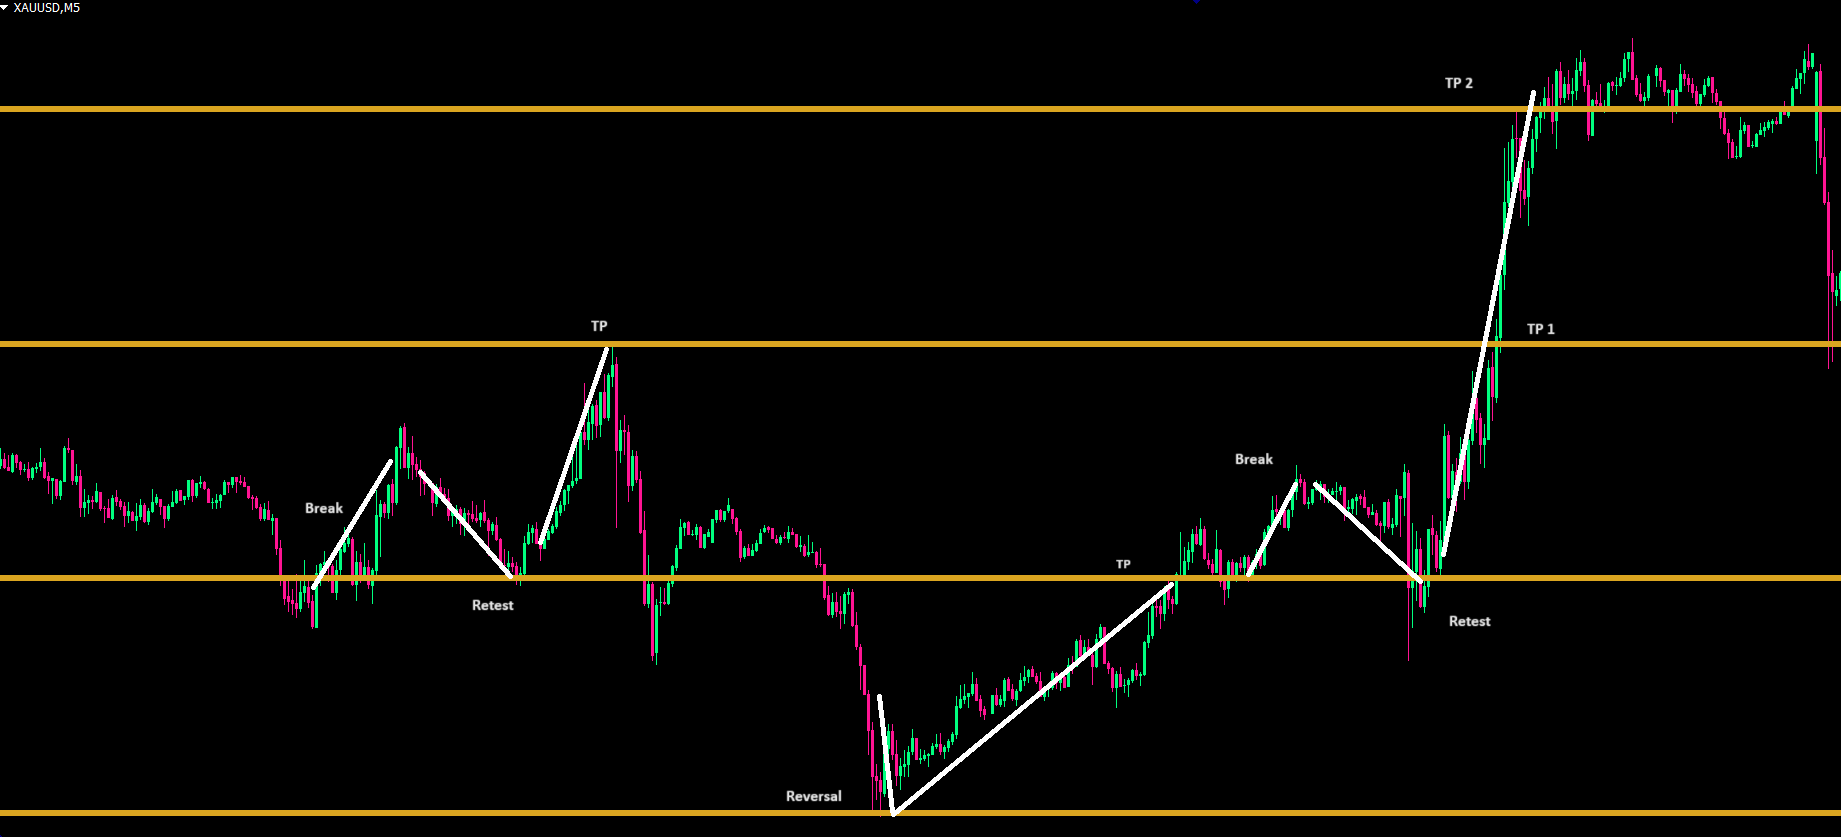
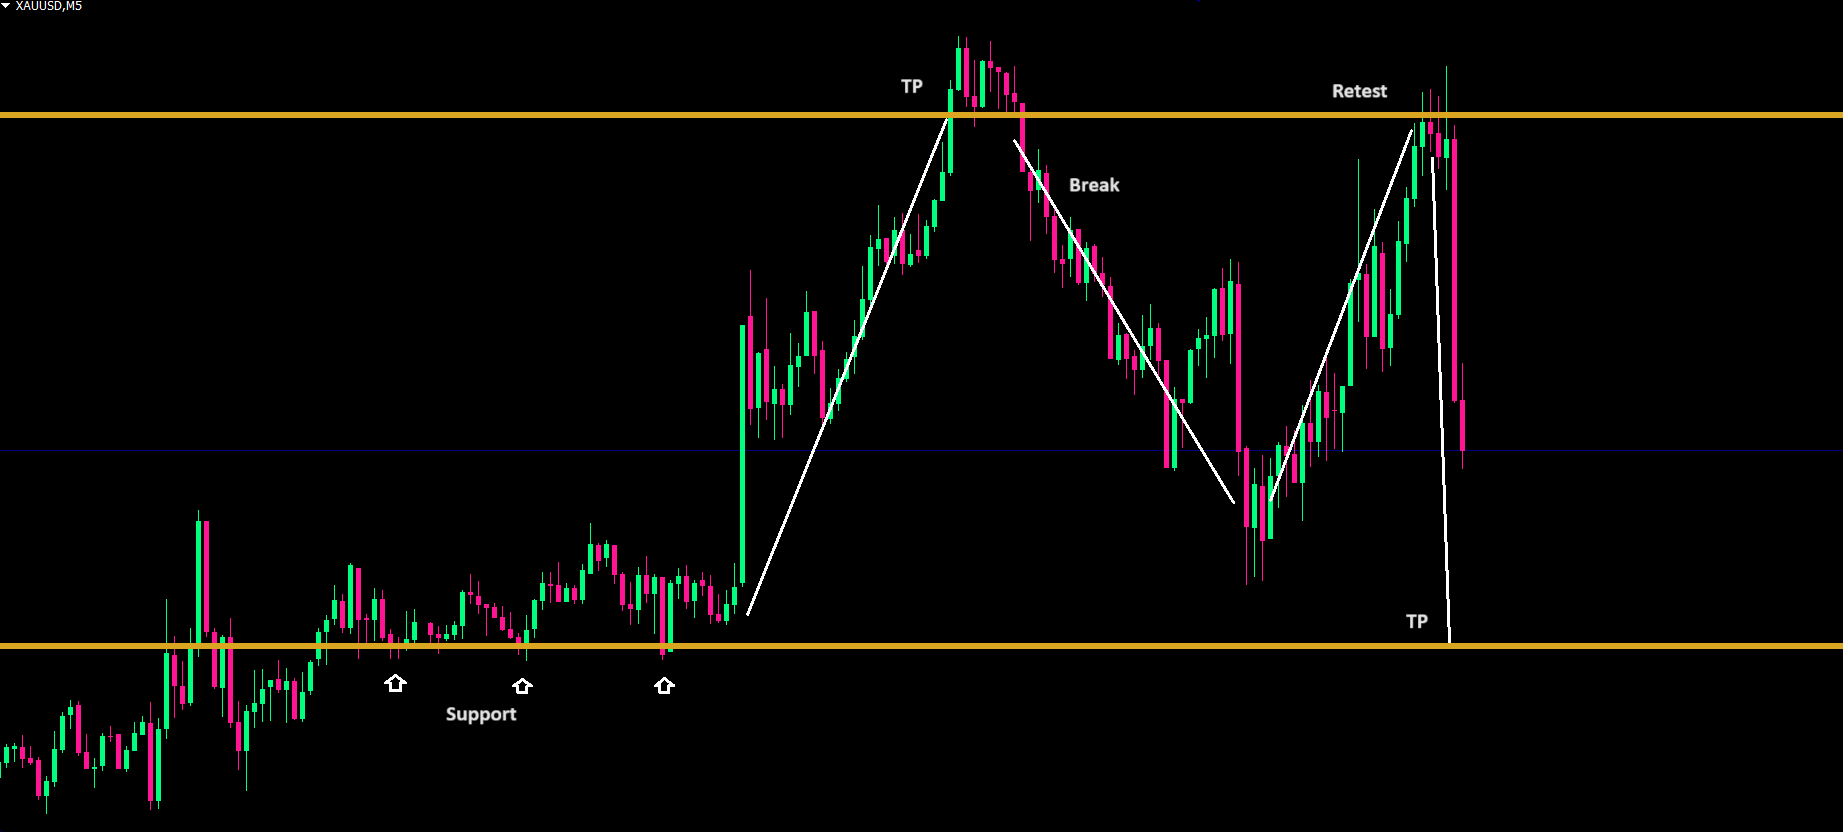
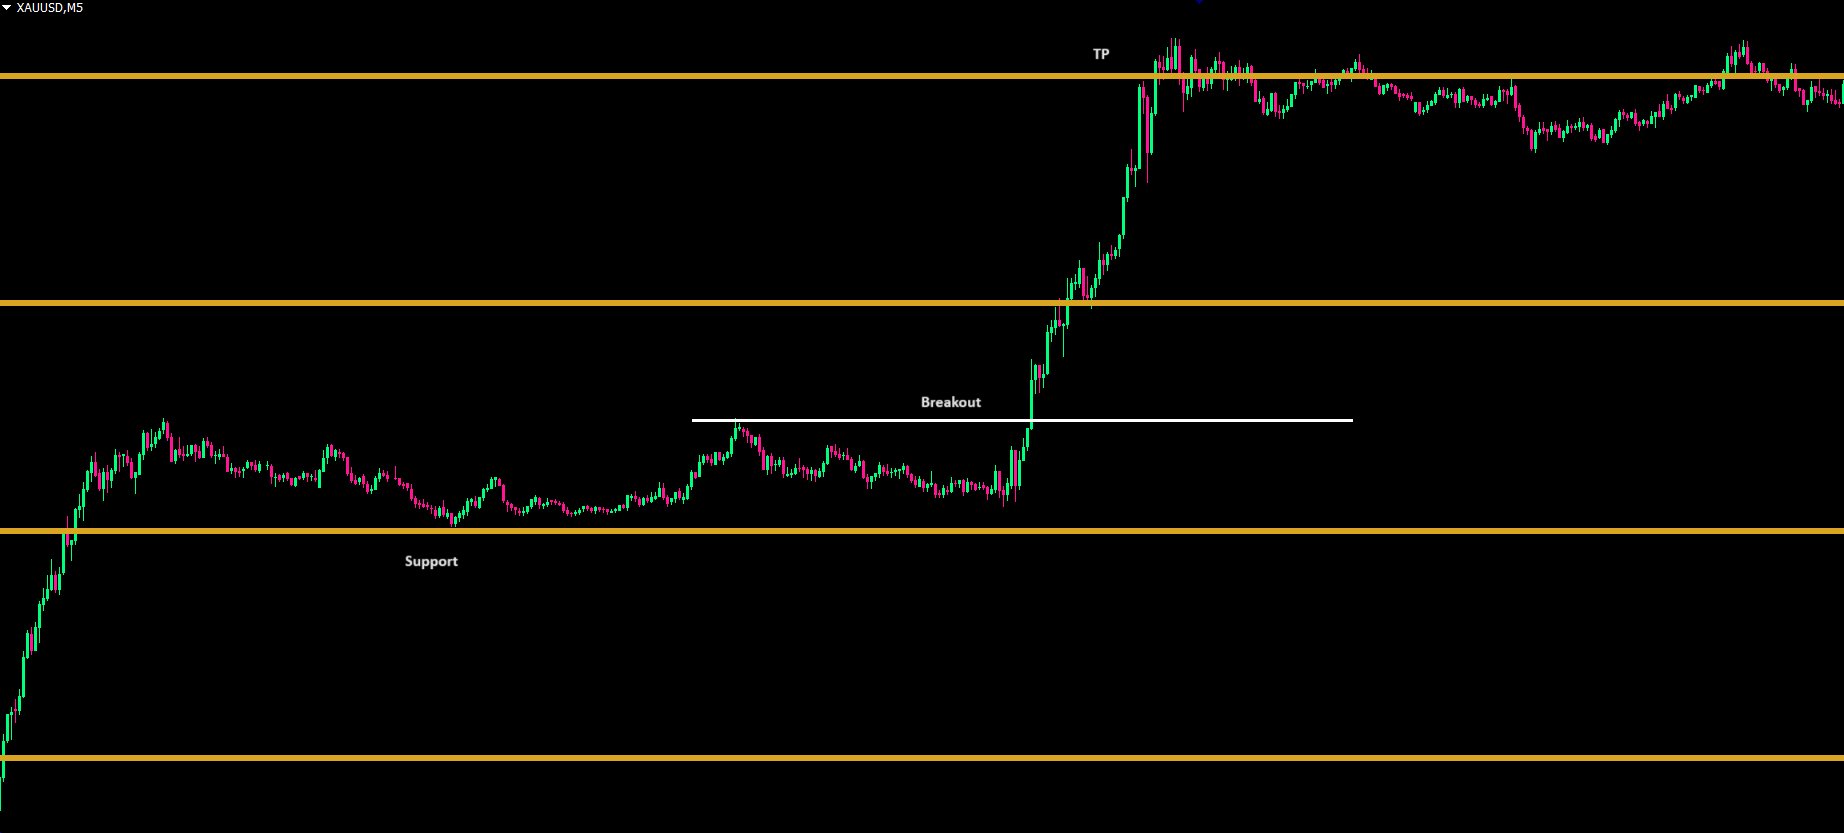
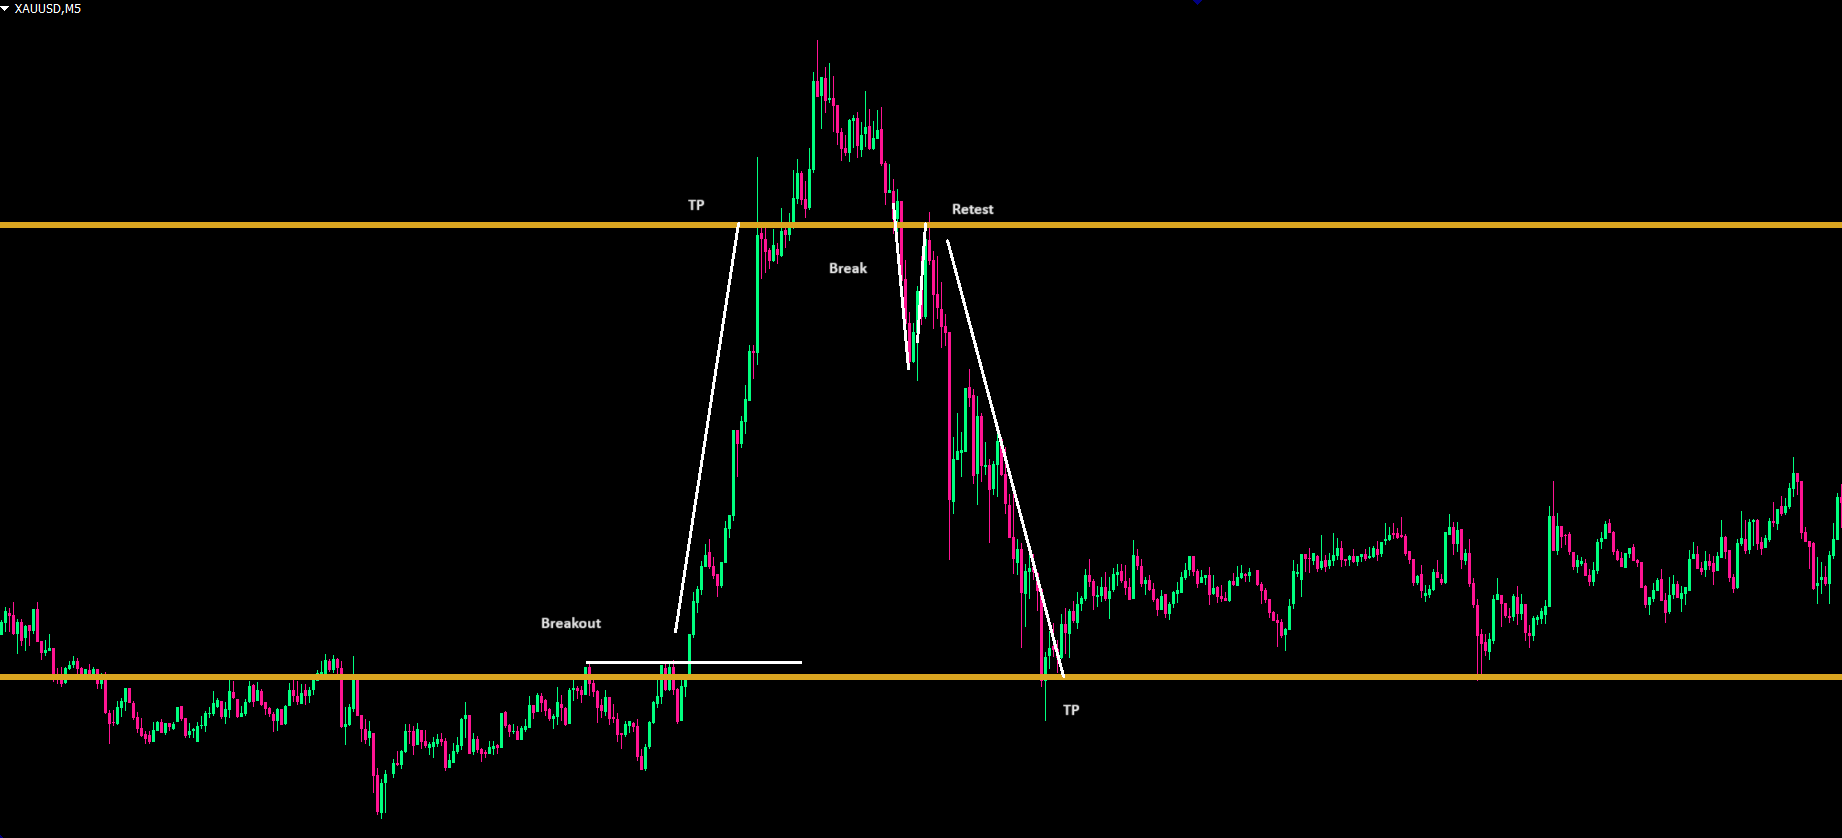
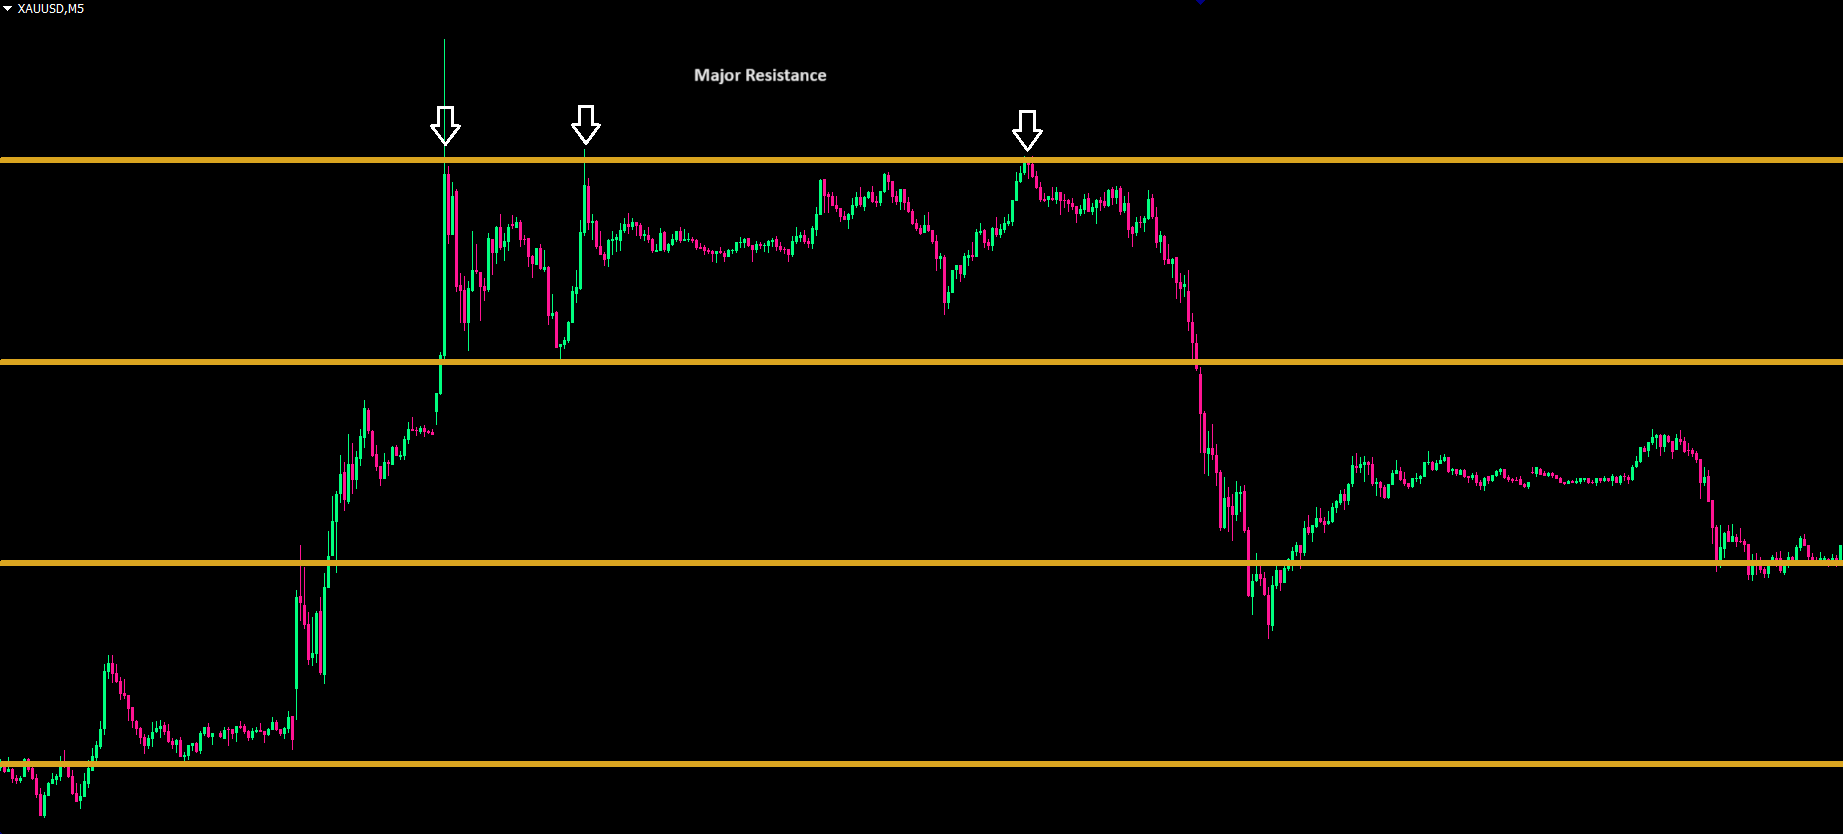
The levels can be used for support and resistance, breakout, break and retest or most strategies.
The major levels can be used for intraday trades from one level to the next or reversals.
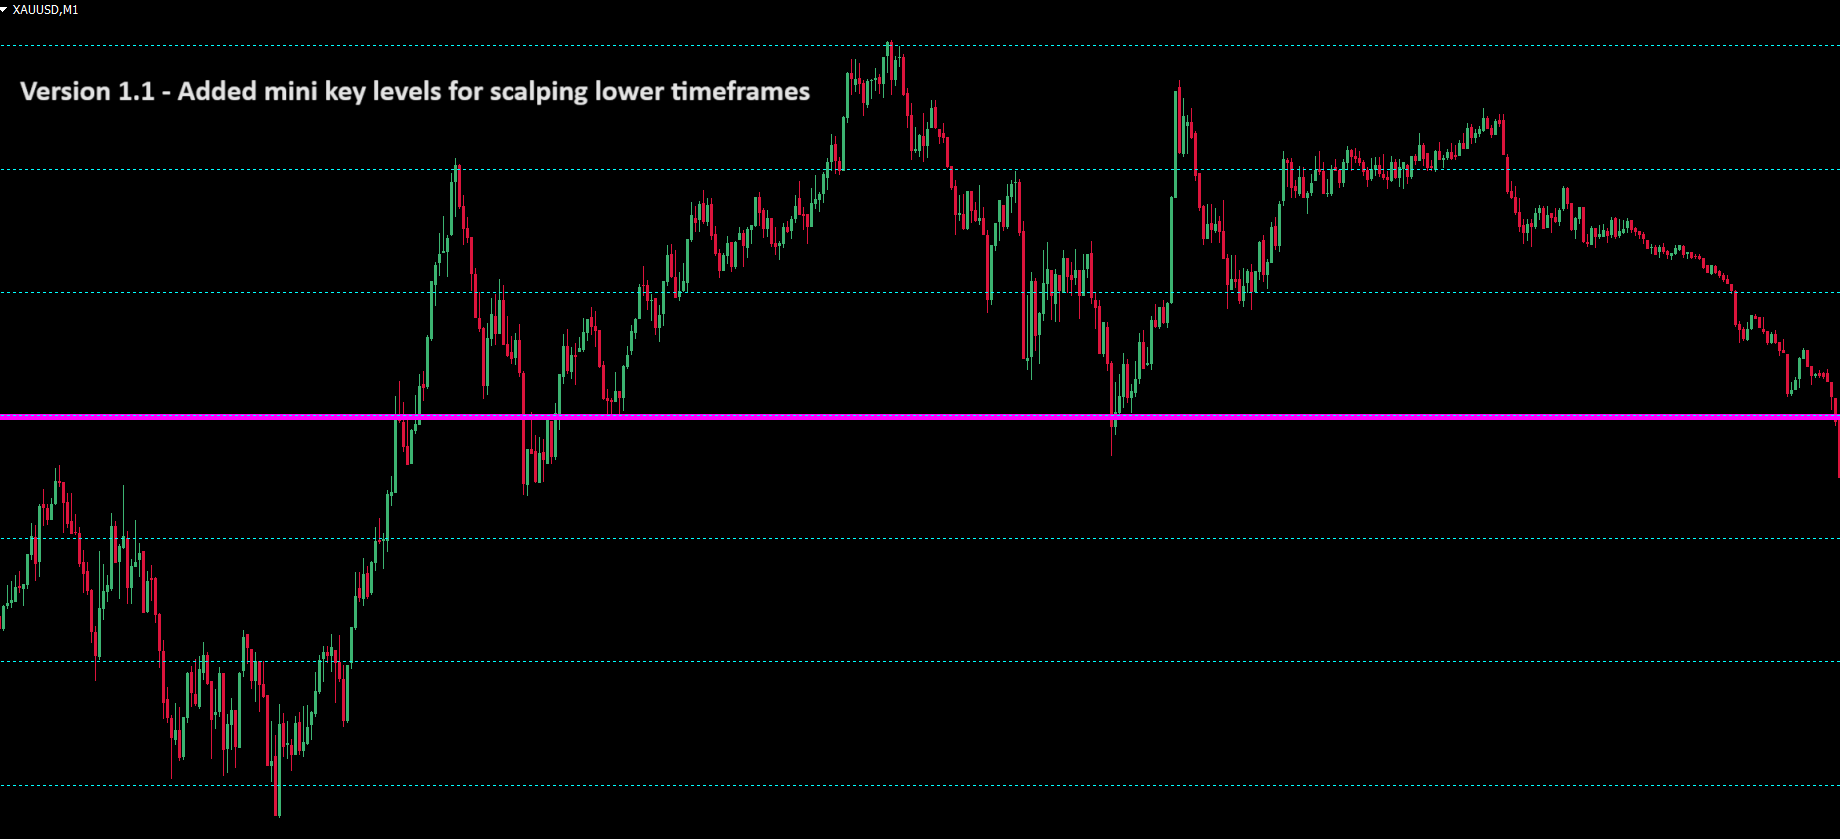
The mini levels can be used to scalp lower timeframes.
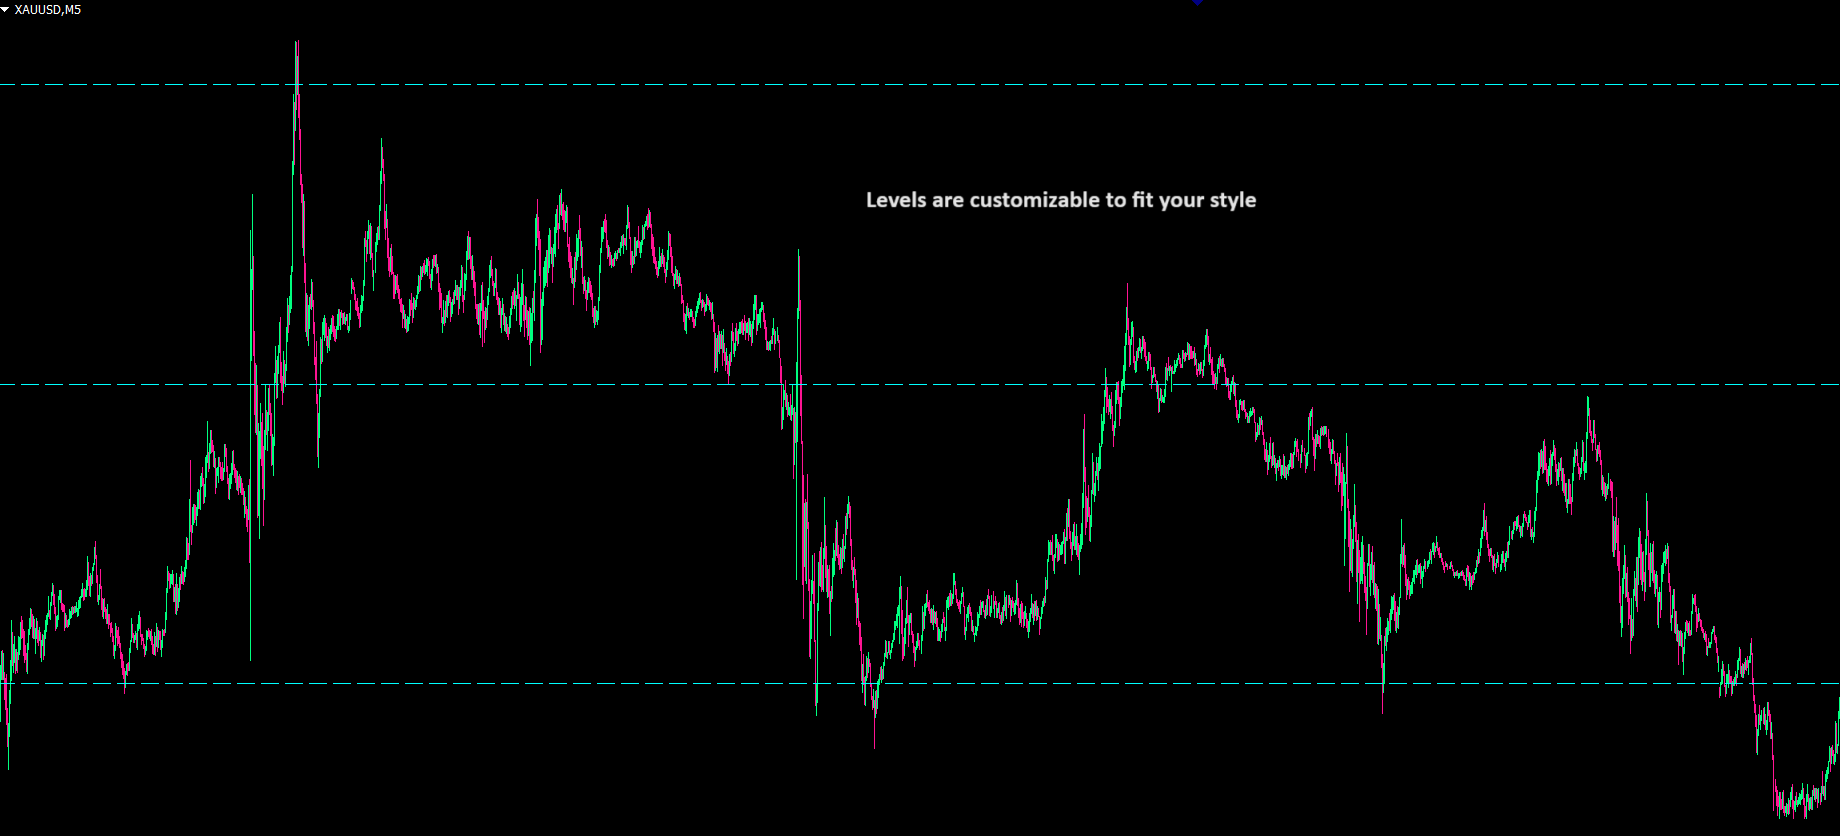
The color, line style and thickness can be adjusted as preferred.
Symbol: XAUUSD
Timeframe: Major levels - M30 - H4
Mini Levels M15 - M1
The levels may enhance your current setup.
Enjoy!
------------------------------------------