Order Block Trend
- Indicatori
- Hassane Zibara
- Versione: 1.0
- Attivazioni: 5
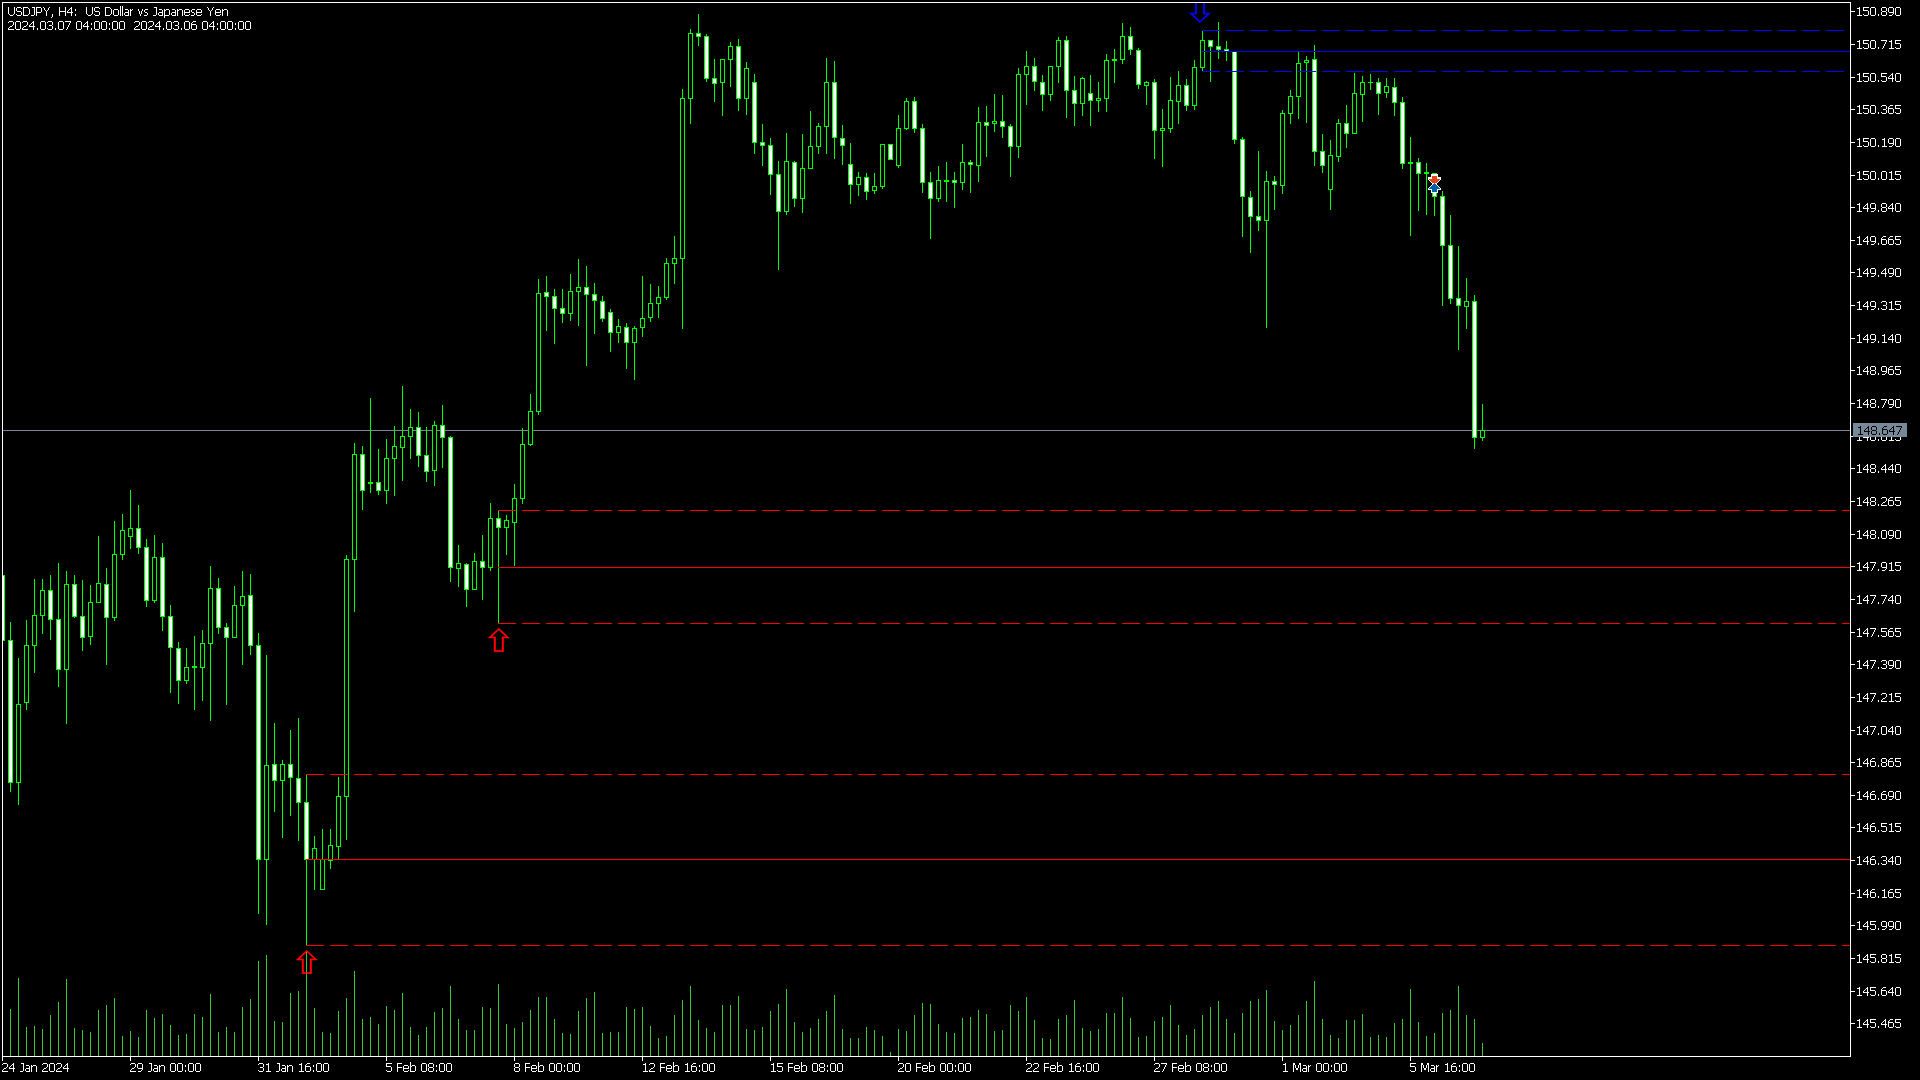
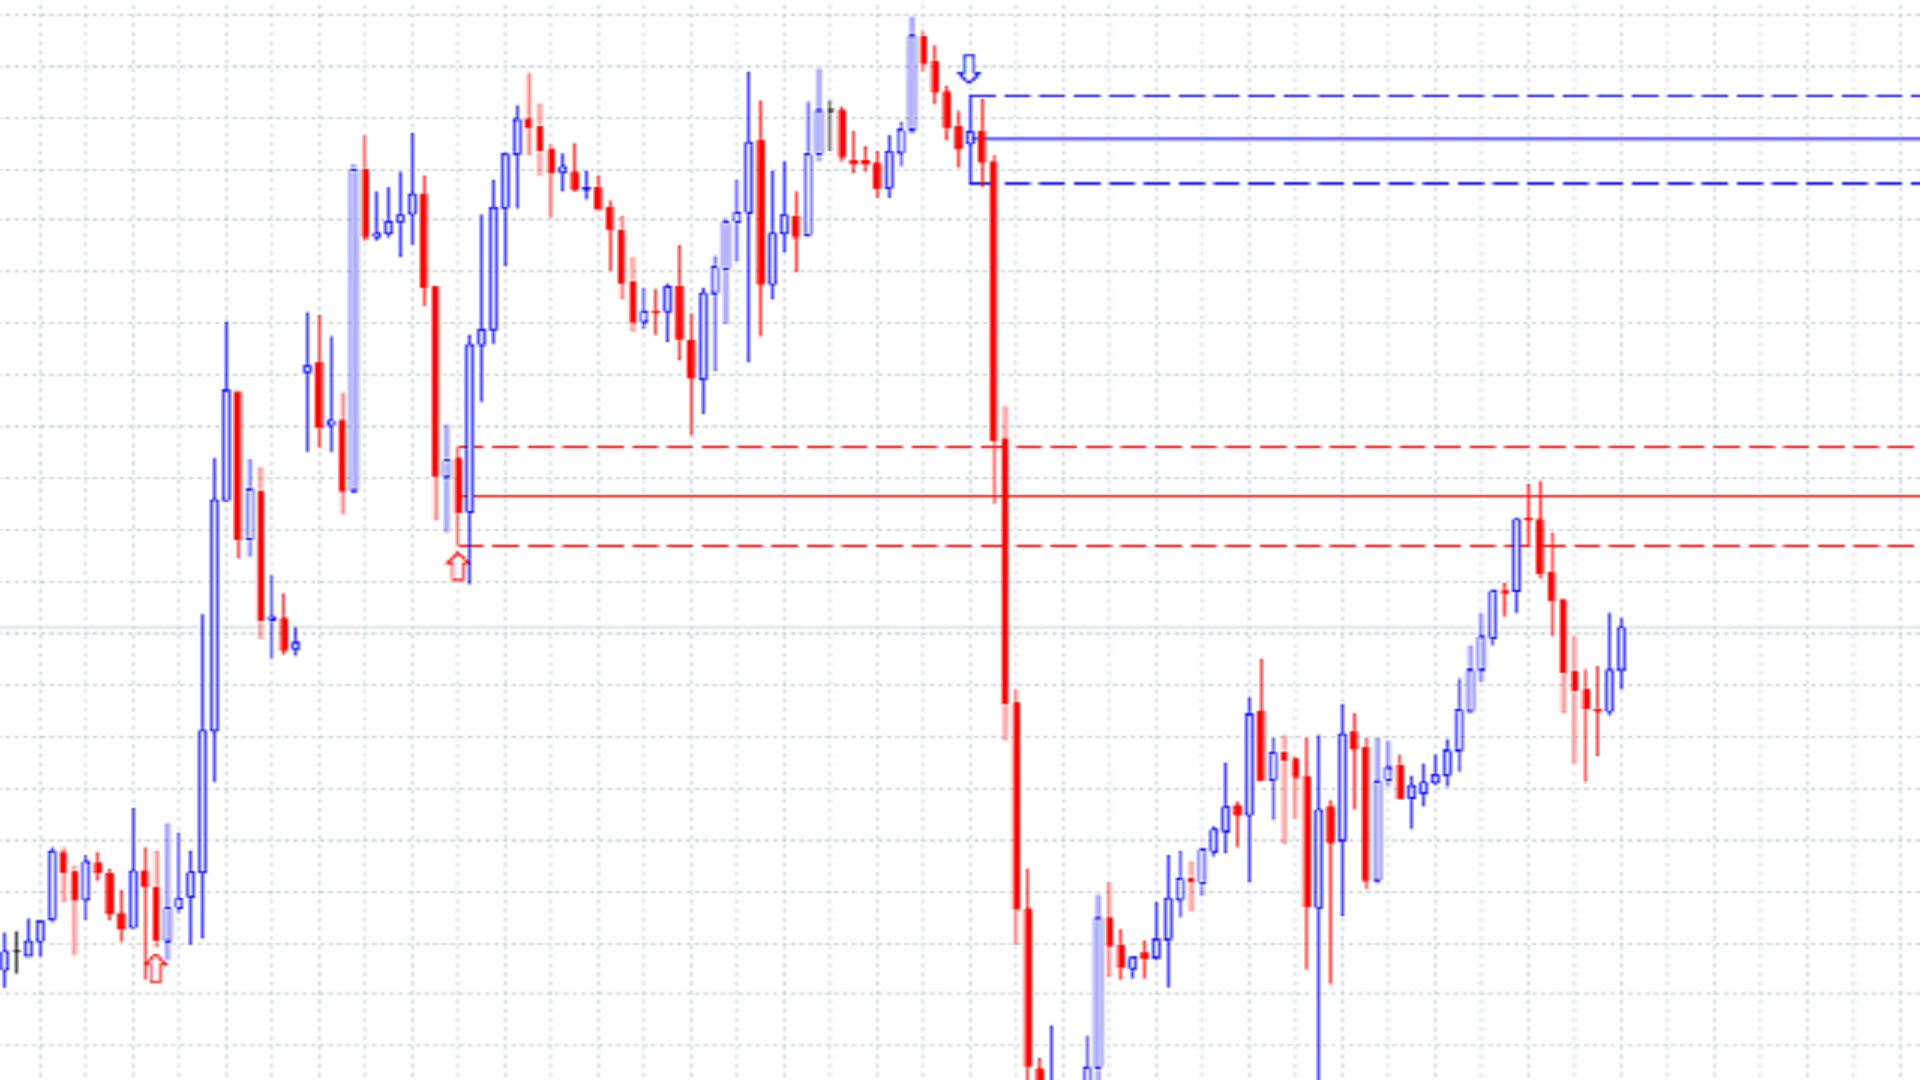
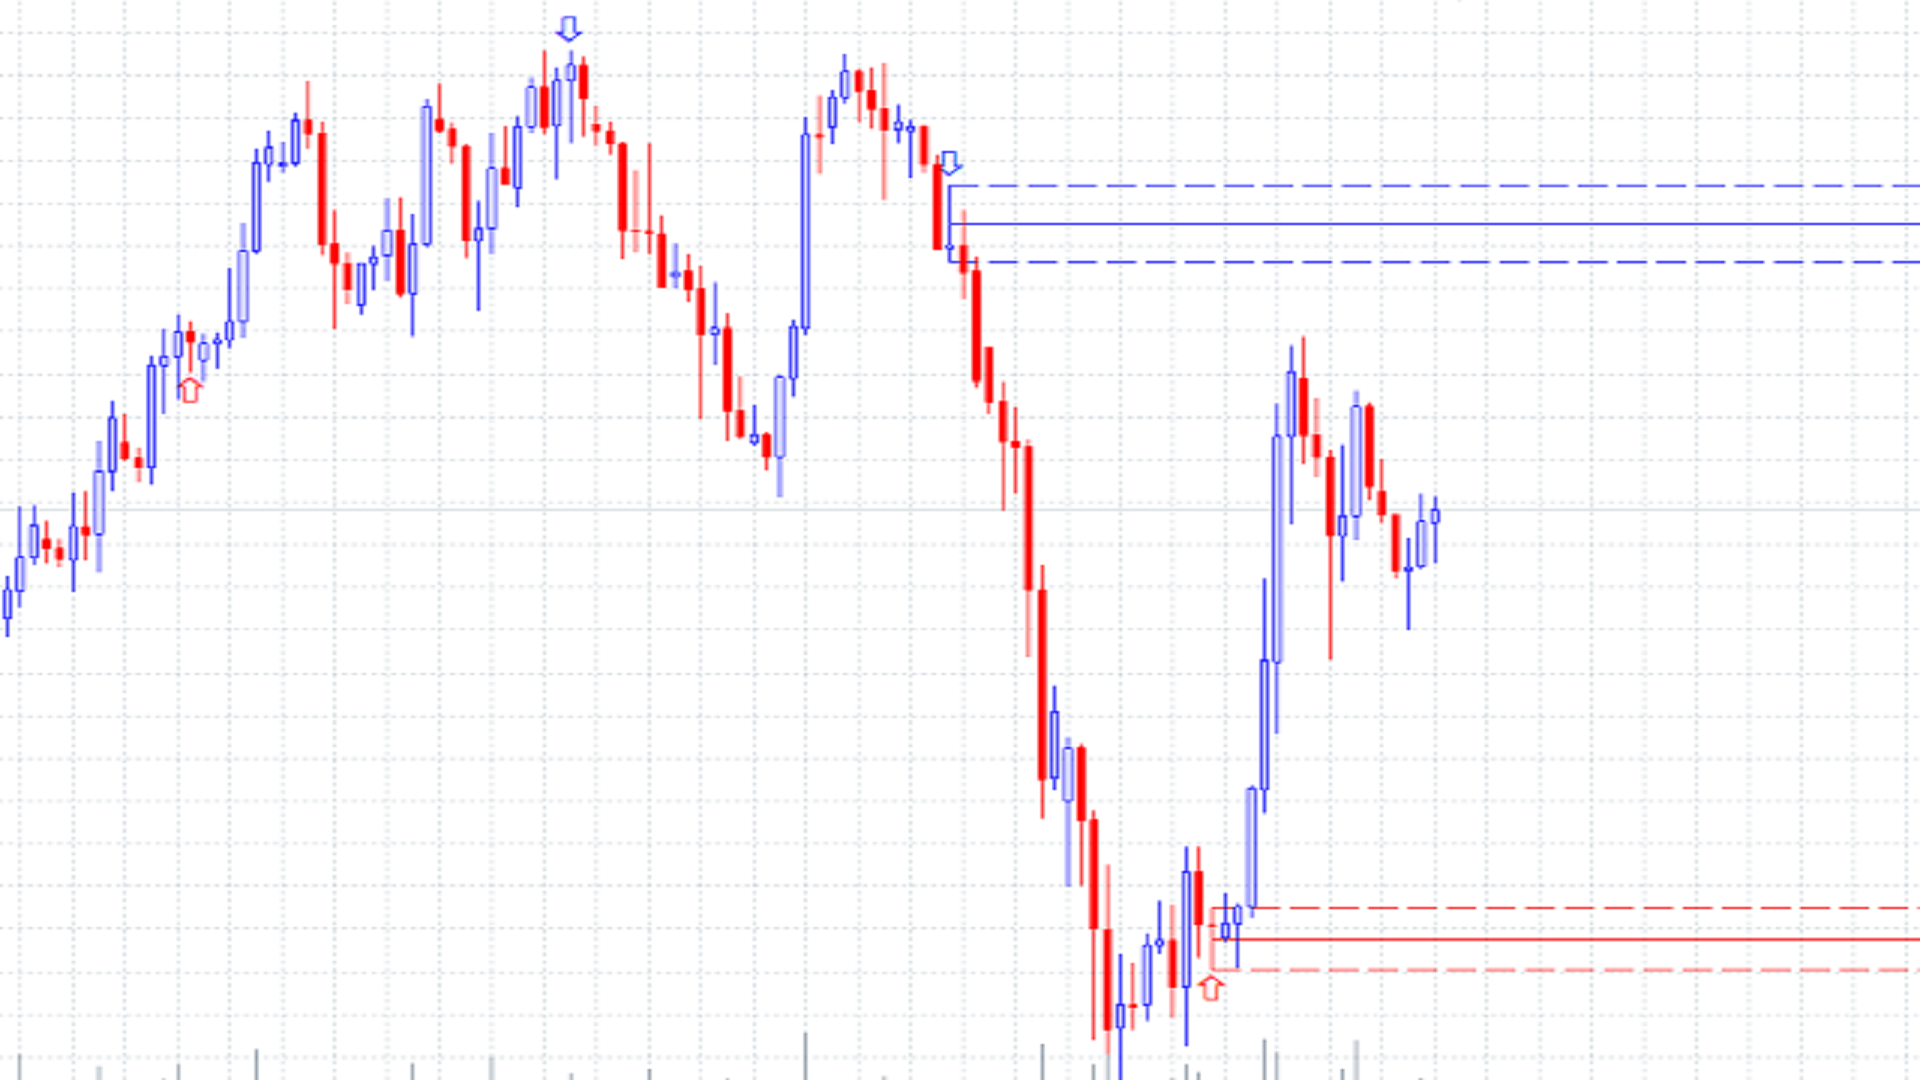
Order Blocks are supply or demand zones in which big traders can find the comfort of placing large buy and sell orders and completing a big, very big transaction.
Order blocks are a unique trading strategy that helps traders find a direction in the market. Usually, it allows traders to find out what financial institutions are planning to do in a particular market and better indicate the next price movement.