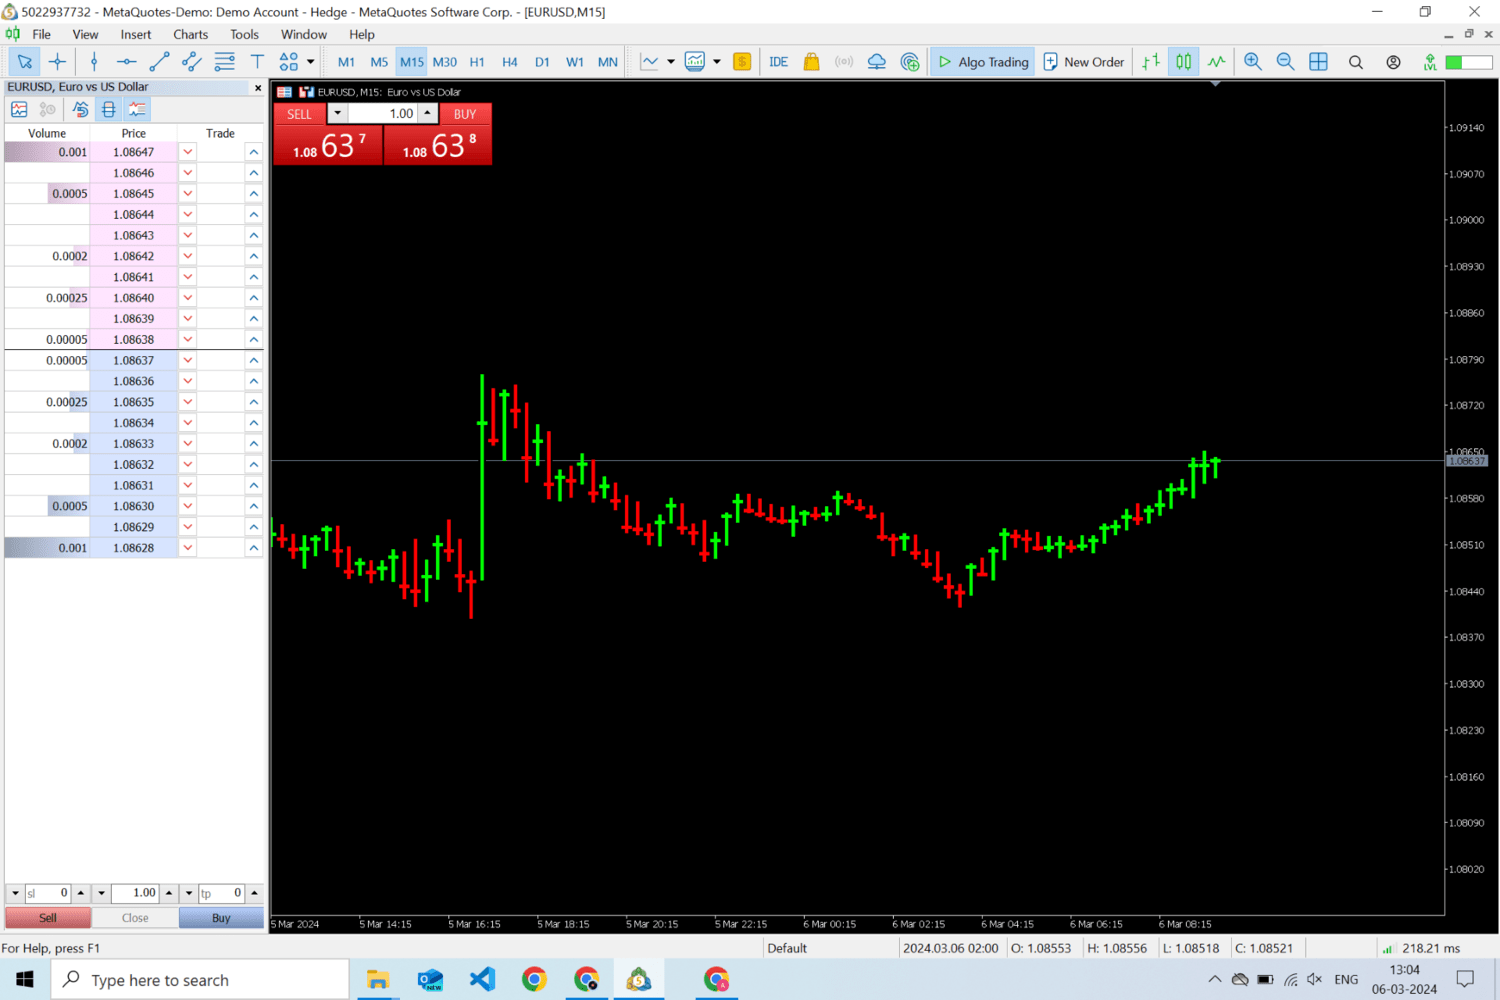
High Low Close chart with thick wicks
- Indicatori
- Amin Alisher Shaikh
- Versione: 1.0
- Attivazioni: 5
Nota: devi nascondere il tipo di grafico esistente, puoi farlo cambiando i colori del grafico, se non sai come farlo, guarda questo video - https://youtu.be/-4H6Z5Z4fKo
o contattami a priceaction9@outlook.com
Questo è un tipo di grafico che verrà mostrato al posto del tuo grafico e mostra solo il massimo, il minimo e la chiusura e ha stoppini spessi. Ti aiuta a comprendere meglio ogni candela riducendo il rumore introdotto dai prezzi aperti su ciascuna candela.
Ad esempio, sulla scala da 1 a 10, se la candela si apre a 5 e chiude a 8, e fa un minimo di 1, allora forma un corpo di 3 punti e avrà stoppini per il resto dei punti, e quindi a volte è difficile da realizzare. senso di esso.
In questo grafico, se si verifica lo stesso scenario, il punto di chiusura verrà mostrato a 8 e guardandolo avrai un'idea immediata che è salito da 1 a 8 in direzione positiva e da 10 a 8 in direzione negativa e quindi sai che è una candela rialzista.
Se avete domande fatemelo sapere qui priceaction9@outlook.com