Pivot Point Daily Shifted Mt4 Original
- Indicatori
- Navjot Singh
- Versione: 1.0
- Attivazioni: 5
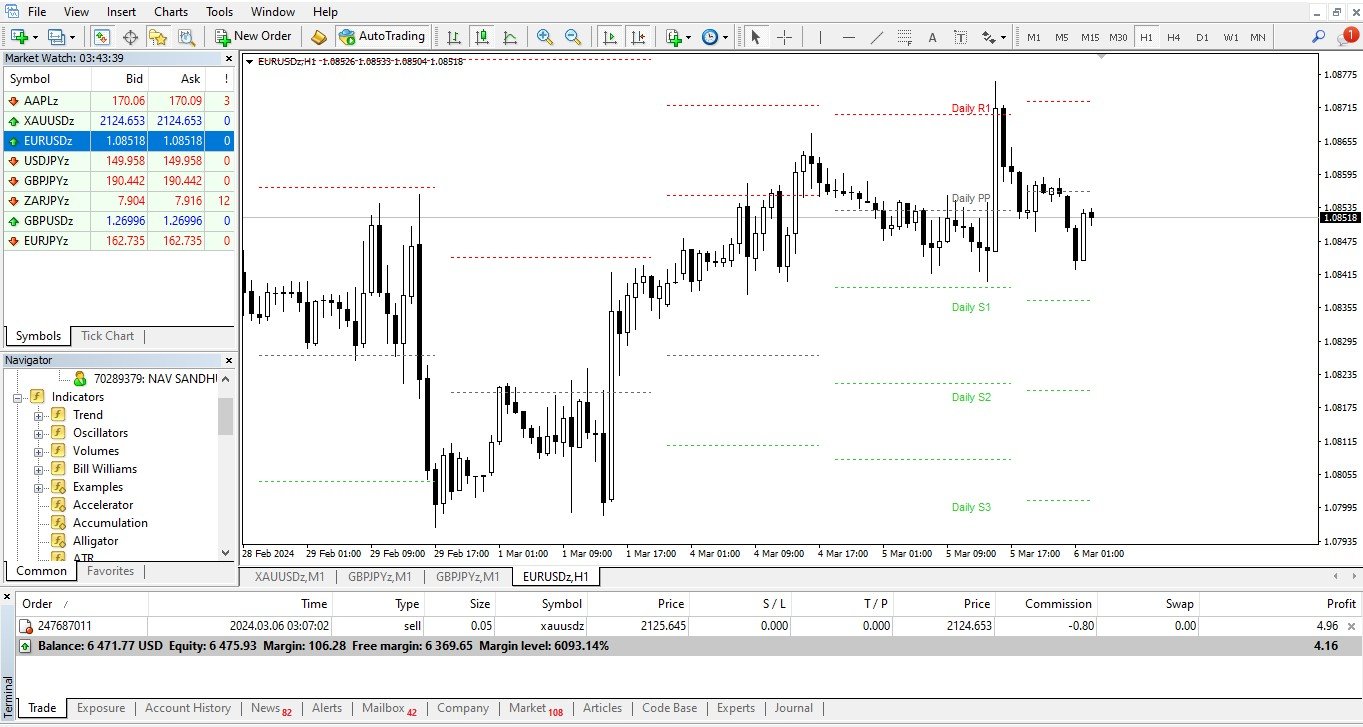
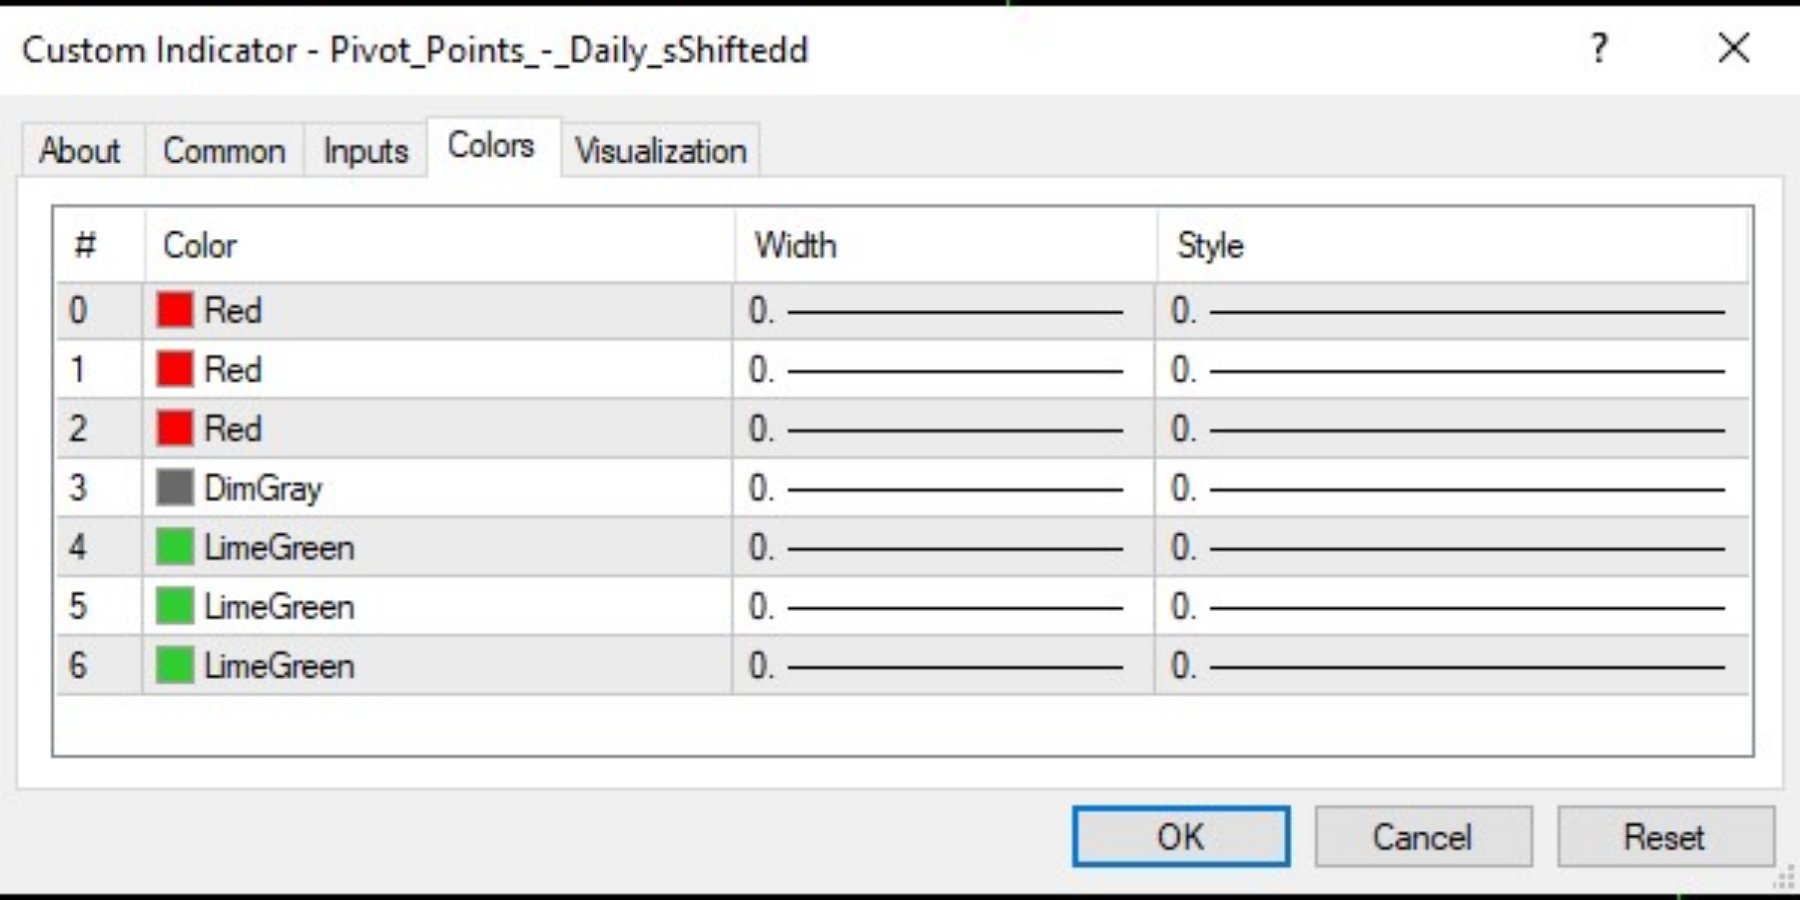
L'indicatore mostra i punti pivot giornalieri. È possibile specificare il numero di giorni da visualizzare. Per il forex non considera i dati della sessione domenicale. È possibile modificare il colore, lo stile e la larghezza per ogni livello. È meglio utilizzare questo indicatore con un intervallo di tempo non superiore a Н1. 4 Livelli di supporto e resistenza con anche Livelli Intermedi che è possibile nascondere.
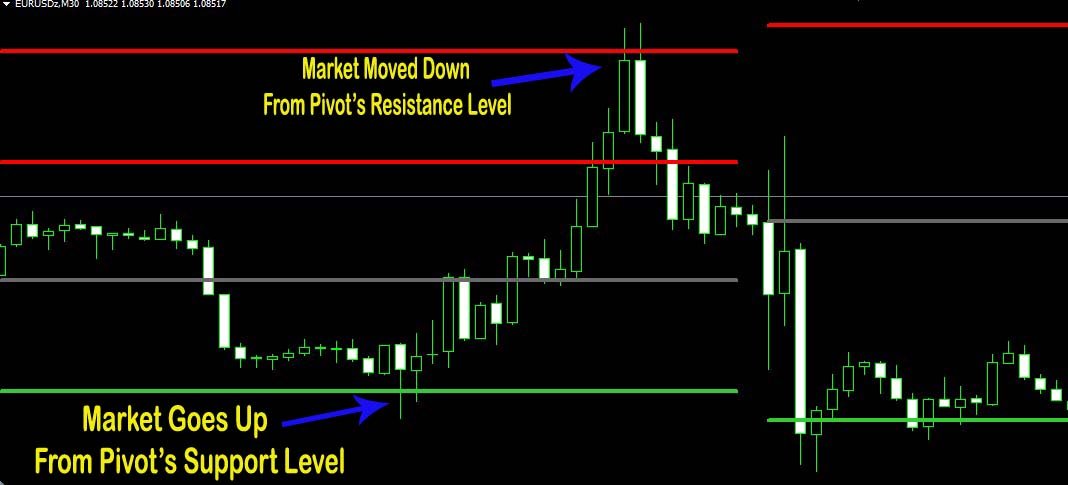
Trading sui pivot:
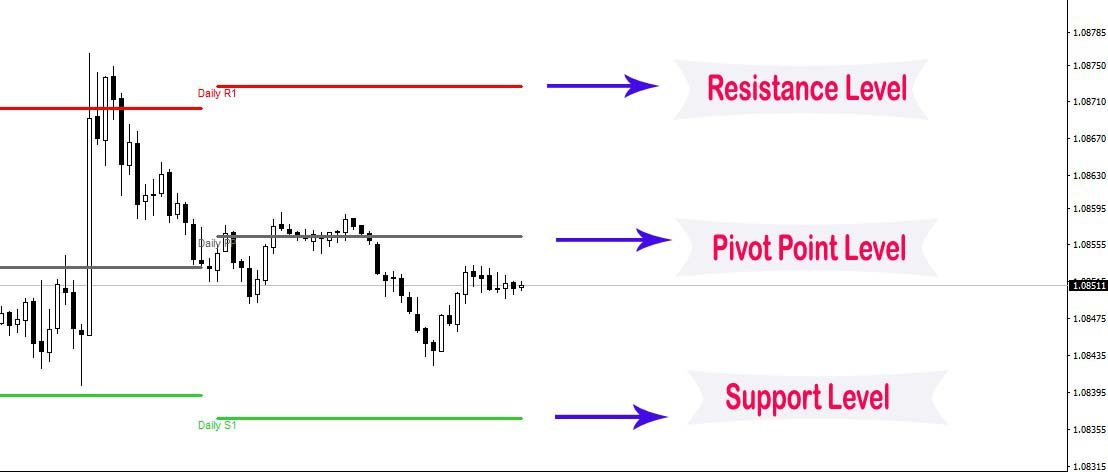
Perno 1.pp
2. r1 r2 r3, s1 s2 s3
I punti pivot sono stati per molto tempo una strategia di trading, originariamente utilizzata dai trader di sala. Utilizzando questo metodo, puoi capire dove sta andando il mercato in un giorno attraverso alcuni semplici calcoli.
Il punto pivot nel metodo del punto pivot è il punto di svolta della direzione del mercato durante il giorno. È possibile ottenere una serie di punti semplicemente calcolando il prezzo massimo, minimo e di chiusura del giorno precedente. Questi punti possono formare linee di supporto e resistenza chiave. Il punto pivot, i livelli di supporto e di resistenza sono collettivamente indicati come livello pivot.
Il mercato che vedi ha un prezzo di apertura, un prezzo alto, un prezzo basso e un prezzo di chiusura ogni giorno (alcuni mercati aprono 24 ore su 24, come il mercato dei cambi, che di solito utilizza le 17:00 EST come orario di apertura e chiusura). Queste informazioni contengono tutti i dati utilizzati con il metodo pivot.
Il metodo del punto pivot è così popolare perché può essere previsto, non ritardato. Puoi utilizzare i dati del giorno precedente per calcolare il possibile punto di svolta nel tuo giorno di negoziazione (giorno di negoziazione corrente)
Poiché ci sono molti trader che operano secondo il metodo pivot, scoprirai che il mercato è reattivo in queste posizioni chiave. Questo ti dà un'opportunità di trading.