MACD Color Histogram
- Indicatori
- German David Nino Cifuentes
- Versione: 2.0
- Aggiornato: 31 maggio 2024
- Attivazioni: 5
L'Indicatore MACD Histogram è una versione migliorata dell'indicatore MACD tradizionale, offrendo una visione superiore delle tendenze del mercato e dei cambiamenti di momentum. A differenza del MACD predefinito in MT5, questa versione include un istogramma, rendendo più facile visualizzare e interpretare le condizioni del mercato.
Vantaggi rispetto all'indicatore MACD predefinito:
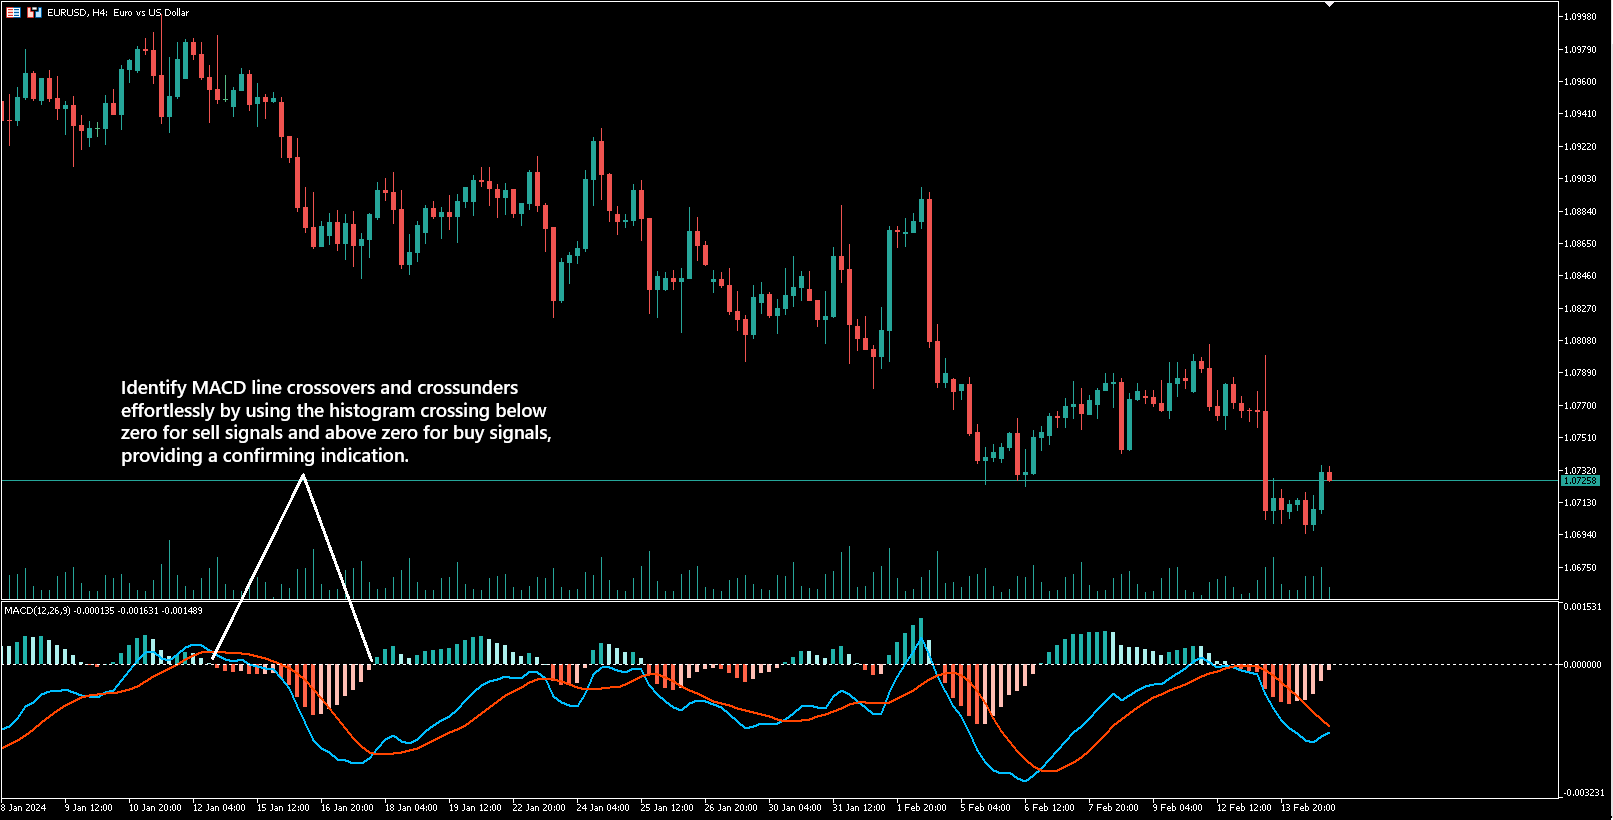
- Visuali Migliorati: L'istogramma fornisce una rappresentazione a barre della differenza tra la linea MACD e la linea di segnale, facilitando l'identificazione delle tendenze rialziste e ribassiste.
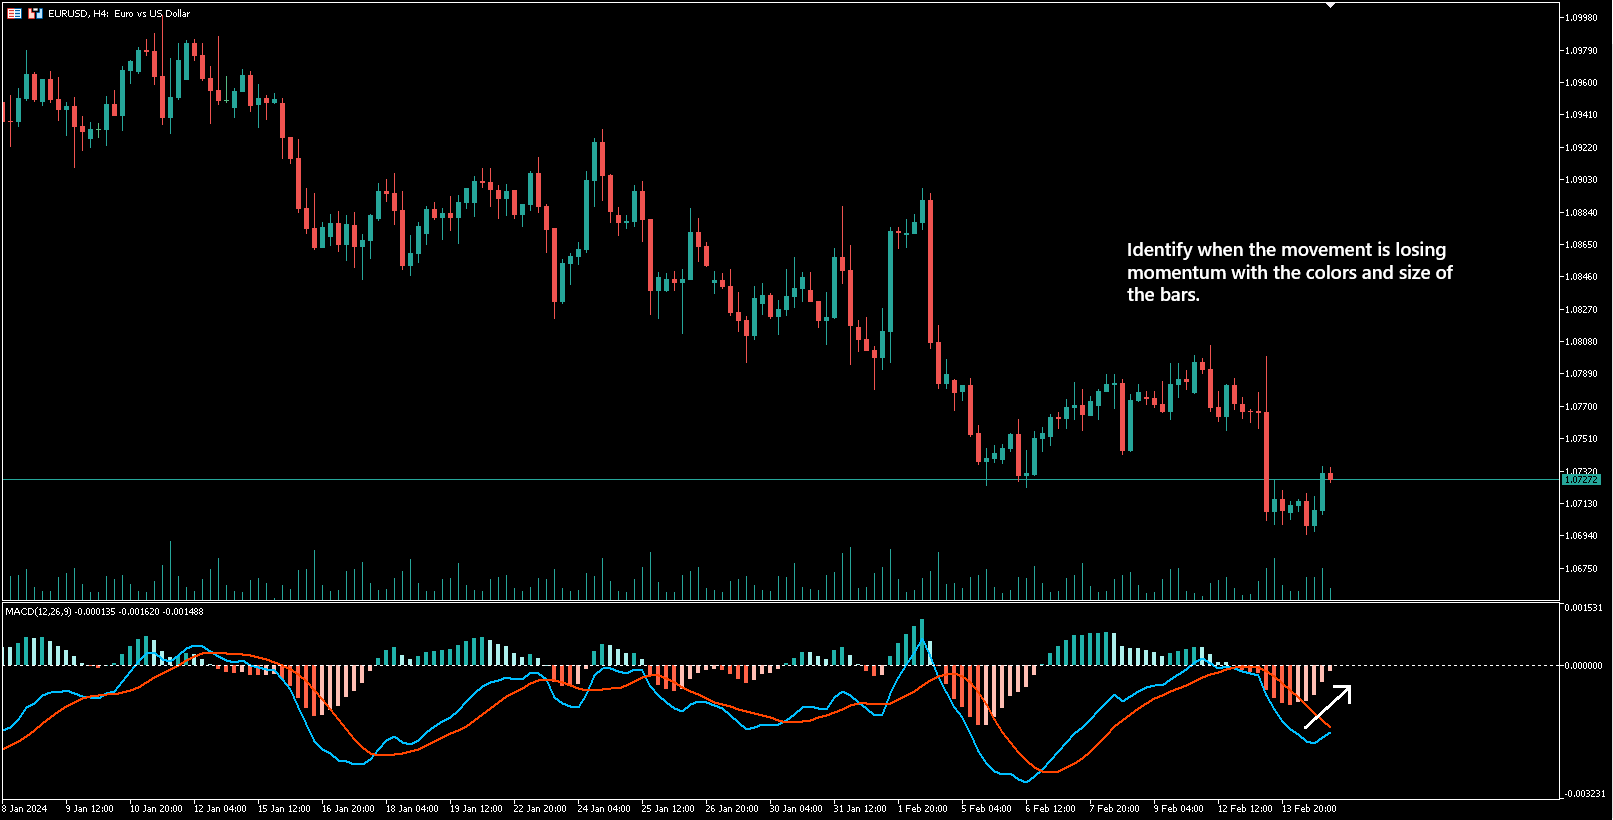
- Cambio di Colore Secondo il Momentum: Le barre cambiano colore con i cambiamenti di momentum del mercato—verde per rialzista e rosso per ribassista—fornendo segnali visivi immediati per possibili inversioni di tendenza.
- Visualizzazione Personalizzabile: Gli utenti possono scegliere di nascondere la linea MACD, la linea di segnale o l'istogramma in base alle loro preferenze, offrendo maggiore flessibilità e personalizzazione.
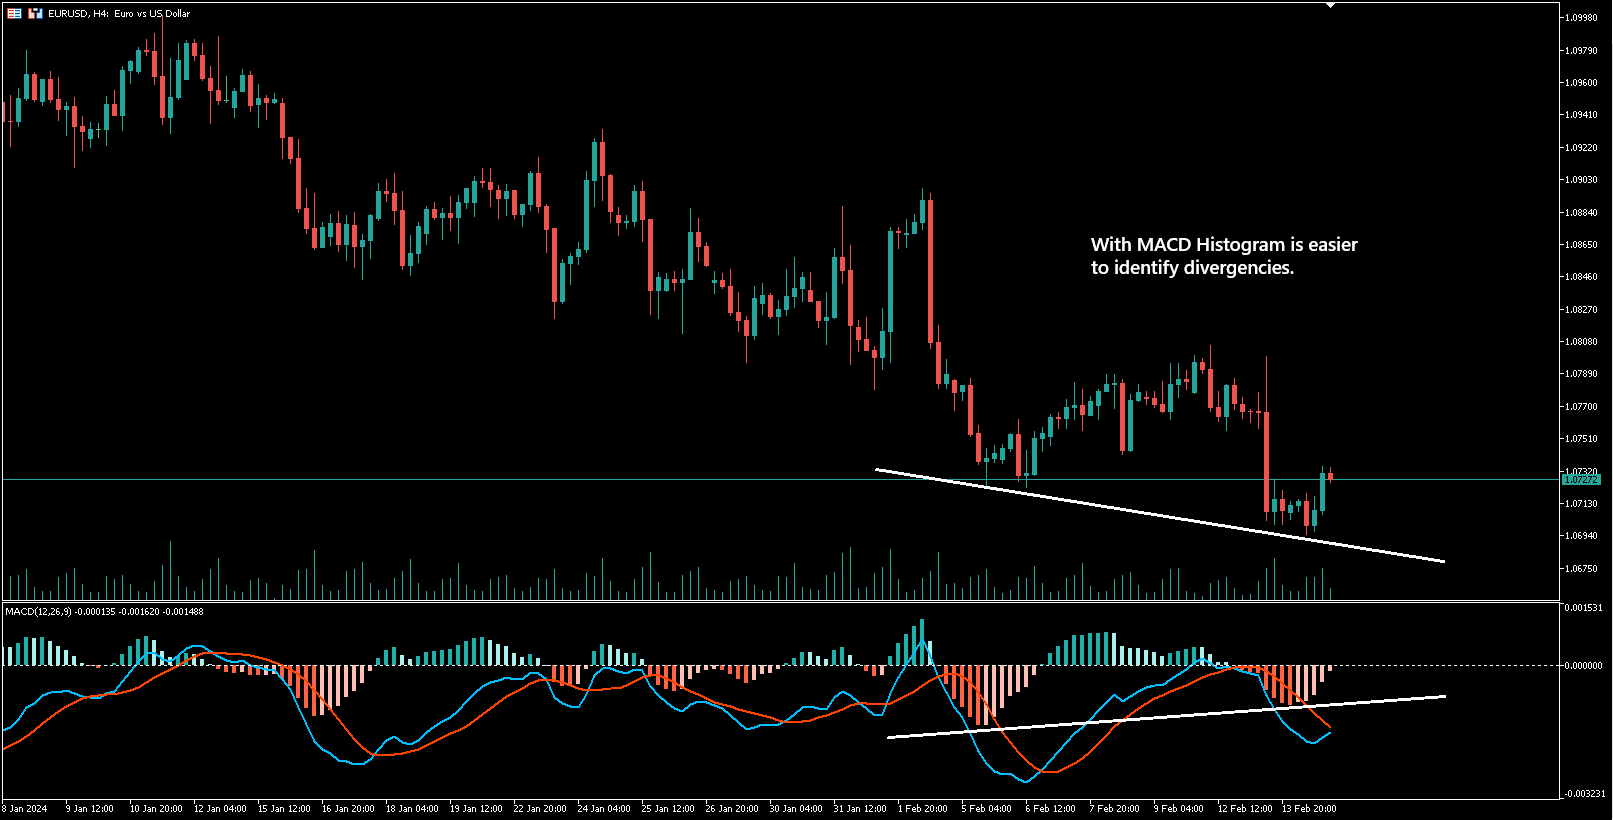
- Rilevamento delle Divergenze: L'indicatore evidenzia le possibili divergenze tra i movimenti dei prezzi e il MACD, segnalando potenziali inversioni di tendenza nel mercato.
Inputs:
- Fast EMA Period (Periodo EMA Veloce)
- Slow EMA Period (Periodo EMA Lento)
- Signal SMA Period (Periodo SMA del Segnale)
- Show MACD/Signal Lines (Mostra Linee MACD/Segnale)
- Show Histogram (Mostra Istogramma)
Questi inputs permettono ai trader di adattare l'indicatore alle loro strategie di trading specifiche e alle condizioni del mercato.
Perché scegliere l'Indicatore MACD Histogram?
- Intuitivo e Facile da Usare: Progettato sia per trader principianti che esperti, questo indicatore semplifica l'analisi delle tendenze del mercato con segnali visivi chiari.
- Personalizzabile: Regola le impostazioni per adattarle al tuo stile di trading, che tu preferisca un'analisi dettagliata delle linee o grafici puliti e minimalisti.
- Informazioni Potenti: Rileva rapidamente i cambiamenti di momentum e le potenziali inversioni, consentendo decisioni di trading più informate e tempestive.
Pronto a elevare la tua strategia di trading? Scarica oggi stesso l'Indicatore MACD Histogram e ottieni una visione più chiara e azionabile dei mercati!
excellent indicator