Standardize
- Indicatori
- Manuel Espinosa
- Versione: 1.0
The "Standardize" indicator is a technical analysis tool designed to standardize and smooth price or volume data to highlight significant patterns and reduce market noise, making it easier to interpret and analyze.
Description & Functionality:
-
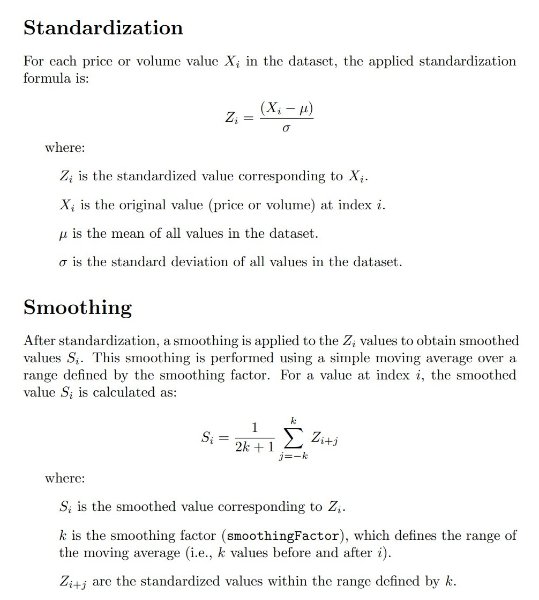
Standardization: The indicator standardizes price or volume values by subtracting the mean and dividing by the standard deviation. This converts the data into a distribution with zero mean and standard deviation of one, allowing different data sets to be compared on a common scale.
-
Smoothing: Applies smoothing to standardized values to minimize short-term fluctuations and highlight underlying trends. This is achieved by a simple moving average, based on a user-specified smoothing factor.
-
Customizable Parameters: The indicator allows customization through various input parameters, such as smoothing factor (), horizontal offset (), and applied price (), which can be open, high, low, close, or tick volume. Smoth Shift AppliedPrice
Uses:
-
Trend Detection: By standardizing and smoothing the data, the indicator can help identify underlying trends in the market, making it easier to make trading decisions based on technical analysis.
-
Identification of Deviations: Can be used to identify when prices or volumes deviate significantly from their mean, which could indicate overbought or oversold conditions.
-
Comparison between Instruments: By standardizing the data, it makes it easier to compare between different financial instruments or between different time periods for the same instrument.
-
Trading Strategies: Can be integrated into more complex trading strategies, as part of algorithmic trading systems, where data standardization and smoothing are essential preliminary steps for the application of predictive models.
-
Volatility analysis: Standardizing volume and smoothing data can provide insights into market volatility, helping to fine-tune risk management strategies.


The calculations are excellence!