Chart High Low Levels
- Indicatori
- Igor Pereira Calil
- Versione: 1.0
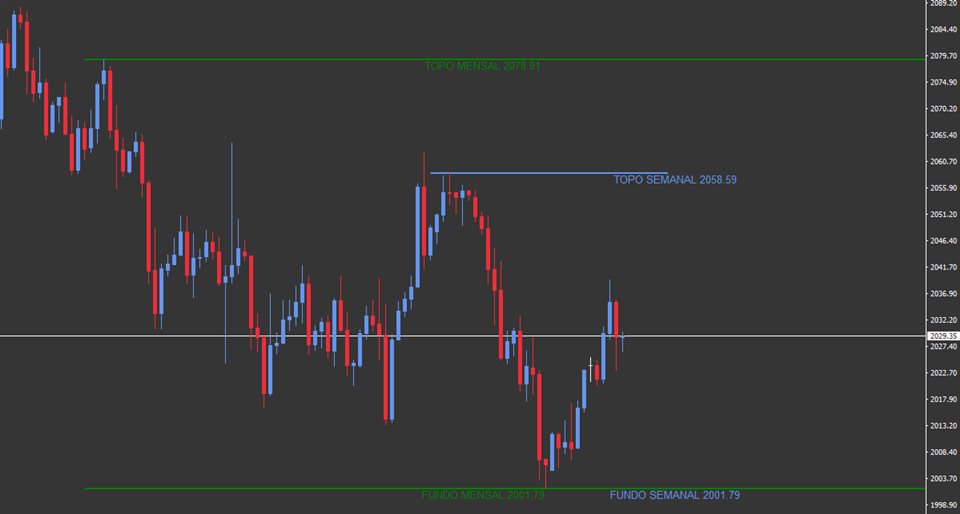
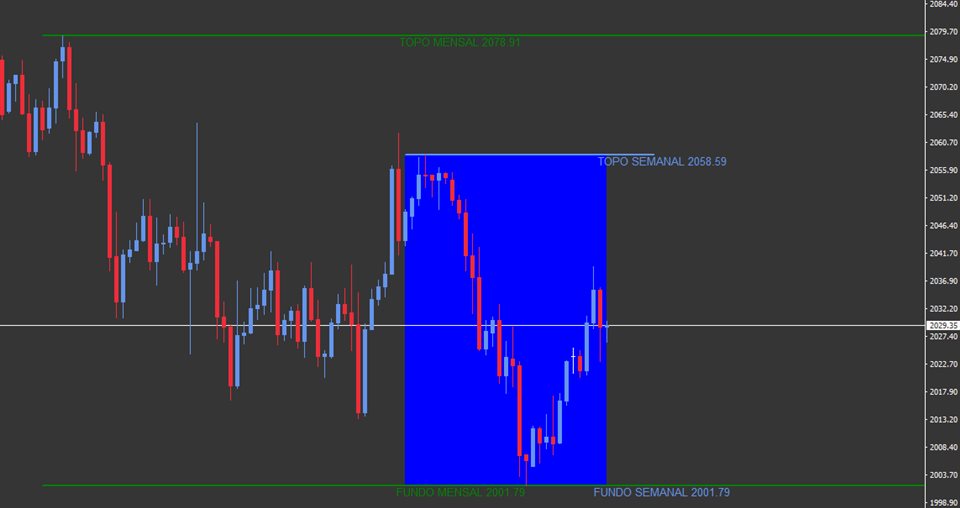
The Chart High Low Indicator is an indicator for META TRADER 4, with the function of analyzing and showing the weekly MAXIMUM, weekly MINIMUM, monthly MAXIMUM and monthly MINIMUM levels.
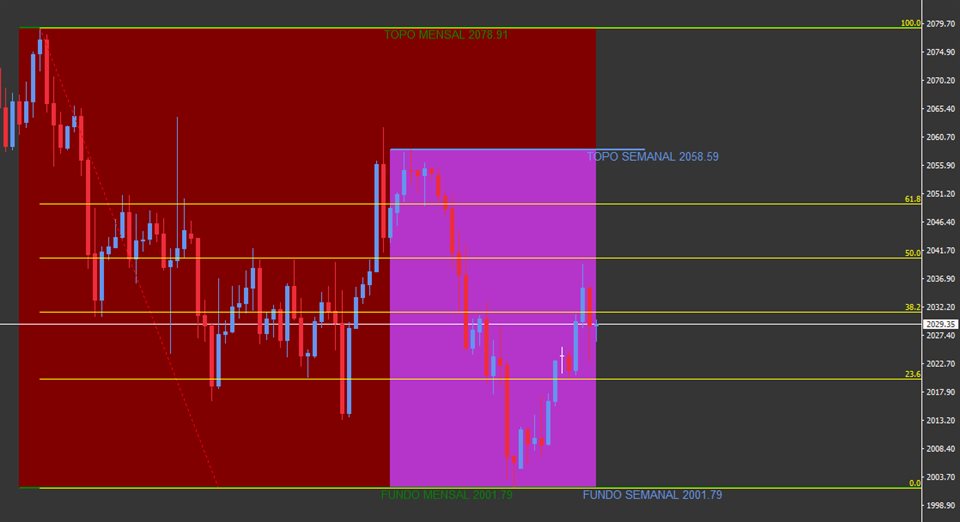
This can help a lot when creating TrendLine or even plotting your FIBONNACI line, as there is no need to access Internet sites to analyze the MAXIMUM/MINIMUM levels.
In graphical analysis, it can assist in breaking HIGH/MIN levels, creating support and resistance breakOuts.
There are "mark" functions on the indicator, which can mark areas with a rectangle, making them even more visible on the chart. This is optional, and is disabled by default, you can enable it.
This is simple but functional for analytics.
- SmatchBR
made with love and care.

