Chart Clarity Dashboard
- Indicatori
- Tariq Mahmood
- Versione: 1.0
- Attivazioni: 5
Chart Clarity Dashboard
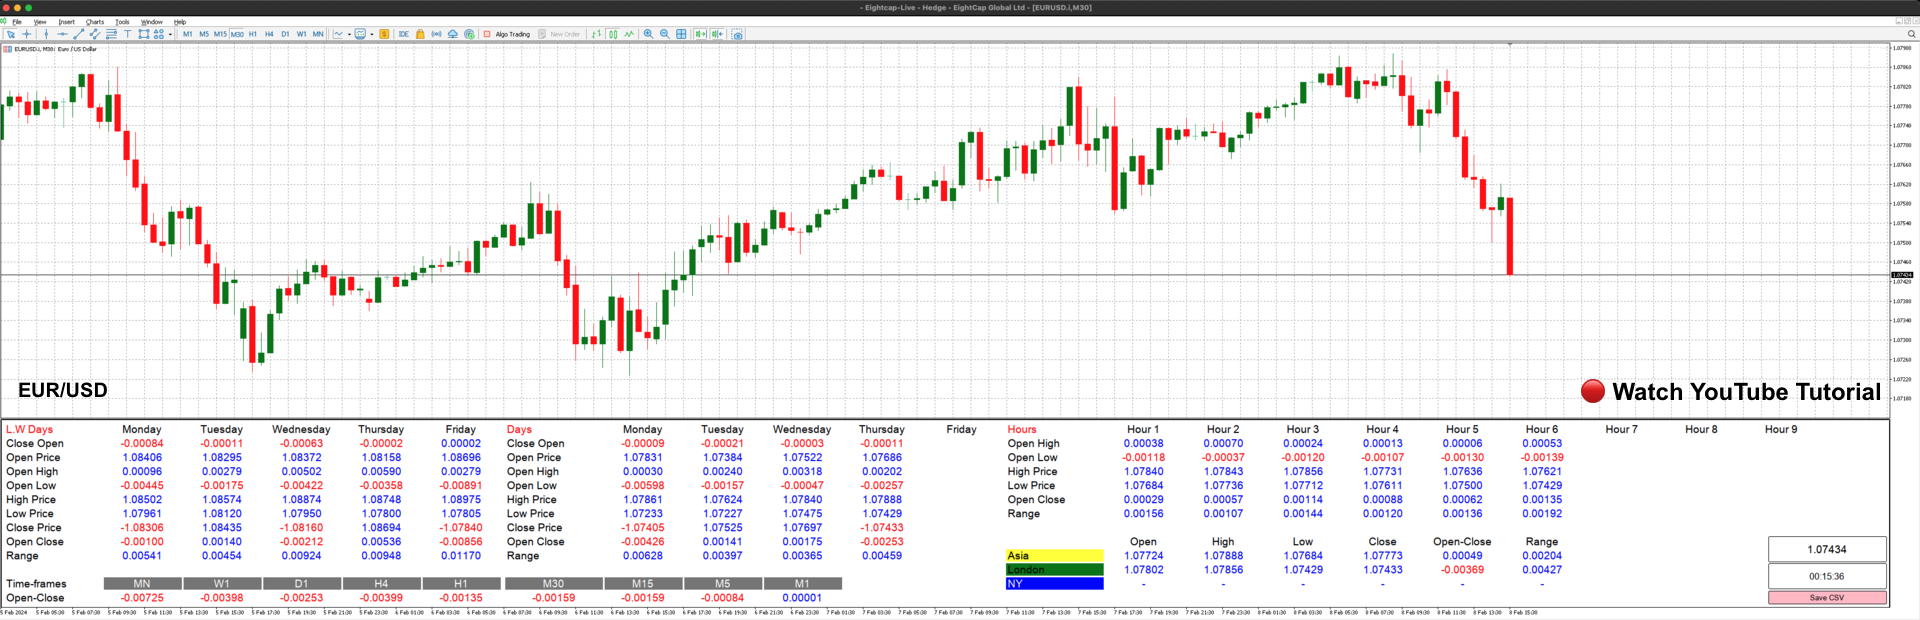
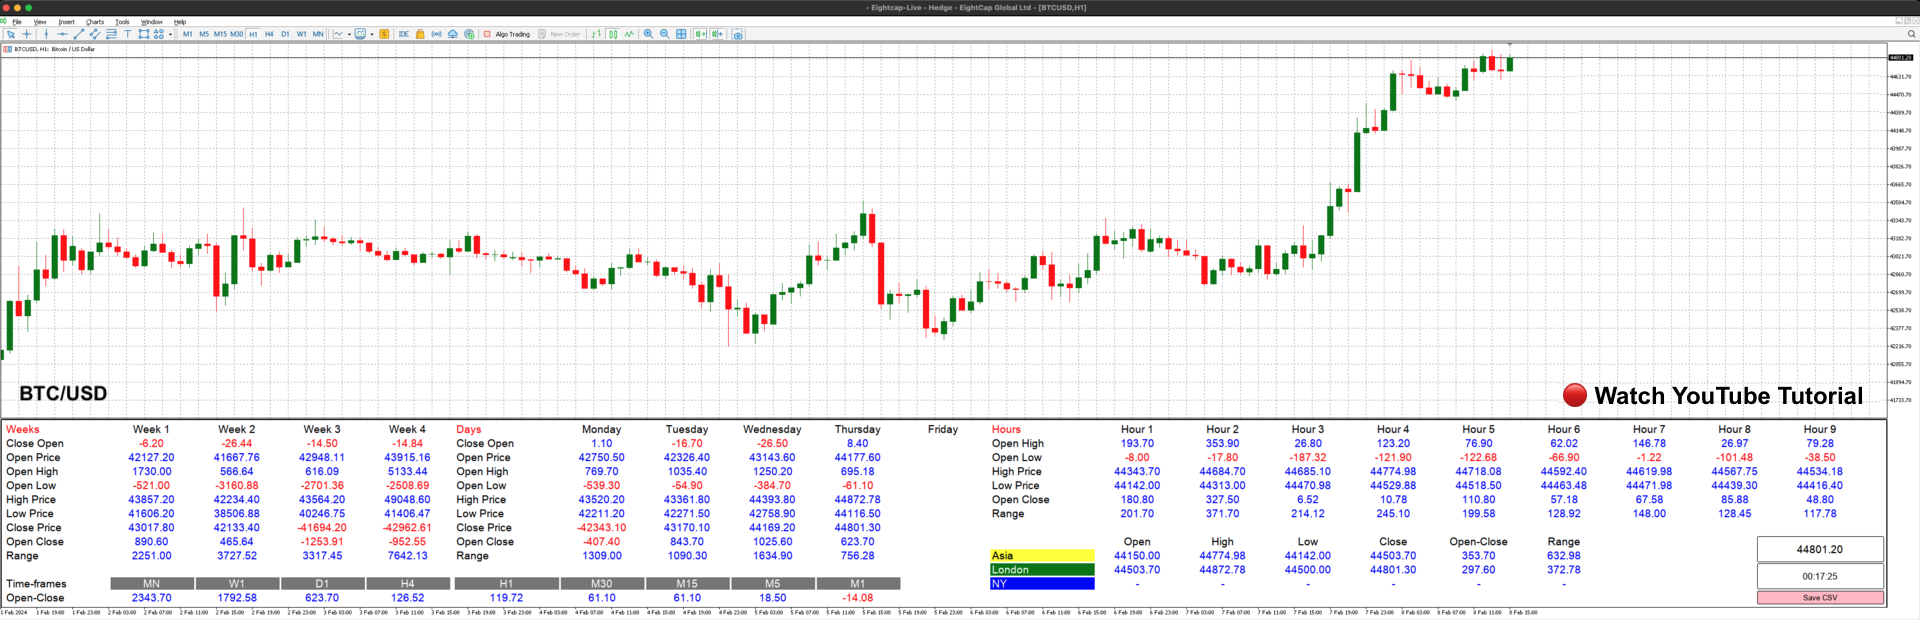
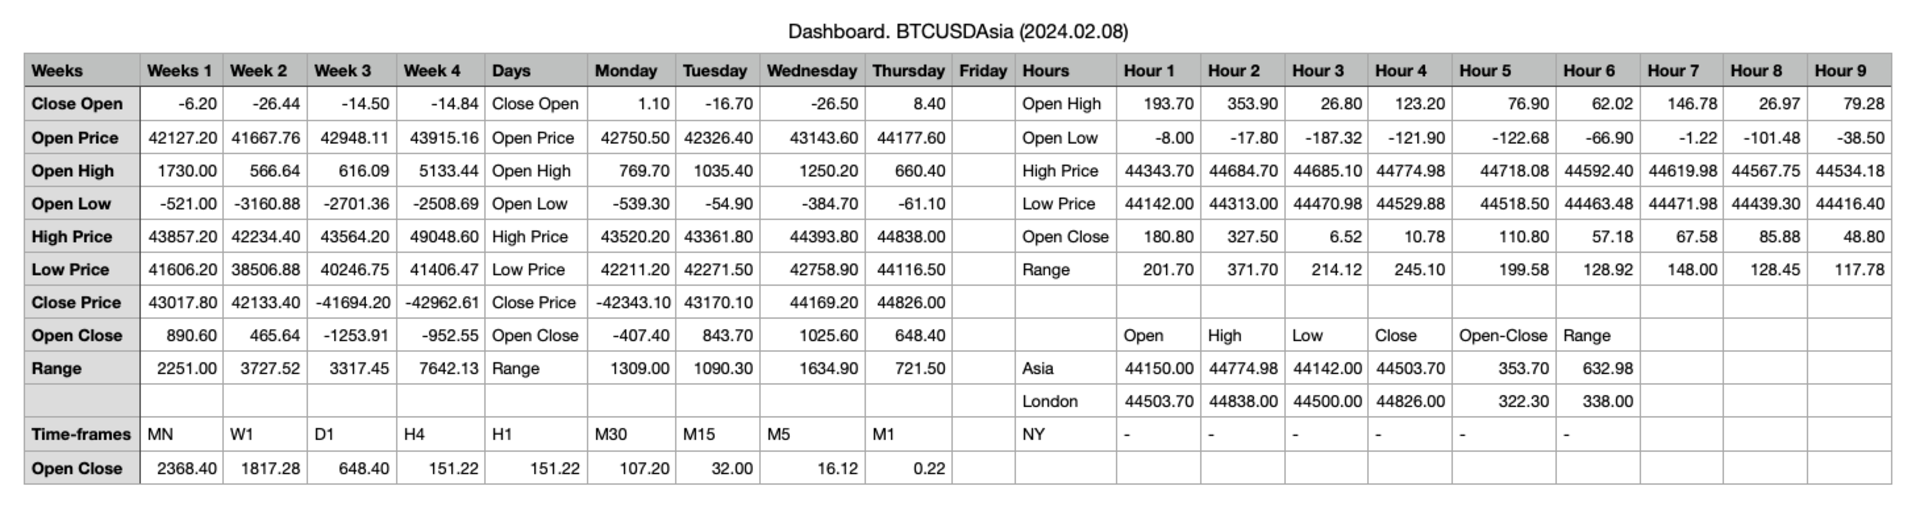
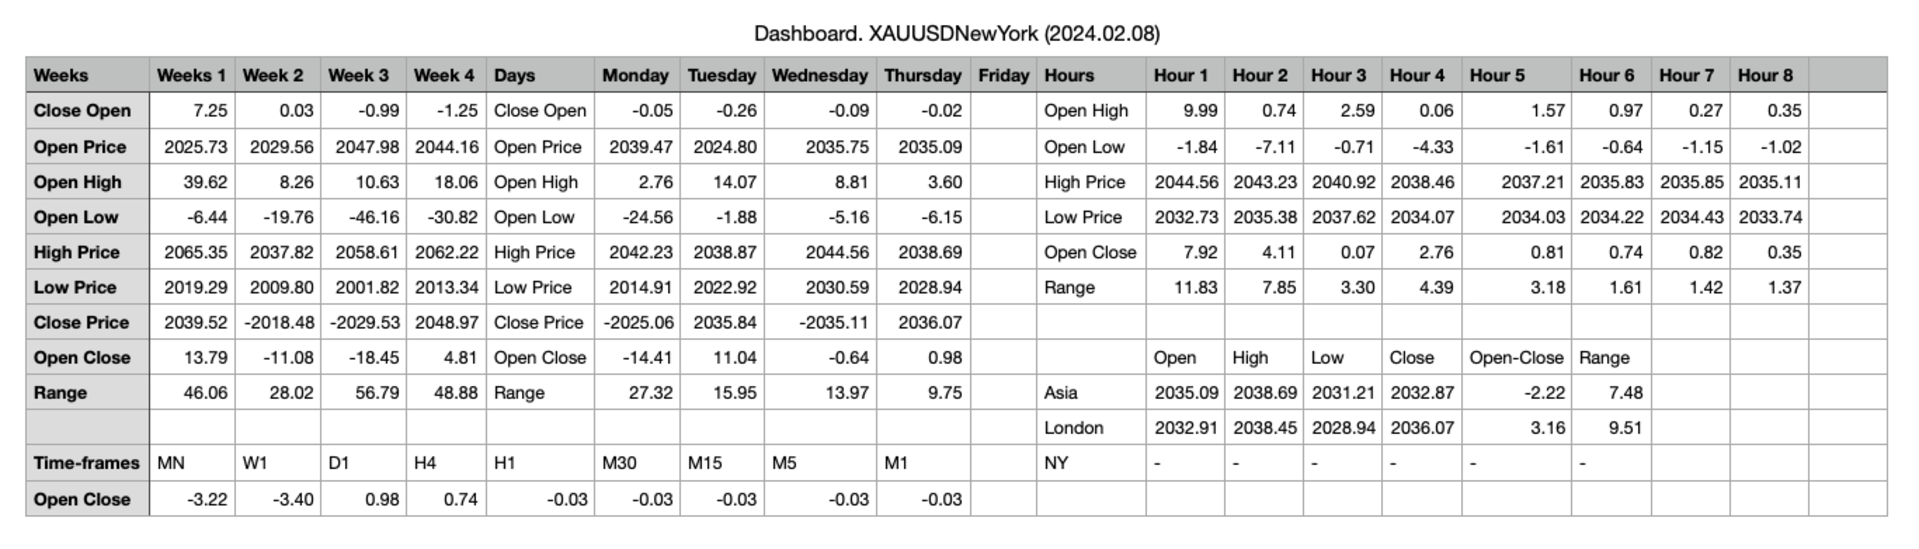
The Chart Clarity Dashboard provides clear insights into price movements for various financial instruments like currency pairs, cryptocurrencies, equities, commodities, and indices. This dashboard displays detailed price information in real-time, making it easier for traders to make decisions quickly. It shows price movements down to the second, giving you essential data before you trade or analyze charts.
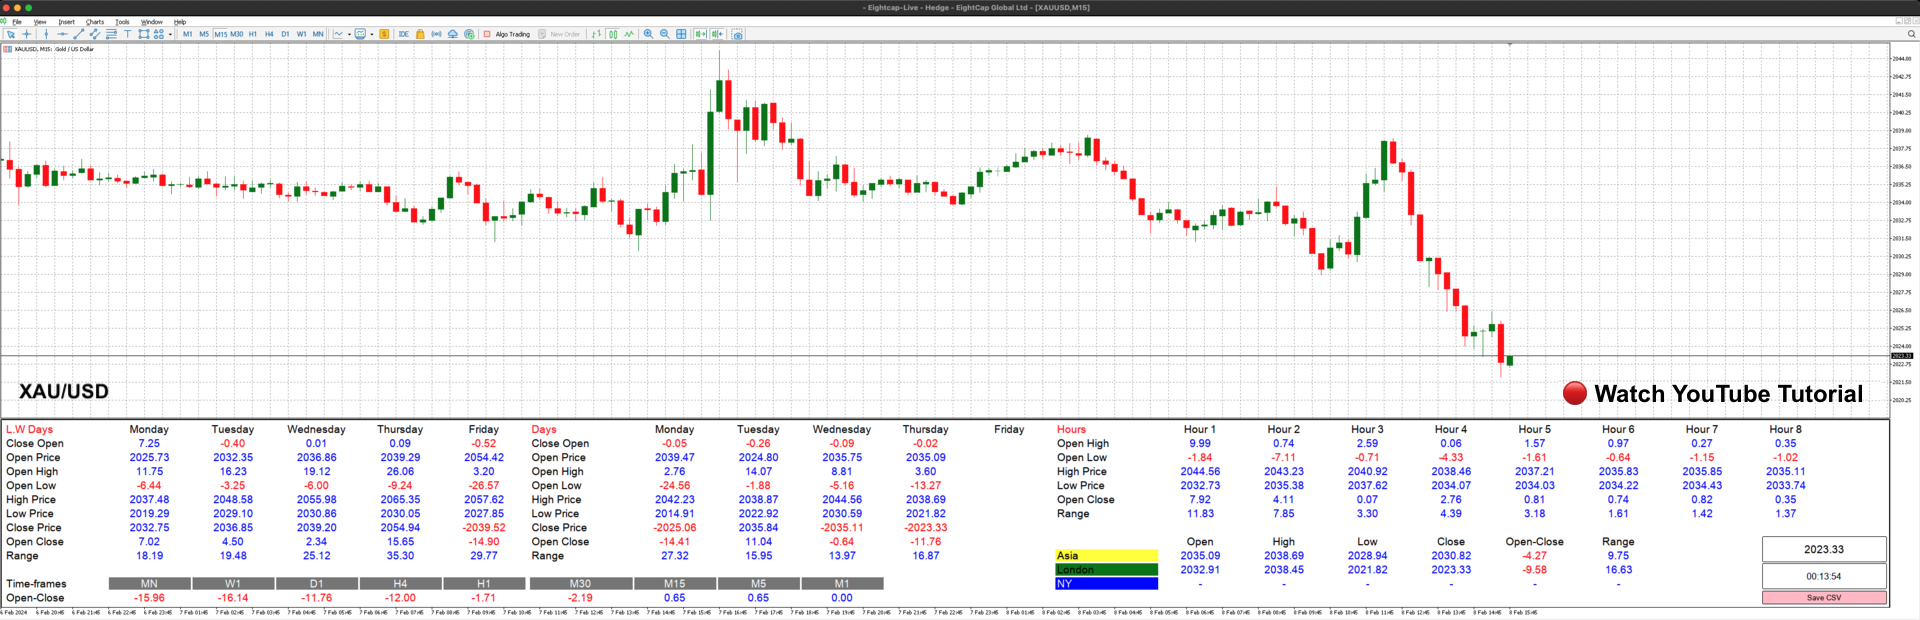
Chart Clarity Dashboard allows you to monitor price changes across all time frames and session. Changes in colour of numerical values indicate bullish or bearish momentum, showing whether the price is above or below the open price for the given timeframe.
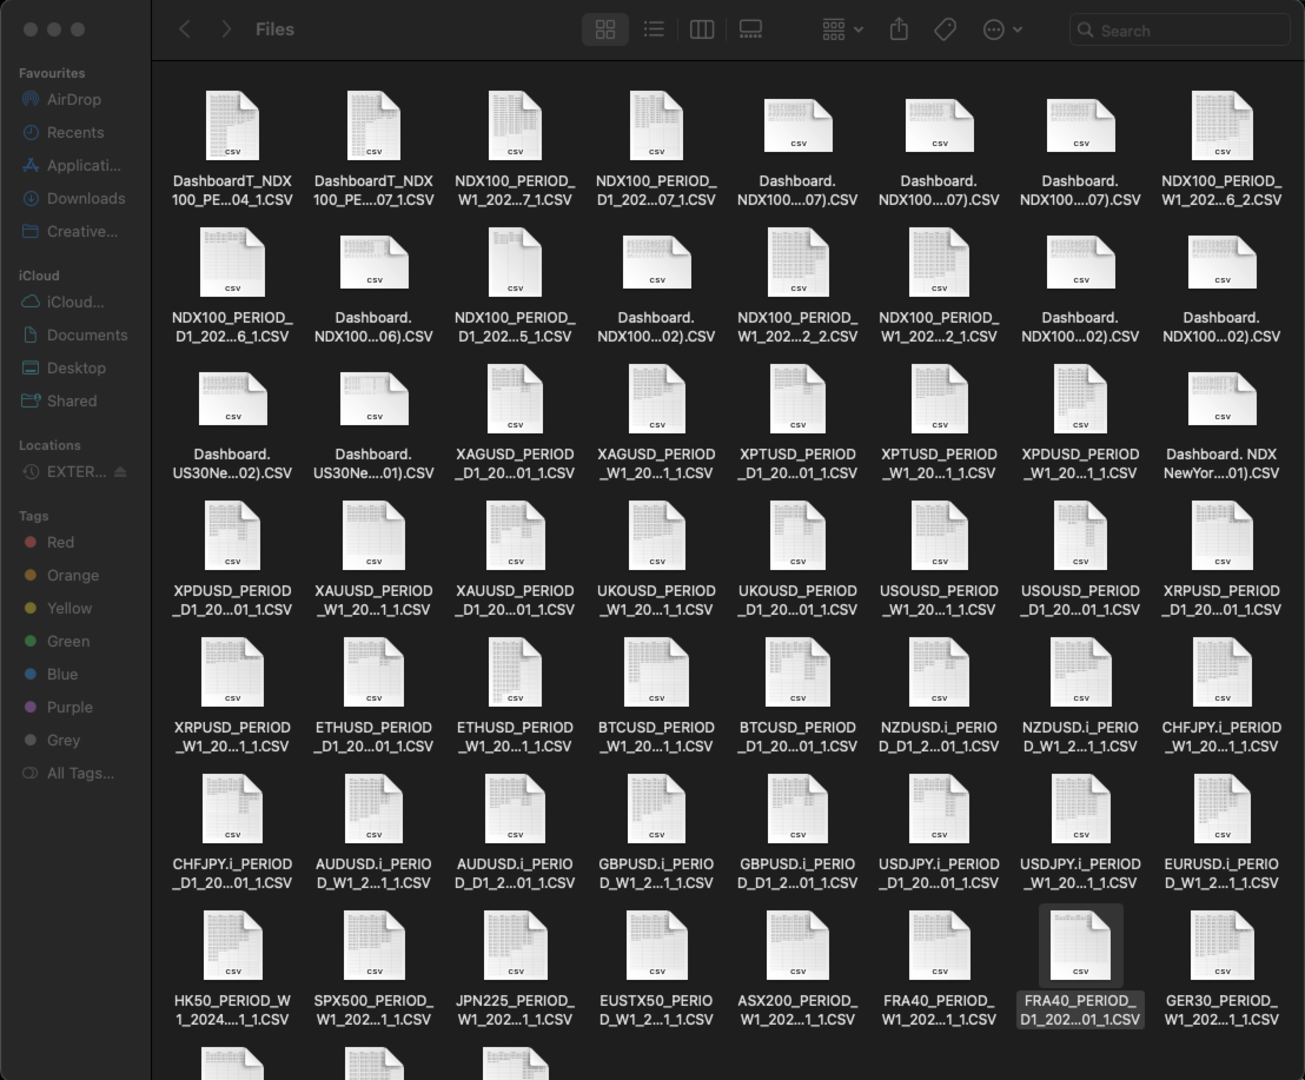
The dashboard also saves daily activity as a CSV file within an internal folder on MT5, making historical data easily accessible for future analysis. Please refer to our attached YouTube video for valuable insights into the functionality and detailed breakdown of how the Chart Clarity Dashboard presents essential information, assisting traders view charts with clarity.
Key Features
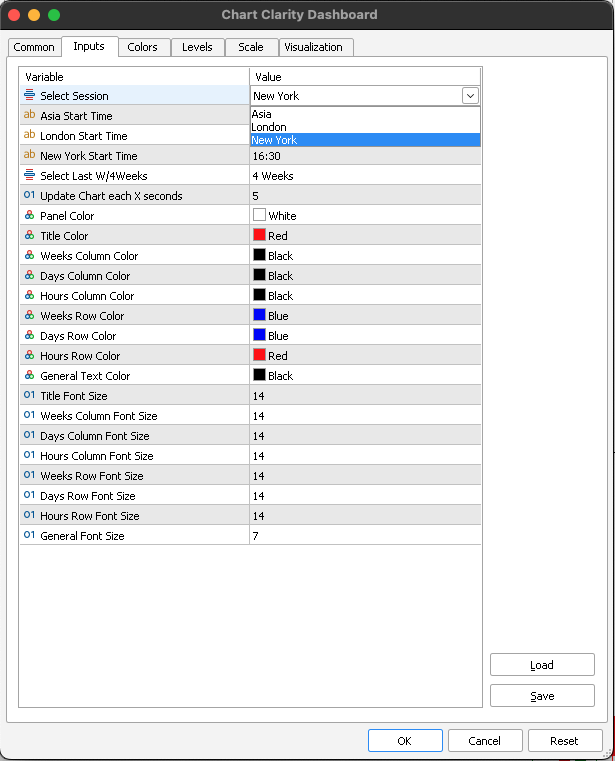
- Analyze price action during the Asia, London, and New York trading sessions.
- Adjust the timing for the Asia, London, and New York trading sessions manually, according to your country's time zone.
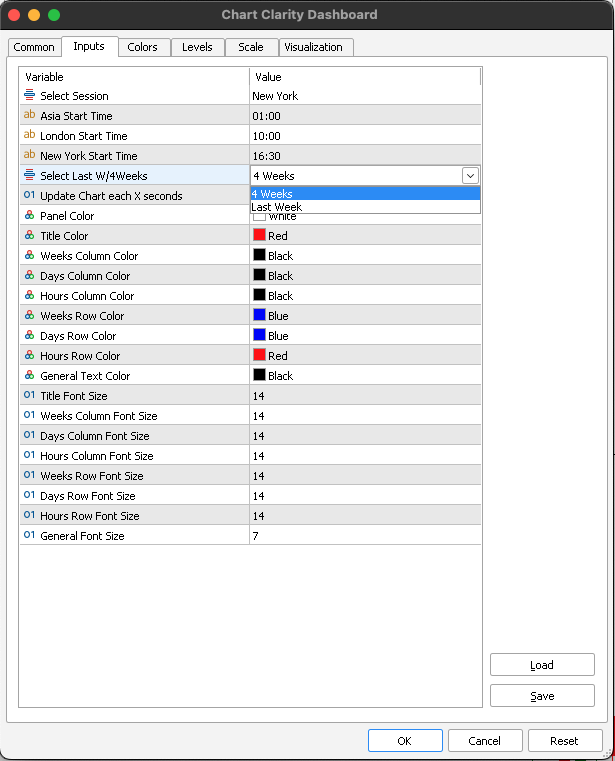
- Review price action for the current week, last week and last month.
- Track price action for the entire month down to the present second.
- Monitor price action hourly, across all trading sessions.
- View dynamic price action across all time frames and trading sessions in one place.
- View Candle close countdown timer specific to your trading time frame.
- Save daily trading activity in a CSV file for future reference or chart analysis.
- Experience real-time updates.
- Quickly visualize bullish or bearish momentum from market open, through colour representation of numerical values.
- Offers an intuitive interface for easy interpretation and analysis of incoming data.
- Displays fluctuations in trading activity throughout different hours of the trading session, identifying hours with concentrated trading activity.
- Visual representation of patterns in price action such as spikes, divergences or trends to to assist in making trading decisions.
- Can be used in conjunction with other technical indicators for comprehensive market analysis.
- Enables users to analyze historical price action to identify past trading patterns and trends for chart analysis.
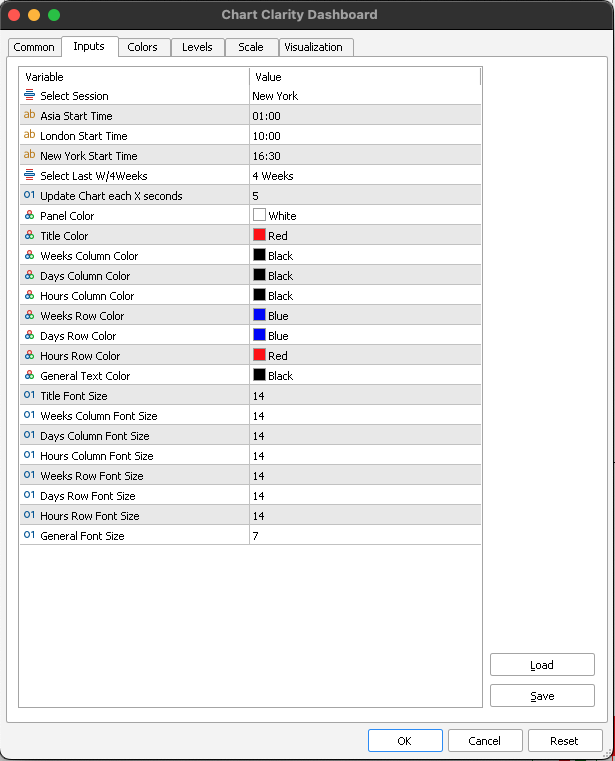
- Allows users to personalize settings such as font colour, session selection, and time periods.
Pricing
We have set a premium price for our MT5 indicators, reflecting over two years of development, rigorous backtesting, and diligent bug fixing to ensure optimal functionality. Our confidence in the precision and accuracy of our indicators is such that we regularly showcase them in real-time market conditions through daily content on our social media channels.
Our belief in trading simplicity, adhering to the principle of buying low and selling high, is echoed in our indicators' clear display of potential entry and exit points. We consistently provide daily content demonstrating our indicators in action. Additionally, we offer traders the opportunity to rent our indicators for $66 per month. This allows traders to test the indicator for one month with their chosen trading pair before committing to a yearly subscription.
We are committed to monitoring user feedback closely and making necessary improvements to our indicators should any bugs arise, ensuring that traders have access to the most effective tools for their trading endeavours.
MT4 Version Available: Yes
Currency Pairs: Any
Timeframe: Any
Timezone: Any
Brokers: Any
Account Type: Any
Prop Firms: Yes
Multi-Currency Indicator: Yes
Compatibility: Chart Clarity Dashboard works with currency pairs, indicies, equities, commodities and cryptocurrencies
BLOG: View settings for your selected trading pair CLICK HERE
NOTE: If you need help with settings or have any questions, please feel free to leave a comment in the comment section below. You can also visit our blog where you can leave a comment, and we'll respond promptly.
Numerical Value Colour Indication
- Blue Numerical Values - Bullish Momentum: Indicates the price is above the open or positive for the corresponding session or time-frame
- Red Numerical Values - Bearish Momentum: Indicates the price is below the open or negative for the corresponding session or time-frame, a (-) minus sign will appear next to the price
Note: Any trading decision made should be based on independent analysis and a thorough understanding of fundamentals, rather than solely relying on the colour of numerical values.
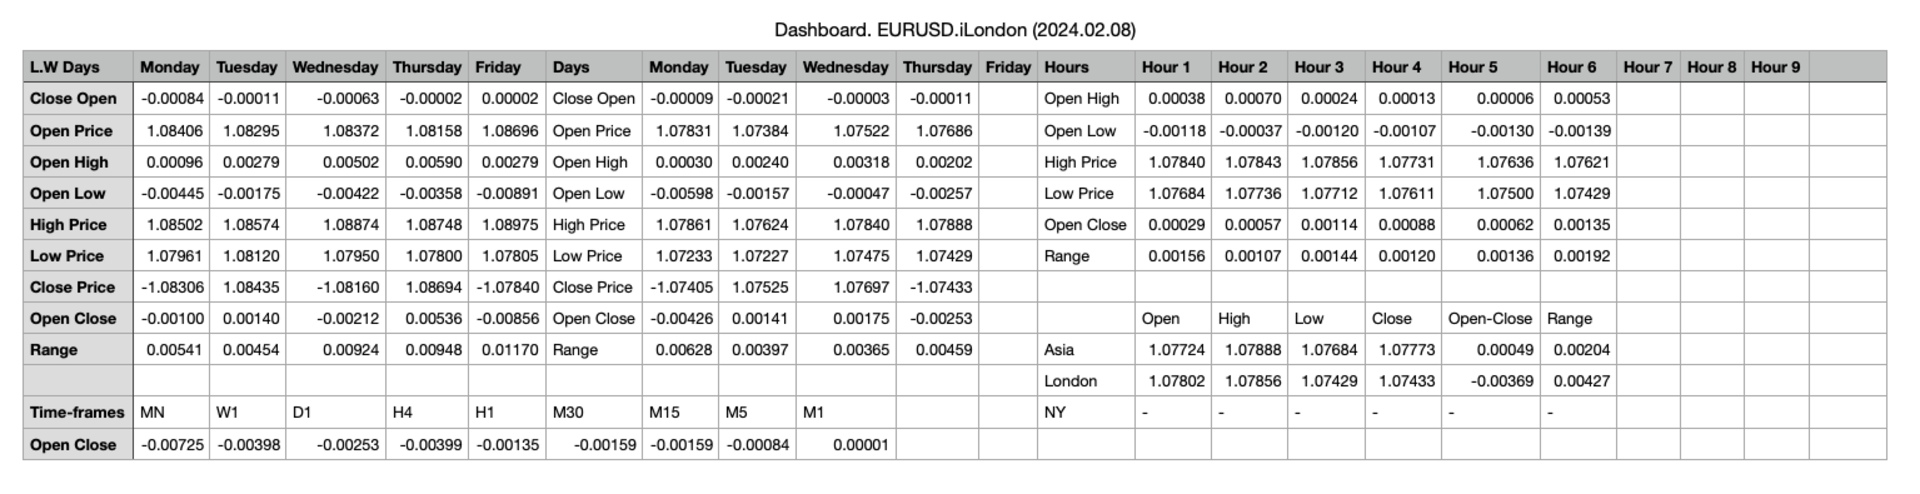
Last Week/ Days
- Close Open: Difference between close & open price - Price gapping up or gapping down
- Open price: Opening price for the day
- Open High: Difference between open price & daily high
- Open Low: Difference between open price & daily low
- High Price: Highest price for the day
- Low Price: Lowest price for the day
- Close Price: Close price for the day
- Range: Difference between the highest and lowest prices of the day
Sessions
- Open: Opening price for the session
- High: Highest price during the session
- Low: Lowest price during the session
- Close: Close price for the session
- Open-Close: Difference between session open price & close price
- Range: Difference between the highest and lowest prices of the session
Hours
- Open High: Difference between open price & hourly high, within the respective session
- Open Low: Difference between open price & hourly low, within the respective session
- High Price: Highest price for the hour, within the respective session
- Low Price: Lowest price for the hour, within the respective session
- Open Close: Difference between open & close price for the hour, within the respective session
- Range: Difference between the highest & lowest prices for the hour, within the respective session
Time-Frames
- Open - Close: Difference between open & close price within the respective time frame
Extras
- Price: Current price of trading pair
- Time: Countdown timer for the next candle formation, within the respective time frame
- Save CSV: Save entire day's activity as a CSV file within an internal folder on MT5
Disclaimer
We would like to emphasize that the information provided by seller and its affiliates, including its premium software subscribers, is not intended as financial advice and should not be construed as such. The content and opinions shared in our social media content and premium software subscription are for general informational purposes only, and they do not offer specific advice or recommendations for individuals or entities.
The seller and its affiliates do not endorse or recommend any securities, and our content is not an offer or solicitation to buy or sell any securities. The information provided in our social media content and premium software subscription may not be exhaustive and is subject to change without notice.
It's important to note that our social media content, research, information, and disclosures do not guarantee financial success or profitability. They provide insights into our investment strategies and how we manage our private capital in the financial markets.
Given the inherent risks of financial markets and the fact that past performance does not guarantee future results, we cannot assure specific outcomes or returns. Investing in financial markets carries the risk of loss.
Therefore, we advise conducting your own research and seeking professional advice before making any investment decisions. The information and opinions presented in our social media content and premium software subscription are meant for general informational purposes only and do not constitute specific advice or recommendations for any individual or entity.
By purchasing any premium software subscription, you acknowledge and accept that the seller and its affiliates are not liable for any investment decisions made based on information provided through social media content or premium subscription software.